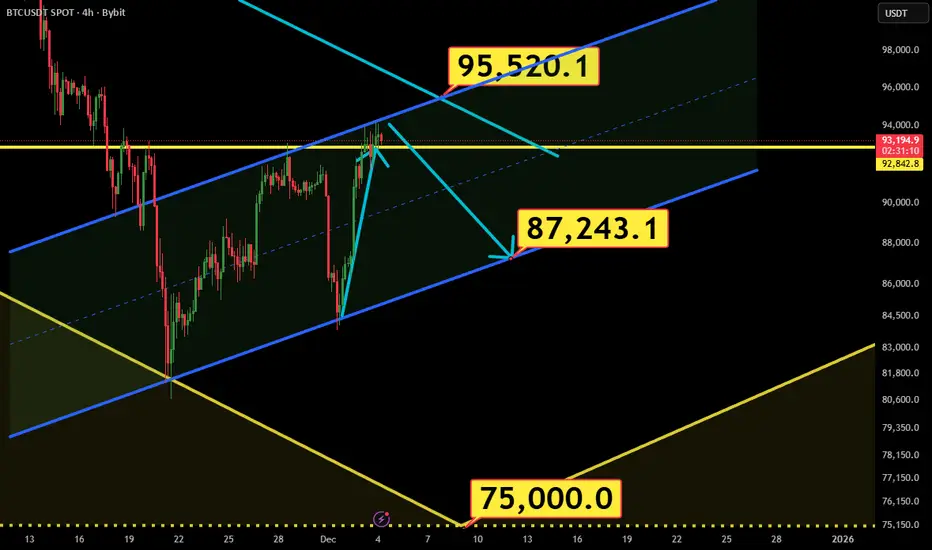
Not ready yet!If Bitcoin fails to secure a 12-hour close above 95,000, a corrective move toward 87,000 and even 75,000 remains on the table. However, one way or another, the market structure is ultimately poised to break upward toward 108,000.
Community ideas
GOLD MARKET UPDATEHey Everyone,
As we close out the week, price action on the 1 hour chart continues to consolidate within the defined Goldturn range between 4193 and 4233. The 4193 weighted Goldturn has held as a structural support level, generating the rebound that carried price back into 4233.
Earlier in the week, we observed a cross and lock above 4233, which leaves the 4275 gap unfilled. This upside inefficiency will remain on our radar as long as price holds above the mid range structure.
We will return Sunday with a full multi-timeframe breakdown and detailed trade tracking plan for the upcoming week.
Mr Gold

When Alt Season. Is it even happening ever again?This will be very short. Forget Alts season, it's not happening again here is why. No Lambo.
Social media Crypto gurus calling and hypes random coins every day. People are still hoping their precious alt coin will pump and make them a fortune. this is how looks all influencers accounts.
They are Calling Alt seasons every day since 2023. Did they even held some BTC ?
Back in the days in the bull run you could buy any Alt, next day it was 30% up than 100% and 300% and more in few weeks. You could literally buy anything and it went up.
But these times are gone. Game has changed and played changed.
📌 Number of coins
2017: ~1,300 coins → altseason
2021: ~9,800 coins → altseason
2025: 25,000+ coins + thousands of memes → NO ALTSEASON, only isolated pumps
When there are 25x more coins than in 2017, the same amount of liquidity gets diluted.
Altseason today = micro-seasons inside specific narratives, not a giant synchronized run.
Which is difficult to predict and you will not make it just by making technical analysis, you must pick the right one in the sea of coins. It's literally like buying a lottery ticket.
📌 The players has changed
Altseason used to be simple: money flowed into Bitcoin → profits rotated into large caps → then mid caps → then low caps → and everything exploded together. That era is gone.
📌 No more big money Rotations
Bitcoin buyers are now institutional- Blackrock , Fidelity, Vanguard and other ETFs...
Their clients are not here to sell at some point to rotate to some other Sh...coin.
Saylor is not gonna rotate in to some Sh...coins.
Yes, many people will run this playbook and influencers calling for this even every day since 2023. While it was one bitcoin show. Nothing else. Some promises of the future technology, new financial systems, faster than BTC... Its all BS...It's all small money spread to the sea of thousands and thousands of new coins created daily on Solana. It will not be enough to create such a parabolic moves as Alt season used to be.
📌 Individual pumps
It will be some individual coins pumping out of nowhere which you dont have a chance to predict Like ZEC recently. Of course some of you could argue that you been in this trade. I congratulate you if you did. But you will nor repeat this consistently on next 10 coins and most of people didn't catch this rather they did FOMO buy on the top and they are now 60% down, their investment will not turn in to hope and pray, While this was clean pump and dump and it will slowly die.
📌 Whats gonna happen next?
Lets have a look to the history top 10 coins in 2017. As you can see most of coins are not here anymore or they are simply not performing. They been just used for pump and dump and then slowly died. This is how most of the coins will end. and we can see it already here.Most coins never went above 2021 highs. Imagine holding Cardano
It has never seen ATH since 2021. Whats the chances it will pump when there is new better coins narratives again? This is basically how all alt coins looks like and they will end like most of them in 2017.
📌 Are we in bear markets?
is the BTC top in ? I think so and we will might see 45K as I predicted if you are in the alts is bad news for you, they will go much deeper and most of them will never recover after this shock. If you are Bitcoiner this is godsend. You can accumulate more sats. Because at some point BTC will see a new ATH again and again.
📌 Purpose of the Alts
VC are creating the coins, keeping the 70% of the supply. Makes a story around the coin launch it, advertise via big X influencers to pump by naive investors and then they are dumping it to them. It still repeats over and over.
Dont play this game anymore. New alts, narratives comes every-time, they come and disappear. I got you , your plan is to buy BTC, but first you want to make more money on Alts or meme so you got more BTC , but NO it's not gonna happen. You will only loose money and have less BTC in the end.
Wouldn't you be doing better if you just buying BTC and hold?
I wish you all success in the Crypto investing.
David Perk

GOLD → Consolidation above 4220. Bullish structureFX:XAUUSD is trading in a narrow range around $4,200, maintaining sideways momentum ahead of US inflation data. The market confirms a bullish structure...
The probability of a Fed rate cut in December remains at ≈90%.
Mixed US employment data:
– Jobless claims fell to their lowest level since September 2022.
– Layoffs in November reached a two-year high.
The key benchmark today is the PCE index for September (data delayed due to the government shutdown).
Gold is awaiting new signals on inflation. Range trading is likely until the release of PCE data, which may set the direction of movement ahead of the Fed's decision.
Resistance levels: 4238, 4262
Support levels: 4220, 4183
If the bulls hold their ground above local support at 4220, we will have a chance to break through 4238 and retest 4262. However, a breakout of the trading range resistance could trigger a continuation of the rally towards the ATH.
Best regards, R. Linda!

Gold Trade ideaGold (XAUUSD) is holding above the rising trendline support. A pullback toward the support zone is expected before a bullish continuation. A breakout above 4245 resistance could open the way toward the 4275–4299 levels.

XAUUSDHello Traders! 👋
What are your thoughts on GOLD?
Gold continues to trade within a short-term ascending channel and is now approaching the upper boundary of this structure. This region also aligns with a major resistance zone formed by the previous swing high, creating a strong confluence area.
As price enters this resistance cluster, we expect selling pressure and a potential rejection. Based on the current momentum, it does not appear likely that gold will easily break above this zone in the short term.
Therefore, the more probable scenario is:
1-A pullback toward the lower boundary of the ascending channel
2- If the channel breaks to the downside, an extended decline toward the next key support level becomes likely
Don’t forget to like and share your thoughts in the comments! ❤️

Gold - The bullrun top happens now!✂️Gold ( OANDA:XAUUSD ) is heading for a major reversal:
🔎Analysis summary:
After the all time high breakout back in 2024, Gold has been rallying about +115% until today. During this entire move, Gold did not create any real correction. Considering that Gold is currently retesting a major resistance trendline, the bullrun top happens now.
📝Levels to watch:
$4,000
SwingTraderPhil
SwingTrading.Simplified. | Investing.Simplified. | #LONGTERMVISION

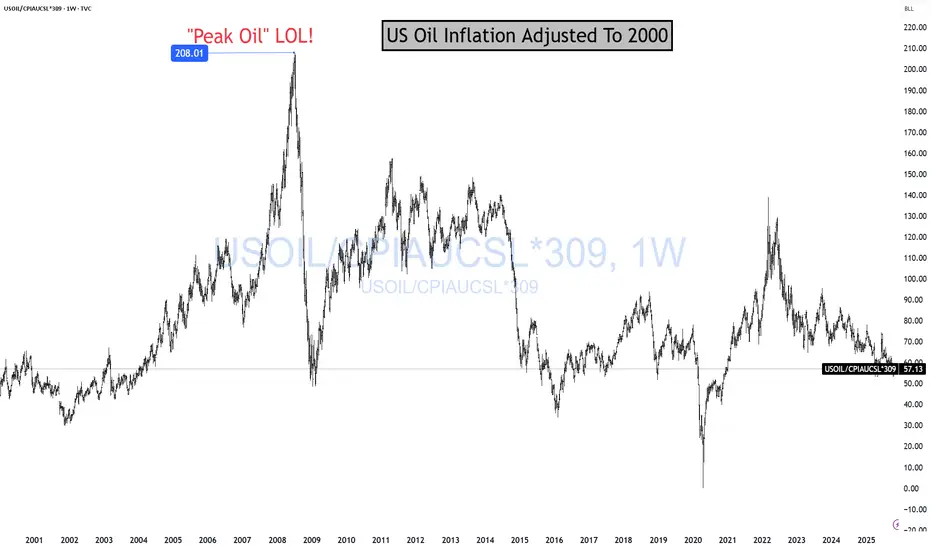
OIL Is Cheap For A ReasonOil is cheap because the global economy sucks! And it is "sucking" more and more every day. That's why Oil is on sale! Cheap! Cheap! And likely going to get more "cheap! cheap!" Me love you long time! Before I continue, story time.
In 2008, I could not convince anyone for the life of me that "PEAK OIL" was a scam! CNBC had T. Boone Pickens on twice a day, telling people we needed 238948735765374 barrels of oil to extract 1 barrel out of the ground.
Today, I can't convince anyone to skip EV, TSLA, AI, Crypto, the money has been made, GTFO. LOL!
As you can see, Oil is a much better long-term investment than all the hyped up trades pushed on to you daily.
Energy stocks make up about 3% of the S&P 500.
The Magnificent Seven circus? Roughly 36% of the entire index. LOL!
What are energy stocks going to do? Go to 1.5% of the SP500? Let it! Buy more!
BTW, you notice how they keep telling you AI will need all this energy? LOL! Wouldn't energy stocks reflect all that demand? LOL! SUCKA!
Anyway! Just look at the chart. If this makes sense to you and it fits your portfolio to BUILD a position long term, let me know in the comments. ;)
I have more on Oil here
THANK YOU for getting me to 5,000 followers! 🙏🔥
Let’s keep climbing.
If you enjoy the work:
👉 Drop a solid comment
Let’s push it to 6,000 and keep building a community grounded in truth, not hype.
GOLD: Consolidation Before the Next Leg Up?GOLD: Consolidation Before the Next Leg Up?
GOLD is holding strongly above the 4,150 support area, a level that has acted as a key psychological zone and the base of the previous bullish continuation. Buyers continue to react positively every time the price moves down into this area, suggesting that bullish momentum remains intact.
After the recent corrective movement, the price is now stabilizing and attempting to form a new short-term higher low. If GOLD manages to stay above 4,150 and build momentum, a bullish continuation toward the next resistance zones is highly possible.
Upside Targets:
4,258
4,290
4,360
You may find more details in the chart!
Thank you and Good Luck!
❤️PS: Please support with a like or comment if you find this analysis useful for your trading day❤️

December Altcoin Requests Only High Quality Picks This MonthFamily, December is a decision month. We are entering the final phase of the cycle where alts will either expand or get drained of liquidity. Positioning now matters.
📌 Deadline: December 6th, 2025
📌 Slots: 30 Alts.
📌 Criteria:
✔ Solid liquidity and clean structure
✔ Active narrative or ecosystem
✖ No dead or illiquid tokens
Only projects that fit the broader cycle and technical framework will be analyzed. As BTC completes dominance, rotation into alts becomes critical this is where future winners emerge.
Drop your suggestions below. Every pick counts.
If this resonates, like, share and let’s build the December list.

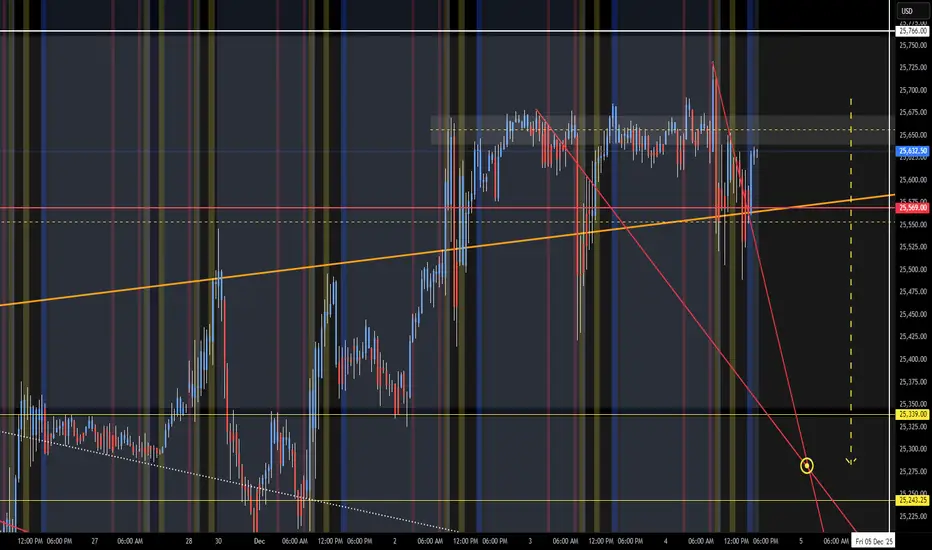
NQ Targets (12-05-25)Yellow arrow is lower target and 25,766 is upper Turn Zone. Past three days have been struggling to stay in range above orange TL below. O/N will have to pump it up and Reg Session will have to sell it off (big). Other option is snail life higher into Friday - Monday Long Play, just watch the head fakes long and failure of Dead Zone dip buying lift.
BTCUSD: Bullish Pressure Targets the $94,000 Resistance AreaHello everyone, here is my breakdown of the current BTCUSD setup.
Market Analysis
Bitcoin remains in a broader recovery phase after breaking out of the descending wedge structure that previously guided price lower. The initial breakout from the wedge led to a strong bearish continuation, but once BTC reached the major $90,200 Support Zone, selling pressure weakened and buyers stepped in aggressively. This support area has now been defended multiple times, confirming it as a key demand zone. From this base, price formed a clear Upward Channel, signaling a short-term bullish structure with higher lows respected along the channel support.
Currently, BTC attempted to break above the $93,700 Resistance Zone, but this move resulted in a fake breakout, showing that sellers are still active at this level. After the rejection, price pulled back toward the channel support and the $92,000–$90,200 support cluster, where buyers once again defended the market. Currently, BTC is trading back inside the ascending channel and attempting to resume the upward swing toward the upper boundary. The overall structure suggests a recovery trend as long as the price holds above the main support zone.
My Scenario & Strategy
My scenario is bullish, as long as BTC holds above the $90,200 Support Zone and continues to respect the ascending channel structure. I expect price to continue climbing toward the $93,700 Resistance Zone, which remains the key short-term target for buyers. A clean and confirmed breakout above this resistance would open the way for a continuation toward higher levels near the top of the channel.
Therefore, if price reaches the resistance again and produces another strong rejection, we may see a temporary pullback back toward the mid-channel area or even a retest of support. The bullish structure remains valid as long as BTC stays above $90,200. For now, the market supports a long bias with focus on a renewed attempt toward the $93,700 resistance zone.
That's the setup I'm tracking. Thank you for your attention, and always manage your risk.

Lingrid | GOLD Contraction Phase Before Trend ContinuationOANDA:XAUUSD is sliding back into the mid-range support after printing a new higher high, where price briefly tapped the upper resistance band. The current decline resembles a multi-leg corrective pullback rather than trend exhaustion, especially with the structure still respecting the rising trendline. Buyers have repeatedly reacted from this dynamic support, keeping the broader bullish sequence intact.
If the market stabilizes around 4,150, the next upward extension could aim once more toward 4,270, where liquidity remains untested above prior highs. A deeper dip into the trendline would still maintain bullish bias as long as the channel holds.
➡️ Primary scenario: accumulation above 4,150 → continuation toward 4,270.
⚠️ Risk scenario: a decisive break beneath 4,120 exposes 4,050 and delays bullish continuation.
If this idea resonates with you or you have your own opinion, traders, hit the comments. I’m excited to read your thoughts!

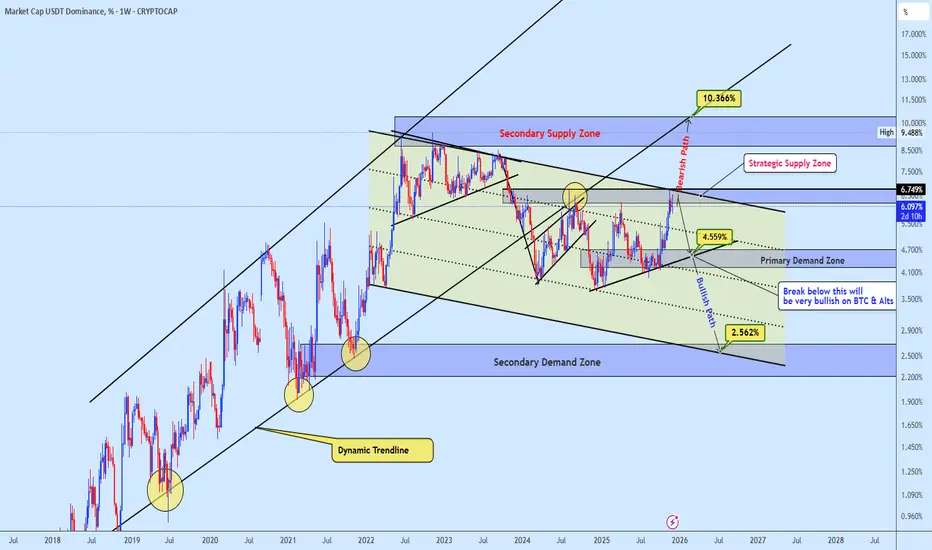
USDT Dominance at Decision Zone Rejection or Breakout?USDT Dominance remains the leading macro compass for true market direction, and the weekly structure is now sitting at a very sensitive inflection point. The chart has been oscillating inside a large descending channel since 2021, repeatedly respecting dynamic trendlines and reacting cleanly to both the secondary supply and demand zones.
Price is currently positioned near the upper boundary and trading inside the Strategic Supply Zone, with clear rejection pressure. The bearish path remains valid as long as price holds below the supply ceiling, where any expansion lower would target the mid-channel region around 4.55% first, followed by the deeper liquidity pocket toward 2.56% at the primary demand zone. A breakdown into that area historically aligns with strong upside phases in BTC and the broader altcoin market, as shown in previous cycles.
However, a weekly breakout and acceptance above the supply zone would change the narrative entirely. Continuation strength could propel dominance into the 9.48%–10.36% range, which would typically translate into aggressive liquidity rotation back into stablecoins and increased selling pressure across crypto majors and alts.
This is a pivotal zone. We should monitor the weekly close closely:
• Rejection here = bullish for BTC & altcoins
• Acceptance above = risk-off and likely capital shift into stablecoins
SI (Silver Futures) UpdateSI went oversold on MFI, since SLV options are so expensive, I decided to go long on GLD calls instead on that afternoon drop. Looked like a mistake for most of the evening, lol. Probably still is because SLV calls will have a better return tomorrow.
But, I will follow my rule, never kick yourself when you make money.
This is why I track 3 hr futures on everything.

Gold Market Outlook: Rising Momentum Toward ResistanceOverall Market Structure
The gold price (XAUUSD) is moving inside a wide horizontal range:
Resistance zone: around 4,250 – 4,280
Support zone: around 4,160 – 4,120
Price is currently near 4,203, sitting in the middle of the range.
---
✅ Key Features on the Chart
1. Descending trendline break
You can see a downward diagonal trendline that has been broken earlier.
This normally signals that selling pressure has weakened.
2. Ichimoku Cloud
Price is hovering around the cloud:
When price is inside the cloud → market is uncertain
When price pushes above the cloud → bullish momentum increases
Right now it seems price is trying to climb above the cloud.
3. Arrows showing a potential upward move
The chart marks two upside targets:
Target 1: ~4,229
Target 2: ~4,250
These align with:
Minor resistance
Major resistance (range top)
---
✅ What the Price Needs for an Up-Move
For gold to move higher:
1. Hold above 4,200–4,205 support
2. Break above 4,220–4,230
3. Momentum toward 4,250 becomes more likely
---
✅ What Could Signal Weakness
If price drops:
Below 4,200, sellers gain control again
A fall back to 4,160 becomes possible (bottom of the big range)
---
⭐ Summary
The chart suggests possible bullish momentum forming.
But major resistance sits near 4,250–4,280, which has rejected price before.
The market is still range-bound, not in a strong trend.

XAUUSD Long: The 4,160 Support Holds – Path to 4,260 is OpenHello, traders! The price action for XAUUSD is currently developing within a well-defined ascending trend structure, supported by a rising major Trend Line from the lows. The market previously showed multiple rejections from the Triangle Supply Line, each marked by clear breakout attempts followed by corrective pullbacks. These reactions formed a sequence of higher lows, confirming that buyers remain in control of the broader structure.
Currently, after the last strong impulsive move upward, Gold reacted from the Supply Zone around 4,260, forming a short-term corrective phase while respecting the rising Triangle Demand Line near the 4,160 demand level. Price is now compressing between the descending supply line and the ascending demand line, creating a tightening triangle structure that signals growing pressure for a directional expansion. This compression reflects a balance between profit-taking sellers at resistance and aggressive dip-buyers along demand.
My scenario for the further development is bullish continuation as long as price holds above the Triangle Demand Line and the 4,160 demand zone. I expect a rebound from current levels, followed by a renewed attack on the 4,260 Supply Zone. If buyers manage to produce a clean breakout above this resistance, Gold may accelerate toward higher targets with strong momentum continuation. However, if the supply zone holds and price breaks below the demand line, a deeper corrective pullback toward the main rising Trend Line could develop. For now, the structure favors buyers, with the key focus on a breakout attempt toward 4,260. Manage your risk!

THE KOG REPORT - UpdateEnd of day update from us here at KOG:
Not a bad week at all with price bouncing the low to give us the long into the region of interest where we wanted to short. We got the short into the defence box which is where we faced a bit of ranging and accumulation but the level held well and we're on our way.
Now, we have support 4240 as the key level for the close while 4265-70 is the level to watch for the break. Defence above, we'll be happy to achieve that for the week.
Wishing you all a great weekend and we'll see you on Sunday for the KOG Report and our view for the week ahead. Please take some time to hit the boost button on our ideas.
As always, trade safe.
KOG

XAU/USD | Gold Update : Watching 4192 and 4240 Closely!By analyzing the #Gold chart on the 4 hour timeframe, we can see that price followed the previous analysis perfectly and hit the first target at $4240, even pushing slightly higher to $4242. After that move, gold pulled back and corrected all the way down to $4175. Right now gold is trading around $4192, which is basically a neutral zone with no clear direction yet.
We need to see whether price can climb back above $4240 again or not. One important point: if gold fails to hold above $4192 within the next hour, we might see another heavier drop. Keep an eye on the reaction to these key levels. I will update this analysis again soon.
Please support me with your likes and comments to motivate me to share more analysis with you and share your opinion about the possible trend of this chart with me !
Best Regards , Arman Shaban

Gold 1H – Will 4242 Displace or 4170 Unlock the Next Leg?🟡 XAUUSD – Intraday Smart Money Plan | by Ryan_TitanTrader (04/12)
📈 Market Context
Gold squeezes into engineered liquidity as Donald Trump signals policy authorization for ultra-compact car production in the U.S., adding risk-on volatility to USD narratives. Markets may front-run sentiment shifts into commodities like gold. Expect fast bilateral sweeps before institutions reveal intent.
On H1, structure toggles between premium supply at 4242–4244 and discount demand at 4170–4168. The next directional leg requires MSS + BOS + displacement confluence.
🔎 Technical Framework – Smart Money Structure (1H)
Current Phase = liquidity-rich compression at H1 extremes
Liquidity Zones & Key Triggers
• 🔴 SELL GOLD 4242 – 4244 | SL 4252
• 🟢 BUY GOLD 4170 – 4168 | SL 4160
Bias invalidation only via structure break + displacement validation.
Expected Sequence = Sweep → MSS/CHoCH → BOS → Displacement → Retest → Expansion
🎯 Execution Rules (unchanged methodology, matching your zones)
🔴 SELL GOLD 4242 – 4244 | SL 4252
Rules:
✔ Zone tap 4243 → bearish MSS/CHoCH (M5–M15)
✔ Clean bearish BOS down + candle displacement
✔ Entry on FVG fill or OB retest after displacement
Targets:
1. 4200 – 4190
2. 4182 – 4176
3. 4170 – 4168
🟢 BUY GOLD 4170 – 4168 | SL 4160
Rules:
✔ Sweep under 4169 → bullish MSS/CHoCH + BOS up
✔ Displacement candle away from discount
✔ Wick rejection into FVG fill / OB retest confirm
Targets:
1. 4186
2. 4210
3. 4242+
⚠️ Risk Notes
• Both sweeps = traps until BOS + Displacement confirms intent
• No averaging inside compression
• SL = structural invalidation only
• Reduce size during headline-driven spikes
📍 Summary
Two institutional paths today:
• 4243 sweep → bearish MSS/BOS → retest → delivery into 4170
or
• 4169 sweep → bullish MSS/BOS → retest → expansion into 4242+
Trade the structure. Let price narrate the intent. Patience = edge. 🚀
📌 Follow @Ryan_TitanTrader for daily Smart Money breakdowns.

VIX Levels I Watch for Market TimingA simple, repeatable framework I use:
• When the VIX spikes into the 28–32 zone, I start adding equities.
• When the VIX sinks back into the 12–14 zone, I trim or take profit.
This range has been reliable all year. Not financial advice—just sharing what’s been working for me.

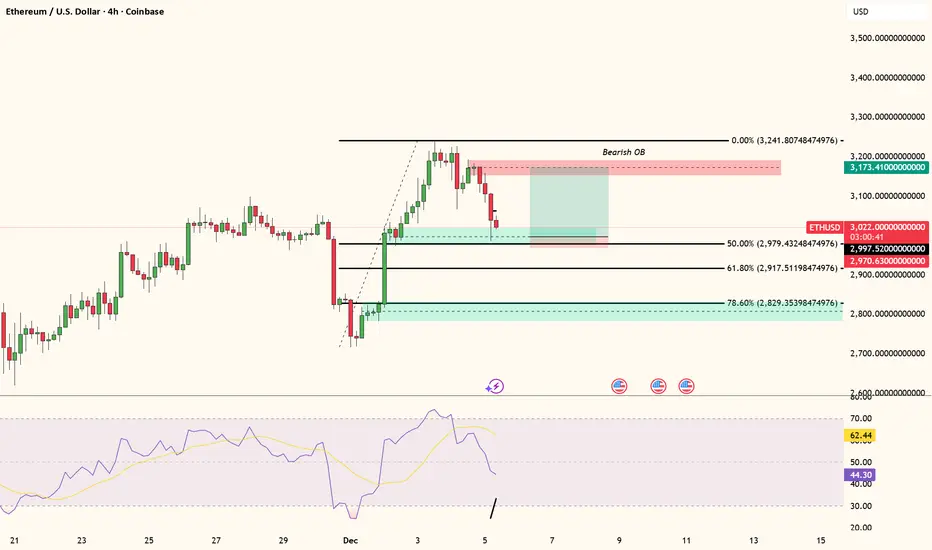
Long on ethEth had a rally over the week and is now currently at a healthy pull back at around discount level of price from the recent swing low to a swing high on the 4HR.
It's now hovering around a demand zone that is being tested as of now. If price creates a bullish structure on the lower time frames (15MIN, 5MIN) in the demand zone, we can see a nice rally up to the bearish OB depicted on the chart or a new high that will confirm the overall structure leading into a uptrend.
SOLUSDT – Gains Limited, Price Faces a Key Decision ZoneHello everyone, SOL experienced an impressive upward move over the past weekend, but the current momentum has noticeably weakened as the price hits the EMA 89 (blue), an area that has previously created strong selling pressure last month.
After bouncing around the 145 USD mark, SOL retraced to test both EMA 34 (red) and EMA 89, forming a critical convergence zone to determine the next direction. Recent candles show long upper wicks accompanied by decreasing volume, indicating that buyers are losing strength compared to the previous breakout while profit-taking pressure is rising. The market structure has yet to confirm an uptrend, as SOL has only slightly broken local highs without forming a clear higher-high, explaining why the price was rejected at EMA 89.
From a macro and capital flow perspective, over the past 48 hours, the Solana ecosystem has shown a positive recovery, with several DeFi projects and memecoins rallying. However, capital inflows into altcoins have paused as investors await updates from the Fed and US economic data. Bitcoin is currently moving sideways, meaning the primary market momentum supporting altcoins, including SOL, is insufficient to drive a breakout. Therefore, even positive news is not yet strong enough to establish a new trend.
Wishing everyone successful trading!
