Quantitative Analysis of Algorithmic Candlestick Pattern● Quantitative Analysis of Algorithmic Candlestick Pattern Recognition: Code Logic, Statistical Reliability, and Market Psychology
● Introduction: The Intersection of Algorithmic Logic and Behavioral Finance
The digitization of financial markets has catalyzed a paradigm shift in technical analysis, moving from subjective visual interpretation to rigorous, rule-based algorithmic detection. Candlestick charting, a methodology with roots in 18th-century Japanese rice trading, serves as the foundational language for reading price action. However, in the context of modern high-frequency and systematic trading, the "art" of reading candles must be translated into the "science" of boolean logic, threshold ratios, and trend filters.
This report provides an exhaustive analysis of the 40+ candlestick patterns identified within the proprietary "Smart Candlestick Pattern Filter" indicator. By dissecting the source code, we isolate the specific mathematical conditions—such as the DOJI_RATIO of 0.05 or the SHADOW_MULT of 2.0—that determine pattern validity. Furthermore, we juxtapose these rigid algorithmic definitions against the theoretical underpinnings of market psychology and the statistical reliability data compiled by researchers such as Thomas Bulkowski.
The patterns are categorized by their signal strength (1 through 5), a hierarchical system inherent to the algorithm that attempts to filter market noise from actionable signal. This classification provides a structured framework for understanding how single-bar indecision evolves into complex, multi-bar reversal or continuation structures. The analysis reveals critical insights into the discrepancies between traditional textbook definitions and their code-based implementations, particularly regarding trend context and gap requirements, offering a nuanced perspective for professional traders deploying automated recognition systems.
• Methodological Framework of the Indicator
The analyzed script operates on a sophisticated logic engine that calculates candle metrics relative to trend context. Before individual patterns are detected, the system establishes a baseline for trend direction using a Simple Moving Average (SMA), defined by the input trendPeriod (default 20). This allows the algorithm to filter patterns contextually—for instance, a "Hanging Man" is only valid if detected within a mathematically defined uptrend ( trendUpCond ), while an "Inverted Hammer" requires a downtrend ( trendDownCond ).
This pre-processing step is critical. Traditional visual analysis often fails because traders identify reversal patterns in sideways markets. By enforcing boolean constraints such as close > trendSMA the algorithm attempts to solve the problem of false positives inherent in manual charting. Furthermore, the script utilizes dynamic variables for body size body_size = math.abs(c - o) and shadows ( upper_shadow , lower_shadow ), standardizing pattern recognition across varying asset classes and volatility regimes.
● Strength 1: The Architecture of Indecision and Volatility Compression
The first tier of patterns identified by the algorithm represents market indecision. While assigned the lowest strength rating, these patterns are statistically significant as precursors to volatility expansion. They signify a state of equilibrium where supply meets demand, often marking the calm before a breakout.
• The Doji: The Keystone of Equilibrium
The Doji is the most fundamental single-candle pattern, representing a total stalemate between bulls and bears.
Algorithmic Definition: The code defines a Doji not by a perfect equality of open and close, but by a specific ratio. The isDoji boolean variable returns true if the body_ratio (body size divided by high-low range) is less than or equal to DOJI_RATIO , which is set to 0.05. This quantitative threshold allows for "near-doji" candles to be recognized, accommodating the noise of modern electronic markets where exact price matches are rare due to micro-volatility.
Market Psychology: The formation of a Doji indicates that the conviction driving the prior trend has evaporated. If appearing in an uptrend, it suggests that buyers are no longer willing to bid prices higher, and sellers have found a price level they deem fair. It is a sign of hesitation. The market opens, explores a range, and closes virtually unchanged, signaling that the net result of the trading session was zero directional progress. This "tug-of-war" psychology is crucial; it does not guarantee a reversal but screams that the current trend is vulnerable.
• The Dragonfly Doji: Bullish Rejection
Algorithmic Definition: The Dragonfly Doji is a specialized Doji detected when the open and close occur at the session's high. The script's logic ( isDragonflyDoji ) is rigorous:
It must first satisfy the isDoji condition.
The upper shadow must be negligible, defined as
(h - c) <= ohlc_range * EDGE_RATIO
and
(h - o) <= ohlc_range * EDGE_RATIO
(where EDGE_RATIO is 0.1).
The total range must be substantial, specifically greater than three times the body size ohlc_range > body_size * 3
Psychology and Reliability: Visually appearing as a "T," the Dragonfly indicates that sellers dominated the early session, driving prices to a low. However, by the close, buyers resurged to push the price back to the opening high. This rejection of the lower prices is significantly bullish, especially at support levels. Bulkowski's research suggests that the Dragonfly Doji performs best as a reversal signal in bear markets, acting as a setup for a bullish breakout. The long lower shadow represents a "check" of liquidity at lower levels, which was found lacking, forcing price back up.
• The Gravestone Doji: Bearish Exhaustion
Algorithmic Definition: The inverse of the Dragonfly, the Gravestone Doji forms when the open and close are at the session low. The code checks isGravestoneDoji by ensuring the lower shadow is within the EDGE_RATIO (bottom 10% of the range) and the total range is significant.
Psychology and Reliability: Resembling an inverted "T," this pattern signifies a failed rally. Bulls attempted to drive the price up but were met with overwhelming supply, forcing the price back to the open by the close. It serves as a visual testament to the graves of the bulls who died defending the highs. In an uptrend, this is a distinct warning of overhead resistance and buyer exhaustion.
• The Long-Legged Doji: High Volatility Indecision
Algorithmic Definition: The isLongLeggedDoji pattern is identified when a Doji has massive shadows in both directions. The code requires both the upper and lower shadows to be greater than the body size multiplied by SHADOW_MULT (2.0).
Psychology: Unlike the standard Doji, which might indicate a quiet market, the Long-Legged Doji (or "Rickshaw Man") indicates violent indecision. The market traded significantly higher and significantly lower, yet closed unchanged. This reflects a market searching for value and finding none at the extremes. It is often a precursor to a major volatility breakout as the compression of the close belies the intraday chaos.
• Spinning Tops: The Pause
Spinning tops are defined by small bodies that are slightly larger than a Doji but still indicative of indecision.
Bullish Spinning Top ( isSpinTopBull ): A green candle where the body_ratio is less than SPIN_TOP_RATIO (0.4), and shadows are present.
Bearish Spinning Top ( isSpinTopBear ): A red candle with the same ratio constraints.
Algorithmic Note: The code ensures the shadows are prominent by checking (h - c) > body_size (upper shadow > body) and (o - l) > body_size (lower shadow > body)
Psychology: Spinning tops represent a "loss of steam." In a strong trend, the appearance of a spinning top suggests that the dominant group (bulls or bears) is losing control, and the opposing force is gaining ground. While not immediate reversal signals, they are critical components of larger patterns like Morning or Evening Stars. Bulkowski notes that spinning tops have a reversal success rate of approximately 48% when viewed in isolation, reinforcing the algorithm's decision to categorize them as low-strength indecision markers rather than actionable signals.
● Strength 2: Weak Reversal and Continuation Signals
Strength 2 patterns introduce directional bias but lack the conviction of multi-candle confirmations. They are often "setup" candles that require a subsequent trigger.
• The Hammer and Hanging Man: Context is King
These patterns share an identical shape—small bodies near the top of the range with long lower shadows—but their implications are diametrically opposed based on the prior trend.
The Hanging Man ( isHangingMan )
Algorithmic Validation: The code enforces strict geometry:
Shadows: lower_shadow >= body_size * SHADOW_MULT (2.0) and upper_shadow <= ohlc_range * EDGE_RATIO
Context: It must occur in an uptrend ( trendUpCond is true).
Position: The high must be greater than the previous high h > h1
Psychology: The Hanging Man appears at the peak of an uptrend. The long lower shadow indicates that for a portion of the session, sellers were able to drive the price significantly lower. Although buyers recovered the price by the close, the sell-off is a warning that bullish control is becoming fragile. The "hanging" nature suggests bulls are left dangling with positions at highs. Reliability statistics suggest a 59% accuracy for bullish continuation in some datasets, which is counter-intuitive and highlights why this is a Strength 2 pattern requiring confirmation (a lower close the next day).
The Inverted Hammer ( isInvHammer )
Algorithmic Validation: The mirror of the Hanging Man, validated by a long upper shadow (>= 2x body) and minimal lower shadow. Must occur in a downtrend ( trendDownCond ).
Psychology: Appearing at a bottom, the Inverted Hammer suggests that buyers attempted a rally (long upper shadow) but failed to hold it. However, the mere presence of buying pressure in a downtrend signals that sellers are losing their grip. It is a "testing of the waters" by bulls. Bulkowski estimates a 60% success rate for reversals when confirmed.
• Belt Hold Lines: The Yorikiri
Bullish Belt Hold ( isBullishBelt ): A candle that opens at its low (no lower shadow) and closes near its high, occurring in a downtrend. Code checks: math.abs(l - o) <= TOLERANCE * c
Bearish Belt Hold ( isBearishBelt ): A candle that opens at its high (no upper shadow) and closes near its low in an uptrend.
Psychology: Derived from the sumo term "Yorikiri" (pushing out), the Belt Hold signifies unidirectional dominance from the opening bell. A Bullish Belt Hold indicates that sellers were exhausted at the open, and buyers immediately took control, never allowing the price to dip. This abrupt shift in sentiment acts as a localized support level. Statistical analysis suggests a 71% success rate for bullish reversals, though the pattern is prone to failure in highly volatile markets without volume confirmation.
• The Neckline Continuation Series: On-Neck, In-Neck, and Thrusting
This trio of bearish continuation patterns is frequently confused. They all feature a bearish candle followed by a smaller bullish candle, distinguished solely by the depth of the bullish candle's close into the previous bearish body.
On-Neck ( isOnNeck ): The most bearish of the three. The second candle opens lower and rallies, but closes at or near the previous candle's low math.abs(c - l1) <= TOLERANCE * c It fails to enter the previous body. The buyers' attempt to rally is pathetic; they cannot even push the price back into the previous day's trading range.
In-Neck ( isInNeck ): The second candle closes slightly higher than the On-Neck, penetrating the previous body but staying within the bottom 10% of the range c <= c1 - (c1 - o1) * 0.1 Similar to On-Neck, but with slightly more buying pressure.
Thrusting ( isThrusting ): The bullish candle thrusts deeper into the bearish body but fails to close above the midpoint c < c1_midpoint . This is the strongest of the weak patterns but still a continuation signal. The failure to cross the equilibrium point (midpoint) of the previous sell-off implies that the bears still control the dominant trend.
● Strength 3: Moderate Reversal and Confirmation Patterns
Strength 3 patterns involve interaction between two or more candles, creating a "setup" and "trigger" dynamic that enhances reliability.
• The Harami: The Insider
Algorithmic Validation:
Bearish Harami ( isBearHarami ): Preceded by a bullish candle ( isBullish_1 ), the current bearish candle's body is completely engulfed by the previous body .
o <= c1 and o1 <= c
.
Bullish Harami ( isBullHarami ): A bearish candle followed by a smaller bullish candle inside its body.
The code enforces that body_size < body_size_1 .
Psychology: "Harami" means "pregnant" in Japanese. The large first candle is the mother, the small second candle is the baby. This pattern represents a sudden contraction in volatility. After a strong trend, the market stalls. In a downtrend (Bullish Harami), the small second candle indicates that selling pressure has dried up. While not a forceful reversal like an Engulfing pattern, it signals that the trend has hit a wall. Bulkowski rates the Bullish Harami with a 54% reversal success rate, suggesting it is better used as a "take profit" signal than an entry signal.
• Penetration Patterns: Piercing Line and Dark Cloud Cover
These patterns are stronger than Haramis because they involve a test and rejection of price extremes.
Piercing Line ( isPiercing ):
Gap: The second (bullish) candle must open below the previous low ( o < l1 ).
Penetration: It must rally to close above the midpoint of the previous bearish body c > c1 + body_size_1 * 0.5
Psychology: This is a panic-induced reversal. The gap down at the open signals capitulation by bulls. However, "smart money" steps in to buy the deep discount, driving prices up aggressively. The close above the midpoint is crucial—it signifies that the buyers have erased more than 50% of the previous day's losses.
Dark Cloud Cover ( isDarkCloud ):
Gap: Opens above the previous high/close.
Penetration: Closes below the midpoint of the previous bullish candle c < c1_midpoint
Psychology: A gap-up opening (greed) is met with heavy institutional selling. The failure to hold the highs and the subsequent collapse below the midpoint signals a "cloud" forming over the uptrend.
• Tweezer Tops and Bottoms
Algorithmic Validation: The code identifies Tweezers by matching extremes on adjacent candles.
Tweezer Bottom ( isTweezerBottom ): math.abs(l - l1) <= TOLERANCE * c
Tweezer Top ( isTweezerTop ): math.abs(h - h1) <= TOLERANCE * c
Psychology: Tweezers represent a "double tap" rejection of a price level. The market tested a specific low (or high) twice and failed to break it both times. This reinforcement of support/resistance suggests that the barrier is solid. In technical terms, it is a micro double-bottom or double-top forming on a lower timeframe.
• Matching Low and Matching High
Algorithmic Validation:
Matching Low ( isMatchingLow ): Two bearish candles in a downtrend with identical closing prices math.abs(c - c1) <= TOLERANCE * c
Matching High ( isMatchingHigh ): Two bullish candles in an uptrend with identical closes.
Psychology: The Matching Low is a unique and subtle bullish reversal signal. The market sells off on day one. On day two, it opens higher, attempts to rally, fails, and sells off again, but—crucially—closes at the exact same level as day one. The failure to make a new closing low despite the selling pressure indicates that support is forming. It differs from the "On-Neck" pattern because the second candle here is bearish, yet the implication is bullish reversal due to the support validation at the close. Bulkowski notes a 61% accuracy for this pattern.
• Separating Lines and Counterattack Lines
Separating Lines ( isSeparatingLinesBull/Bear ): A continuation pattern where two candles of opposite colors share the same opening price math.abs(o - o1) <= TOLERANCE_2 In an uptrend, a red candle forms. The next day, price opens at the same level as the red candle's open (erasing the red candle's impact immediately) and rallies. The prices "separate" in opposite directions from a common origin. It signals that the correction was a one-day fluke and the trend is resuming.
Counterattack Lines ( isCounterattackBull/Bear ): A reversal pattern where two candles of opposite colors share the same closing price math.abs(c - c1) <= TOLERANCE_2 . Also known as "Meeting Lines." The market gaps in the direction of the trend but reverses to close unchanged from the prior day. The gap has been neutralized, indicating momentum exhaustion.
● Strength 4: Strong Reversal and Momentum Patterns
Patterns at Strength 4 typically involve confirmation candles or massive momentum shifts, significantly increasing their statistical reliability.
• Engulfing Patterns: The Outside Bar
Algorithmic Validation:
Basic Logic: The current body completely overlaps the previous body c >= o1 and c1 <= o for bullish).
Smart Filter: The algorithm includes a loop for i = 1 to maxCheck to calculate bullEngulfCount . If the engulfing candle is large enough to engulf the range of multiple previous candles, its strength is upgraded to 5. This dynamic sizing is a significant improvement over standard definitions.
Psychology: An Engulfing pattern represents a total eclipse of the previous market sentiment. A Bullish Engulfing acts as a key reversal signal with a 63% success rate.
• Morning and Evening Stars: The Three-Act Play
Algorithmic Validation:
Morning Star: Long Bearish Candle -> Gap Down Small Candle -> Bullish Candle closing above midpoint of Candle 1.
Evening Star: Long Bullish Candle -> Gap Up Small Candle -> Bearish Candle closing below midpoint of Candle 1.
Psychology: These patterns visually depict a transfer of power over three periods: Dominance (Long Body), Equilibrium (Star/Doji), and Reversal (Third Candle). The Evening Star has a documented 72% accuracy rate, making it one of the most reliable top reversal patterns.
• Three Outside/Inside Up/Down: Confirmed Patterns
Algorithmic Validation:
Three Inside Up: A Bullish Harami followed by a third candle that closes higher than the Harami's top.
Three Outside Up: A Bullish Engulfing followed by a third candle that closes higher than the Engulfing candle's close.
Psychology: These are "confirmed" versions of the 2-candle patterns. The third candle provides the proof that the reversal signaled by the Harami or Engulfing was valid. The Three Outside Up is generally more reliable (approx. 70-75% success) than the Three Inside Up because the base pattern (Engulfing) is stronger than the Harami.
• Abandoned Baby: The Rare Island
Algorithmic Validation: A variation of the Morning/Evening Star where the middle "star" is a Doji that is completely separated by gaps from both the preceding and succeeding candles. The code checks h1 < low (gap down) and h1 < l (gap up) relative to the Doji.
Psychology: This is a rare and powerful "Island Reversal." The Doji is left "abandoned" in isolation. It represents a total dislocation of price. The gaps indicate extreme emotional shifts—panic selling to create the island, followed by panic buying to leave it. With a 70% accuracy rate, it is a high-conviction signal.
• Marubozu: Momentum Unleashed
Defined by a body_ratio >= MARUBOZU_RATIO (0.9) A candle with virtually no shadows. A Bullish Marubozu opens at the low and closes at the high. Buyers controlled every tick of the session. There was no hesitation at the open and no profit-taking at the close. It signals maximum conviction and often initiates or confirms a breakout.
● Strength 5: Very Strong Patterns and Anomalies
These patterns represent the highest tier of algorithmic confidence. They are rare, structurally complex, or represent violent market shocks.
• Three White Soldiers and Three Black Crows
Algorithmic Validation:
Three White Soldiers: Three consecutive bullish candles. The code requires each to open within the previous body o > o1, o < c1 and close higher (c > c1) This "stairstep" logic ensures a steady trend rather than a gap-driven spike.
Three Black Crows: Three consecutive bearish candles with the same overlapping logic.
Psychology: This pattern represents a sustained, methodical shift in capital flow. Three Black Crows indicates a collapse in buyer confidence; each day opens slightly higher (attempting to stabilize) but is crushed to a new low by the close. Reliability is exceptionally high, around 78-83% for reversals.
• The Kicker Pattern: The Shock Event
Algorithmic Validation: The Kicker is unique because it ignores the prior trend context in many interpretations, focusing on the immediate shock.
Bullish Kicker: A bearish candle followed by a bullish candle that opens at or above the previous open o >= o1
Bearish Kicker: A bullish candle followed by a bearish candle that opens at or below the previous open.
Psychology: The Kicker represents a violent repricing, usually driven by overnight news. The market gaps up above the previous day's open (erasing the entire previous bearish session instantly) and rallies. Short sellers are trapped with massive immediate losses, forcing a short squeeze. It is considered one of the most powerful reversal signals (Strength 5).
• The Three Line Strike: Continuation or Reversal?
Algorithmic Validation:
Bearish Three Line Strike: Three bearish candles (trend) followed by a massive bullish candle that engulfs all three previous candles c > o3
Bullish Three Line Strike: Three bullish candles followed by a massive bearish candle engulfing them.
Analysis of Conflict: Here lies a critical divergence between traditional theory and modern statistical analysis. The code logic labels this as a "Continuation" pattern (Strength 5). Traditional theory suggests the "strike" is merely deep profit-taking. However, Thomas Bulkowski's extensive backtesting reveals that the Bearish Three Line Strike actually functions as a Bullish Reversal 84% of the time.
Trader Implication: While the code flags this as isThreeLineStrikeBear , traders should treat the pattern (big green candle after three reds) as a high-probability Buy Signal (Reversal).
• Rising and Falling Three Methods
Algorithmic Validation: A 5-candle continuation pattern.
Rising: Long Bullish Candle -> Three small bearish candles holding within the first body -> Long Bullish Candle closing above the first. The code rigorously checks that the inner candles h3, l3, etc. do not breach the extremes of the first candle.
Psychology: This is a "Bull/Bear Flag" on a candlestick chart. The market explodes up (Candle 1), then consolidates on profit-taking. The fact that bears cannot push the price below the low of Candle 1 despite three days of trying proves selling pressure is weak. Candle 5 confirms the resumption. It is a highly reliable trend continuation signal (74-79% accuracy).
• Tasuki Gaps and Gap Three Methods
Upside Tasuki Gap: Bullish Candle -> Gap Up Bullish Candle -> Bearish Candle that opens inside the second body and closes inside the gap but does not close the gap completely c > h2
Psychology: The pattern tests the validity of a gap. In an uptrend, the market gaps up (strength). Profit-taking creates a red candle (Candle 3). Crucially, this red candle fails to "fill the gap." If the gap remains open, it is confirmed as support.
• Breakaway Patterns
Algorithmic Validation: A rare 5-candle reversal pattern. Example: Bearish Breakaway: Uptrend -> Long Bullish Candle -> Gap Up -> Three small candles continuing up but losing momentum -> Bearish candle closing inside the gap between Candle 1 and 2.
Psychology: This pattern captures the "exhaustion" phase of a trend. The gap accelerates the trend into an overbought state (climax). The subsequent small candles show that while price is drifting higher, momentum is dying (divergence). The final candle confirms the reversal by closing the initial gap.
● Comparative Analysis: Reliability and Performance
Using data from Thomas Bulkowski's Encyclopedia of Candlestick Charts, we can rank the reliability of the patterns detected by the algorithm. This helps traders prioritize which "Strength 5" signals are truly superior.
Three Line Strike (Bearish) - Bullish Reversal
Strength: 5 (Labeled Continuation) | Success Rate: 84%
Note: Top performer. Code labels as continuation; stats say reversal.
Three Black Crows - Bearish Reversal
Strength: 5 | Success Rate: 78%
Note: Highly reliable, especially in high volatility.
Evening Star - Bearish Reversal
Strength: 4 | Success Rate: 72%
Note: The most reliable 3-candle top reversal.
Abandoned Baby - Bullish Reversal
Strength: 4 | Success Rate: 70%
Note: Rare but exceptionally accurate due to gap structure.
Two Black Gapping - Bearish Continuation
Strength: 5 (Tasuki Variant) | Success Rate: 68%
Note: Strong continuation signal.
Inverted Hammer - Bullish Reversal
Strength: 2 | Success Rate: 65%
Note: Surprisingly high reliability for a single candle (needs confirmation).
Bearish Engulfing - Bearish Reversal
Strength: 2-5 | Success Rate: 79%
Note: Performs better than Bullish Engulfing (63%).
Rising Three Methods - Bullish Continuation
Strength: 5 | Success Rate: 74%
Note: Reliable flag pattern analog.
● Conclusion
The "Smart Candlestick Pattern Filter" script provides a robust, mathematically rigorous framework for identifying market sentiment. By establishing strict ratios for Dojis (0.05), enforcing trend context ( trendPeriod=20 ), and distinguishing between nuanced patterns like On-Neck vs. In-Neck, it filters out the noise that plagues manual analysis.
For the professional trader, the value lies not just in detection, but in understanding the specific logic constraints:
Context is Enforced: The code prevents "Hanging Man" signals in downtrends, a common amateur mistake.
Size Matters: The dynamic scaling of Engulfing patterns ( bullEngulfCount ) allows the system to weigh the magnitude of a reversal.
The Continuation Trap: Traders must be vigilant with the Three Line Strike. While the code identifies it as a continuation, empirical data suggests it is often a terminal blow-off move leading to a sharp reversal.
Ultimately, this algorithmic tool serves as a high-fidelity scanner. It effectively automates the recognition of complex structures like the Rising Three Methods and Kicker, which are statistically proven to offer an edge, allowing the trader to focus on secondary confirmations such as volume and market structure.
Candlestickpattern

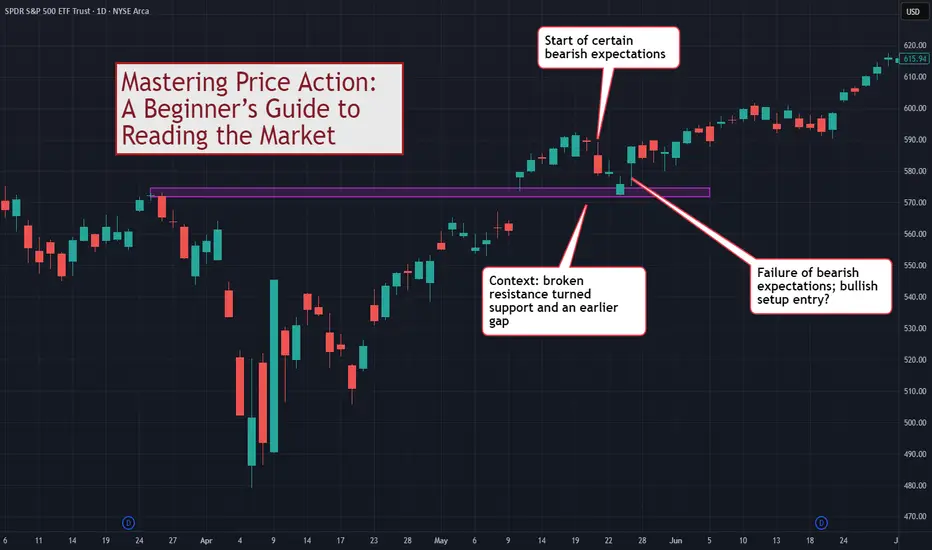
Mastering Price Action: A Beginner’s Guide to Reading the MarketThis discussion goes beyond the basic idea of "memorizing candlestick names." If you want to truly master price action as a tool for reading the market and understanding it as a basis for trading, this guide is for you.
Disclaimer:
The information provided in this tutorial is intended solely for educational purposes. Nothing in this material should be interpreted as financial, investment, or trading advice. Any strategies, methods, tools, or concepts discussed are presented for learning and demonstration only. You are responsible for evaluating your own decisions and risks. Always conduct independent research and consult a qualified professional before making financial or investment choices.
⚠️ WHY MOST TRADERS MISUSE PRICE ACTION
Most traders use price action in a simplistic way:
See a Pin Bar = Buy
See a Doji = Indecision
See an Engulfing = Reversal
The problem with this approach is that you are trading shapes instead of market dynamics.
Price action is not merely pattern recognition. It is a language.
To master price action, you must understand:
Volatility (Range)
Conviction (Body)
Buying/Selling Pressure (Shadows)
Context (Relative performance)
Expectation vs. Reality (Market Inertia)
Price action tells you the story of the battle between buyers and sellers.
📊 1. DECODING THE SINGLE BAR (THE DNA)
Before you can read a chart, you must be able to read a single bar.
Although a single bar is created from Open/High/Low/Close, it gives you critical information beyond that.
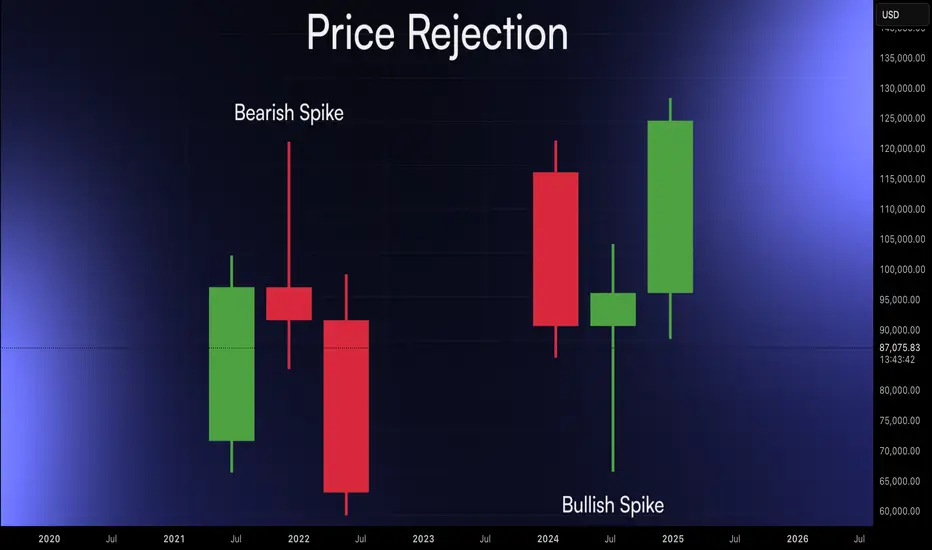
🕯️Range = Volatility
The distance between High and Low.
Wide Range: Active market, high volatility.
Narrow Range: Dead market, low volatility.
This chart shows the low volatility period transitioning to the high volatility prior to a major reversal.
🕯️Body = Conviction
Large Body: The market conquered territory. Strong conviction (Bullish or Bearish).
Small/No Body (Doji): The market is undecided. A battle with no winner.
This chart points out two bullish bars, one with weaker conviction than the other.
🕯️Shadows = Pressure
Upper Shadow: Selling Pressure. The market tried to go higher but was rejected.
Lower Shadow: Buying Pressure. The market tried to go lower but was rejected.
This chart shows how we can observe the shifting of buying/selling pressure by observing the wicks (tails/shadows) of candlesticks.
TIP: For examining shadows, focus on the shadows (wicks) that take up around at least 50% of the bar range.
📊 2. CONTEXT IS KING (TWO-BAR ANALYSIS)
Now, let’s go on to two-bar analysis.
Nothing works in isolation. A "wide" bar is only wide(r) if its range is larger than the previous bar.
The key here is to use the first bar to set the context for the second.
Volatility Check: Is the range expanding (market waking up) or contracting (market resting)?
The "Test": Every bar's High and Low are natural support and resistance levels.
- If Bar 2 breaks Bar 1's Low and closes lower → Bearish Victory .
- If Bar 2 breaks Bar 1's Low but reverses to close higher → Bullish Rejection (False Break) .
This chart focuses on one specific bar and compares it with the previous bar. Our observation produces no conclusion, only more questions.
📊 3. THE EXPECTATION GAME (THREE-BAR ANALYSIS)
This is the secret sauce of price action readers, forming expectations and observing. The market has inertia , for e.g. bullishness should follow bullishness.
This chart extends our earlier two-bar analysis. The third bar is a Doji, confirming uncertainty on the side of the bulls.
The Basic Analytical Framework For Close Price Action Analysis:
Read Bars 1 & 2: Form an expectation. (e.g., "Strong bearish bars, I expect Bar 3 to go down.")
Watch Bar 3: Does it confirm or fail your expectation?
Confirmation: Market moves as expected (Trend continues).
Failure: Market defies expectation (Potential Reversal).
📊 4. PATTERNS ARE JUST LABELS
Stop looking for "Pin Bars" or "Engulfing patterns" by name. Look for the behavior.
Pin Bar: Essentially a bar where the market tested a support/resistance level and was violently rejected (Long Shadow).
Outside Bar: A bar where volatility expanded and totally overwhelmed the previous session.
When you read the story, you don't need the labels.
📊 EXAMPLE TRADING FRAMEWORK
From the above, we can build a simple trading framework based on identifying context, forming expectations, and trading the failure of expectations . This is not the only framework but one of the many possible.
Bullish Setup
Context: Price tests a support level or previous low.
The Trigger: A bar shows a failure of bearish expectation (e.g., tries to go lower but closes high).
Bearish Setup
Context: Price tests a resistance level or previous high.
The Trigger: A bar shows a failure of bullish expectation (e.g., tries to break out but slams back down).
This chart shows a example leading to a potential long setup.
⚠️ COMMON MISTAKES
Trading in a Vacuum: Taking a "Pin Bar" signal without checking if the market is trending or ranging.
Ignoring the Body: A long shadow means nothing if the body shows the other side still has control.
Fixating on Names: Worrying if it's a "Harami" or an "Inside Bar" instead of asking "Who is winning?"
🎯 CONCLUSION
Reading price action is about knowing what the market has done and what it is doing now . It increases your chances of predicting what it will do .
Forget the fancy names.
Focus on the OHLC relationship.
Trade the failure of expectations.
Master this microscopic view, and then combine it with macroscopic market structure for the ultimate edge.
How do you read price action? Do you use patterns or read the flow? Share your approach below!
Candlestick Patterns That Actually MatterTraders often approach candlestick patterns by memorizing long lists instead of understanding the behaviour behind them. Crypto moves aggressively, hunts liquidity, and punishes textbook interpretations unless they occur at meaningful locations. The goal is not pattern collection. The goal is to recognize the few formations that consistently reveal intention when aligned with structure, liquidity, and context.
Engulfing Candles, Displacement and Control
What it shows: a clear shift where one side fully absorbs the other. This is participation, not random volatility.
When it matters: after impulses, at support or resistance, during liquidity sweeps, or when confirming a trend shift.
Why it’s valuable: engulfing candles often provide the first structural evidence that control has changed hands.
Rejection Wicks, Liquidity Taken, Pressure Reverses
What it shows: price tapped a high or low, triggered stops, and immediately met stronger opposing orders. This is how sweeps appear on a single candle.
When it matters: at equal highs/lows, session extremes, failed breakouts, and major swing points.
Why it’s valuable: wicks expose trapped traders and reveal where true supply or demand sits. They are early indicators of shifting intent.
Inside and Outside Bars, Compression and Expansion
Inside Bar: compression, tighter ranges, and reduced volatility ahead of expansion.
Outside Bar: immediate expansion where one side overwhelms both directions.
When they matter: at key levels before breakouts, during corrective legs, at consolidation boundaries, and after liquidity events.
Why they’re valuable: inside bars show preparation; outside bars show decision.
Treat these signals as behavioural information. Their value increases when combined with higher timeframe structure, liquidity mapping, momentum, volume, and session context.
How to Trade Morning Star and Evening Star Candlestick Patterns Learn to identify and trade Morning Star and Evening Star candlestick formations using TradingView’s charting tools in this detailed tutorial from Optimus Futures.
Morning and Evening Stars are powerful reversal patterns that often mark turning points in the market. Recognizing them can help you anticipate when momentum is about to shift—and take advantage of new trading opportunities.
What You’ll Learn:
• How Morning Stars signal bullish reversals at the end of a downtrend
• How Evening Stars indicate bearish reversals after extended uptrends
• The three-candle structure of each pattern and what it means for trader psychology
• Why indecision candles (like dojis) play a critical role in confirming momentum shifts
• Using volume confirmation to validate Morning and Evening Star setups
• The importance of context: spotting these patterns at major support and resistance levels
• Setting effective stop losses at the high/low of the pattern for risk control
• Advanced entry tactic: waiting for retracement after confirmation to optimize risk/reward
This tutorial may help futures traders and technical analysts who want to harness candlestick reversal signals to identify potential market turning points.
The strategies covered could assist you in creating structured setups when strong buying or selling pressure appears at key chart levels.
Learn more about futures trading with TradingView:
optimusfutures.com
Disclaimer:
There is a substantial risk of loss in futures trading. Past performance is not indicative of future results. Please trade only with risk capital. We are not responsible for any third-party links, comments, or content shared on TradingView. Any opinions, links, or messages posted by users on TradingView do not represent our views or recommendations. Please exercise your own judgment and due diligence when engaging with any external content or user commentary.
This video represents the opinion of Optimus Futures and is intended for educational purposes only. Chart interpretations are presented solely to illustrate objective technical concepts and should not be viewed as predictive of future market behavior. In our opinion, charts are analytical tools—not forecasting instruments. Market conditions are constantly evolving, and all trading decisions should be made independently, with careful consideration of individual risk tolerance and financial objective

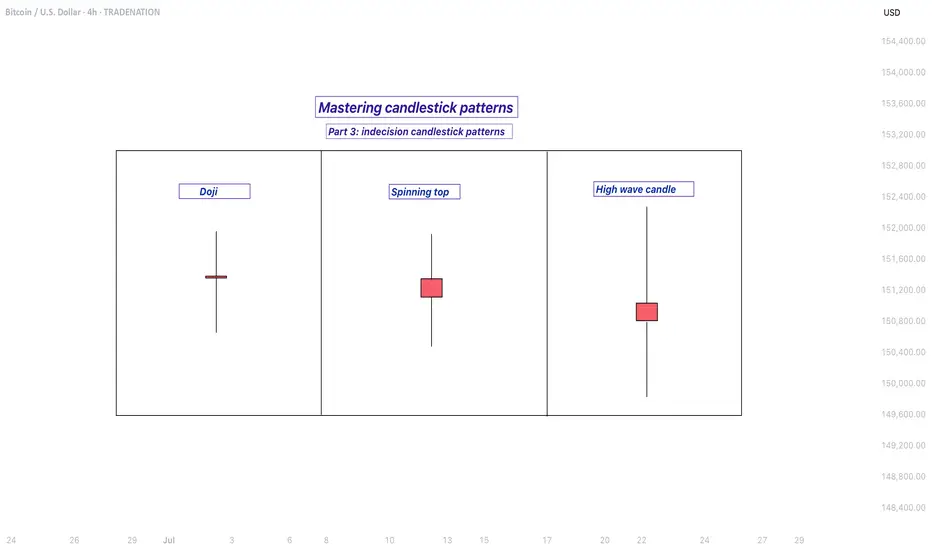
Mastering indecision candlestick patterns - How to use it!In this guide I will explain the indecision candlestick patterns. The next subjects will be discussed:
- What are indecision candlestick patterns?
- What is the doji?
- What is the spinning top?
- What is the high wave candle?
What are indecision candlestick patterns?
Indecision candlestick patterns are formations on a price chart that suggest uncertainty in the market. They appear when neither buyers nor sellers have full control, meaning the price moves up and down during the trading period but closes near where it opened. This creates a candle with a small real body and often long wicks on either side, showing that the market explored both higher and lower prices but ended up not committing strongly in either direction. These patterns are often seen during periods when traders are waiting for more information before making bigger moves.
What is the doji?
One of the most well-known indecision candles is the doji. A doji forms when the opening price and the closing price are almost identical, resulting in a very thin body. The wicks, which show the highest and lowest prices of the period, can be long or short depending on market activity. A doji tells us that buying and selling pressure were almost equal, which can happen during pauses in trends or before major reversals.
What is the spinning top?
Another type is the spinning top. A spinning top also has a small body, but unlike the doji, the open and close are not exactly the same. The wicks on both sides are typically of similar length, indicating that the market moved both up and down significantly before settling close to the starting point. This pattern reflects hesitation and a balanced struggle between bulls and bears.
What is the high wave candle?
The high wave candle is a more dramatic version of indecision. It has a small real body like the other patterns but features very long upper and lower shadows. This means the market swung widely in both directions during the period, but ultimately closed without making strong progress either way. The high wave candle signals strong volatility paired with uncertainty, which can often precede sharp moves once the market chooses a direction.
When you see these types of candles, they are essentially the market saying “I’m not sure yet.” They often appear at turning points or before big news events and can warn that the current trend may be losing strength. However, they are not guarantees of reversal or continuation on their own. Traders usually combine them with other technical signals or chart patterns to confirm whether the market will break out in one direction or the other.
-------------------------
Disclosure: I am part of Trade Nation's Influencer program and receive a monthly fee for using their TradingView charts in my analysis.
Thanks for your support. If you enjoyed this analysis, make sure to follow me so you don't miss the next one. And if you found it helpful, feel free to drop a like 👍 and leave a comment 💬, I’d love to hear your thoughts!
What Is the Evening Star Candlestick Pattern?What Is the Evening Star Candlestick Pattern?
Candlestick patterns offer traders a way to read price action and spot potential changes in momentum. One notable pattern is the evening star, a three-candle formation that signals the start of a possible downtrend. This article breaks down what the evening star looks like, how it works, and how traders typically use it.
What Is the Evening Star Candlestick Pattern?
The evening star is a three-candle pattern that traders watch for after a strong upward move. It’s considered a bearish reversal pattern, signalling that bullish momentum is fading. The setup consists of three candles:
- The first candle is a large bullish candle—it shows a clear upward direction.
- The second is much smaller. This middle candle—the star—reflects hesitation. Buyers and sellers are more balanced, and the market’s pace slows.
- The third candle acts as confirmation. It’s a solid bearish candle that closes deep into the body of the first.
The middle candle also often gaps up from the first, especially in stocks or indices, but gaps aren’t essential. What matters is the sequence: strength, indecision, reversal. The further the final candle closes into the body of the first, the stronger the pattern is considered.
Evening stars can appear on any timeframe, but many traders look for them on the daily chart where the signals tend to be clearer. It’s not a pattern to act on blindly—but in the right context, such as after a sustained bullish trend, it’s a useful sign that buyers might be losing control.
The Psychology Behind the Evening Star
It may be always useful to frame the formations like the evening star candle pattern in the context of market psychology.
Here, the first bullish candle signals buyer confidence. They drive prices higher and the candle closes strongly. The next candle is smaller, suggesting that momentum is slowing. Buyers aren’t pushing as hard, and sellers start to step in.
When the third candle closes strongly bearish, it confirms that sentiment is changing. Sellers are now in control, and previous buying strength fades. This shift often happens at the end of an extended upward movement, where fewer buyers are willing to bid the price up and begin closing positions.
How Traders May Use the Evening Star Candlestick Formation
The evening star may be a useful part of a trader’s toolkit, especially when it lines up with other pieces of analysis.
Opening and Closing a Trade
The evening star pattern candlesticks become more meaningful when they appear around known areas of resistance or previous swing highs. If the market’s been edging closer to a clear level—like a horizontal resistance line, Fibonacci retracement, or trendline—and then an evening star forms, it can add weight to the idea that the rally is weakening. Some traders also watch for patterns forming near round numbers or psychological price points.
If traders notice an evening star pattern occurring at a resistance level, they typically look for confluence using another indicator. The RSI might signal a bearish divergence, the price may be piercing an upper Bollinger Band, or it could also be bouncing from a 200-period EMA. Volume can be another factor—rising volume on the third candle can signal more participation behind the selling.
Once a trader has confidence that a bearish reversal is likely underway, they often use the candles following the third candlestick as an entry trigger. A stop loss might be set above the middle candle’s high, while take-profit targets might be placed at an area where a bullish reversal might occur, like a support level. Some might simply trail a stop to take advantage of the strong downtrend or exit when an indicator/candlestick pattern signals that bearish momentum is fading.
Marking Potential Trend Shifts
Some traders use the evening star to flag potential trend exhaustion. While they may not act on the signal (e.g. they are bullish overall and not willing to take shorts yet), the presence of an evening star can suggest the uptrend is vulnerable. They may prepare to buy a pullback, partially close an existing long position, or start watching for further bearish signals.
Example Trades
In the example above, we see a slight rally in AUD/USD in a broader downtrend (off-screen). Price initially pierces the upper Bollinger Band, with slight rejections visible in the upper wicks. After a brief dip, the market retests highs and finds resistance. At this point, the pattern forms, with confirmation coming from relatively weak candles afterwards. Price then closes through the midline of the Bollinger Bands, providing full confirmation of a bearish reversal.
In this second example, we can see a failed evening star. Here, Amazon (AMZN) gaps up over two consecutive days. That leads the 50-period EMA to slope up and cross above its 200-period counterpart—a clear bullish signal.
In this context, it may be better to ignore the signal. The market continues to move higher in an uptrend with consecutive bullish gaps, confirmed by the EMA crossover, indicating a lower probability the pattern will work successfully. Like any pattern, the evening star is expected to be more reliable when contextual factors align, such as in the AUD/USD example.
Strengths and Limitations of the Evening Star
The evening star has its strengths and limitations. To rely on the evening star in trading, it’s worth being aware of both sides.
Strengths
- Clear visual structure: The three-candle formation is straightforward, especially on higher timeframes.
- Logical: The pattern reflects an evident change in momentum that shifts from buying to selling pressure.
- Useful in a wider toolkit: When combined with other forms of analysis (resistance levels, overbought signals, strong volume), it can help traders pinpoint potential turning points and offer an entry.
Limitations
- Requires confirmation: On its own, the pattern doesn’t confirm a downtrend. It’s a potential signal, but not a guarantee.
- Less reliable in choppy markets: In sideways or low-volume markets, evening stars usually produce false signals.
- Subject to interpretation: Candle size, wicks, and placement can vary, which means not every setup is clean or tradable.
The Bottom Line
The evening star pattern offers traders a structured way to identify potential turning points in the market. Its three-candle formation makes it popular among those seeking greater confirmation than single-candle patterns.
FAQ
What Does an Evening Star Candle Pattern Mean?
It’s a three-candle formation that appears at the end of a solid uptrend. An evening star in trading indicates a potential bearish reversal or a short-term downward movement depending on market conditions and the timeframe used.
Is the Evening Star Bullish or Bearish?
The evening star is considered a bearish pattern that shows buyer exhaustion. A third long bearish candle reflects a change in the market sentiment.
How Do an Evening Star and a Hanging Man Differ?
The evening star is a three-candle pattern showing a gradual change in momentum. The hanging man is a single-candle pattern, with a small body and long lower wick. Both are bearish reversal signals, but the hanging man typically requires greater confirmation.
How Do a Shooting Star and an Evening Star Differ?
The shooting star is a one-candle pattern with a long upper wick and a small body that signals rejection at higher prices. The evening star is a three-candle pattern. Both formations reflect a shift from bullish to bearish sentiment.
This article represents the opinion of the Companies operating under the FXOpen brand only. It is not to be construed as an offer, solicitation, or recommendation with respect to products and services provided by the Companies operating under the FXOpen brand, nor is it to be considered financial advice.
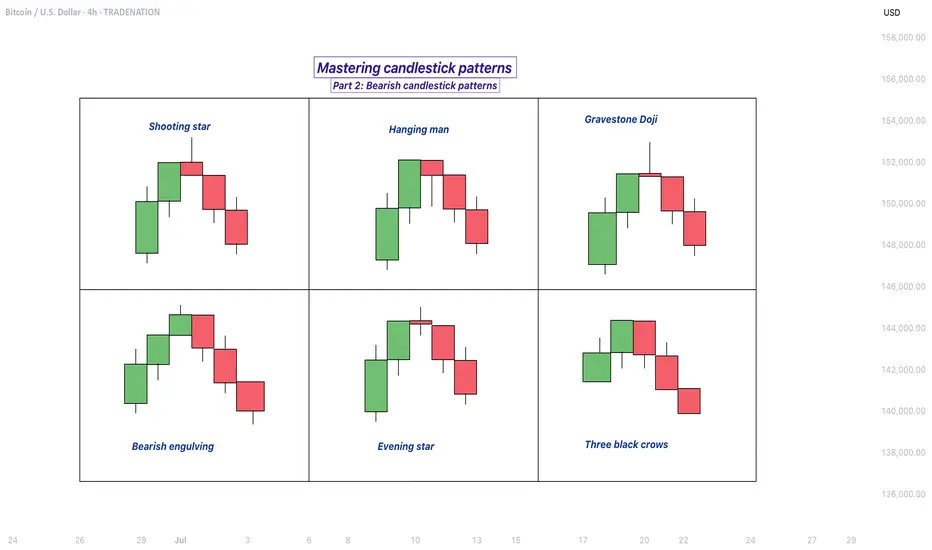
Mastering bearish candlestick patterns - How to use it!Bearish candlestick patterns are a cornerstone of technical analysis, relied upon by traders across financial markets to assess the likelihood of price reversals or continued downward trends. At their core, these patterns are visual representations of shifts in market sentiment, formed by the open, high, low, and close prices over one or several trading sessions. When recognized accurately and interpreted in context, bearish candlestick setups can alert market participants to the fading strength of buyers and the increasing presence of sellers, which often precedes downward price movements. Expanding on this, a comprehensive understanding of each pattern’s nuances, psychological underpinnings, and optimal trading applications can significantly enhance a trader’s analytical toolkit.
What will be discussed?
- What is a shooting star?
- What is a hanging man?
- What is a gravestone dojo?
- What is an evening star?
- What are the three black crows?
- How to trade the bearish candlestick patterns?
Shooting star
The shooting star pattern stands as a prominent candlestick configuration foreshadowing potential bearish reversals after an uptrend. This single-candle pattern is distinguished by a small real body situated near the lower end of the price range, a long upper shadow that is at least twice the length of the body, and little to no lower shadow. The psychological narrative implied by the shooting star is compelling: buyers initially control the session, pushing prices sharply higher, but by the close, sellers have overwhelmed this optimism, pulling the price back down to near or below the opening point. This abrupt shift in control suggests that the bullish momentum is waning, priming the market for a price correction or reversal.
Hanging man
The hanging man, while visually similar to the hammer pattern of bullish reversals, is distinctly bearish because of its position at the top of an established uptrend. This single-candle pattern features a small body at the upper part of the trading range and a markedly long lower shadow, again with minimal or absent upper shadow. During the session, substantial selling pressure drives prices down, accounting for the extended lower shadow, yet buyers temporarily regain some control, recovering much of the loss by the close. Despite this late-session recovery, the appearance of the hanging man warns traders that sellers are growing more aggressive – especially if the next candle confirms the weakness with a lower close.
Gravestone doji
A classic and somewhat ominous formation, the gravestone doji is a specialized form of doji candlestick that carries even greater weight when it appears after a rising market. Here, the open, close, and low are all clustered near the session’s low, forming a long upper shadow with no lower shadow. This structure vividly illustrates a dramatic shift in sentiment: buyers propel prices higher during the session, only to be met by intense selling which pushes prices back to the opening level by the close. This failed rally, marked by the upper wick, reflects the exhaustion of buying interest and the potential onset of bearish dominance.
Bearish engulfing
Turning to multi-candle setups, the bearish engulfing pattern is a powerful, two-bar reversal pattern. The initial candle is bullish and typically a continuation of the prevailing uptrend, but the second candle is bearish and must open above and close below the body of the first candle, “engulfing” it completely. The transition from a relatively small upward move to a much larger downward move highlights a rapid escalation in sell-side enthusiasm. Importantly, the larger the second candle and the greater the volume accompanying it, the more reliable the signal.
Evening star
The evening star expands the analysis further into a three-candlestick formation, representing a storyline of shifting market dynamics. The pattern commences with a long bullish candle, followed by an indecisive small candle (the star) that gaps above the previous close, and concludes with a large bearish candle that closes deep into the first candle’s body. The evening star is especially meaningful because it narrates a transition from bullish exhaustion to bearish control over three sessions, making it a robust signal of a pending trend reversal. The reliability of the evening star increases if the bearish candle is accompanied by high volume, confirming a surge in selling pressure.
Three black crows
Among the most striking bearish signals is the three black crows pattern. It comprises three consecutive large bearish candles, each opening within the body of the previous candle and closing successively lower. This pattern demonstrates relentless selling over several sessions, erasing prior gains and indicating that bearish sentiment is in full swing. Collectively, the three black crows can shift market psychology significantly when they appear after a lengthy uptrend, especially if accompanied by increased trading volume.
How to trade the bearish candlestick patterns?
Effectively using bearish candlestick patterns in a trading strategy requires more than mere recognition of shapes. The context in which these patterns emerge matters greatly; traders should analyze preceding price action, the scope of the trend, and any converging signals from other technical tools such as momentum oscillators or volume indicators. Confirmation is a best practice, waiting for a subsequent session that continues in the bearish direction can filter out false signals and decrease the chances of whipsaw trades.
In practice, traders may use these patterns to identify short-selling opportunities, define entry and exit points, or adjust stop-loss levels to protect profits as a trend appears to reverse. Risk management is crucial, as no pattern is infallible. Position sizing, stop-loss placement, and ongoing evaluation of the broader market environment all contribute to the prudent use of candlestick analysis. By integrating these patterns into a comprehensive market analysis framework, traders are better positioned to interpret crowd psychology, anticipate significant reversals, and navigate the complexities of price movement with a higher degree of confidence and skill.
-------------------------
Disclosure: I am part of Trade Nation's Influencer program and receive a monthly fee for using their TradingView charts in my analysis.
Thanks for your support. If you enjoyed this analysis, make sure to follow me so you don't miss the next one. And if you found it helpful, feel free to drop a like 👍 and leave a comment 💬, I’d love to hear your thoughts!
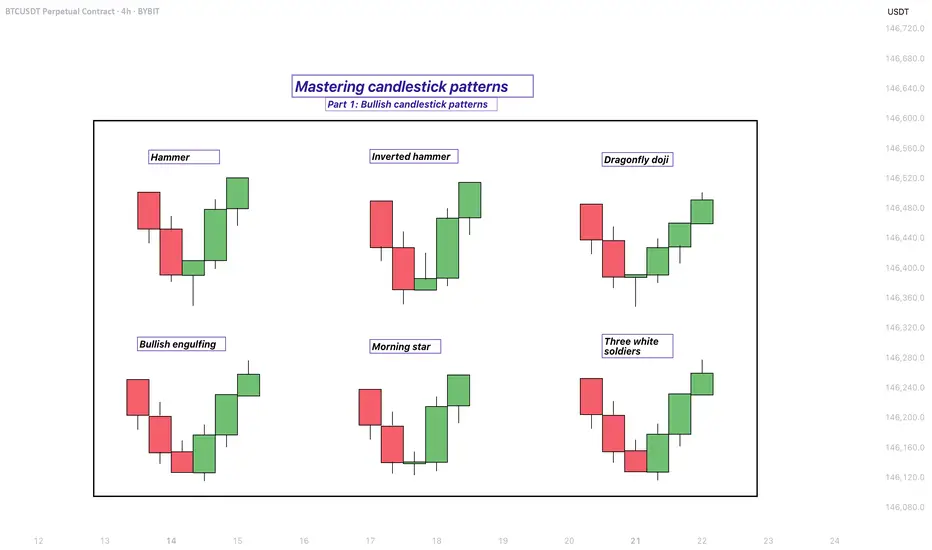
Mastering bullish candlestick patterns - How to use it!In this guide, we will explore some of the most important bullish candlestick patterns used in technical analysis. These patterns are essential tools for traders and investors who want to better understand market sentiment and identify potential reversal points where prices may start moving upward.
What will be explained:
- What are bullish candlestick patterns?
- What is the hammer?
- What is the inverted hammer?
- What is the dragonfly doji?
- What is the bullish engulfing?
- What is the morning star?
- What is the three white soldiers?
- How to use bullish candlestick patterns in trading?
What are bullish candlestick patterns?
Bullish candlestick patterns are specific formations on a candlestick chart that signal a potential reversal from a downtrend to an uptrend. These patterns are used by traders and investors to identify moments when the market sentiment may be shifting from bearish to bullish. Recognizing these patterns can help traders time their entries and make more informed decisions based on price action and market psychology. While no single pattern guarantees success, they can provide valuable clues when combined with other forms of analysis such as support and resistance, trendlines, and volume.
What is the Hammer?
The Hammer is a single-candle bullish reversal pattern that typically appears at the bottom of a downtrend. It has a small real body located at the upper end of the trading range, with a long lower shadow and little to no upper shadow. The long lower wick indicates that sellers drove the price lower during the session, but buyers stepped in strongly and pushed the price back up near the opening level by the close. This shift in momentum suggests that the downtrend could be coming to an end, and a bullish move might follow.
What is the Inverted Hammer?
The Inverted Hammer is another single-candle bullish pattern that also appears after a downtrend. It has a small body near the lower end of the candle, a long upper shadow, and little to no lower shadow. This pattern shows that buyers attempted to push the price higher, but sellers managed to bring it back down before the close. Despite the failure to hold higher levels, the buying pressure indicates a possible reversal in momentum. Traders usually look for confirmation in the next candle, such as a strong bullish candle, before acting on the signal.
What is the Dragonfly Doji?
The Dragonfly Doji is a special type of candlestick that often indicates a potential bullish reversal when it appears at the bottom of a downtrend. It forms when the open, high, and close prices are all roughly the same, and there is a long lower shadow. This pattern shows that sellers dominated early in the session, pushing prices significantly lower, but buyers regained control and drove the price back up by the end of the session. The strong recovery within a single period suggests that the selling pressure may be exhausted and a bullish reversal could be imminent.
What is the Bullish Engulfing?
The Bullish Engulfing pattern consists of two candles and is a strong indication of a reversal. The first candle is bearish, and the second is a larger bullish candle that completely engulfs the body of the first one. This pattern appears after a downtrend and reflects a shift in control from sellers to buyers. The bullish candle’s large body shows strong buying interest that overpowers the previous session’s selling. A Bullish Engulfing pattern is even more significant if it occurs near a key support level, and it often signals the beginning of a potential upward move.
What is the Morning Star?
The Morning Star is a three-candle bullish reversal pattern that occurs after a downtrend. The first candle is a long bearish one, followed by a small-bodied candle (which can be bullish, bearish, or a doji), indicating indecision in the market. The third candle is a strong bullish candle that closes well into the body of the first candle. This formation shows a transition from selling pressure to buying interest. The Morning Star is a reliable signal of a shift in momentum, especially when confirmed by high volume or a breakout from a resistance level.
What is the Three White Soldiers?
The Three White Soldiers pattern is a powerful bullish reversal signal made up of three consecutive long-bodied bullish candles. Each candle opens within the previous candle’s real body and closes near or at its high, showing consistent buying pressure. This pattern often appears after a prolonged downtrend or a period of consolidation and reflects strong and sustained buying interest. The Three White Soldiers suggest that buyers are firmly in control, and the market may continue moving upward in the near term.
How to use bullish candlestick patterns in trading?
To effectively use bullish candlestick patterns in trading, it’s important not to rely on them in isolation. While these patterns can signal potential reversals, they work best when combined with other technical tools such as support and resistance levels, moving averages, trendlines, and volume analysis. Traders should also wait for confirmation after the pattern forms, such as a strong follow-through candle or a break above a resistance level, before entering a trade. Risk management is crucial—always use stop-loss orders to protect against false signals, and consider the broader market trend to increase the probability of success. By integrating candlestick analysis into a comprehensive trading strategy, traders can improve their timing and increase their chances of making profitable decisions.
Thanks for your support. If you enjoyed this analysis, make sure to follow me so you don't miss the next one. And if you found it helpful, feel free to drop a like 👍 and leave a comment 💬, I’d love to hear your thoughts!
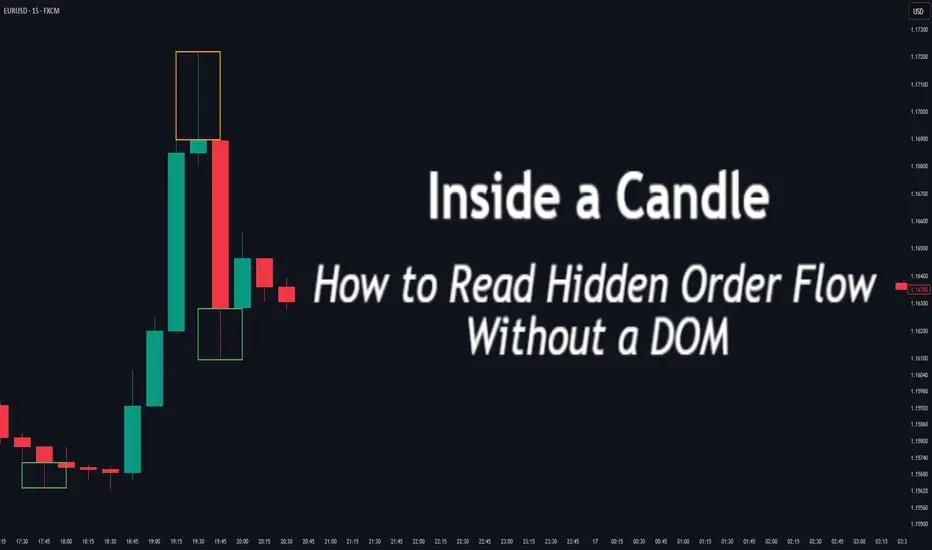
Inside a Candle: How to Read Hidden Order Flow Without a DOM
Difficulty: 🐳🐳🐳🐋🐋 (Intermediate+)
This article is for traders who want to understand the “story” behind a candle’s shape — and learn to spot aggressive buying/selling, absorption, and traps without needing footprint or order book tools.
🔵 INTRODUCTION
Most traders see candles as static shapes — green or red, big or small. But each candle is a battlefield of orders . Even without access to a DOM or volume footprint, you can still extract valuable information from just the candle's body, wick, and context .
🔵 ORIGINS: WHERE CANDLESTICKS COME FROM
Candlestick charts trace back to 18th-century Japan, where rice traders needed a way to visualize price movements over time. A legendary trader named Munehisa Homma , who traded rice futures in Osaka, is credited with developing the earliest form of candlestick analysis.
Homma discovered that price wasn’t just driven by supply and demand — but also by trader psychology . He created visual representations of market sentiment by tracking:
The opening and closing price of rice
The highest and lowest price reached during the session
This system became known as the “Sakata rules,” and it laid the foundation for many patterns still used today — such as Doji, Engulfing, and Marubozu.
Western traders only began using candlesticks widely in the 1990s, when analyst Steve Nison introduced them to the broader financial world through his book Japanese Candlestick Charting Techniques.
Today, candlesticks remain one of the most powerful and intuitive ways to visualize order flow, momentum, and market psychology — even without a Depth of Market (DOM) or depth of book.
In this article, you’ll learn how to read hidden order flow by analyzing:
Wick length and positioning
Body-to-range ratios
Candle clustering and sequences
🔵 HOW A CANDLE FORMS
Before you can read a candle, you need to understand how it comes to life . A single candle represents the full auction process during its time window.
Here’s how it builds, step by step:
Candle opens — this is the open price .
As price moves up during the session → the high] updates.
As price moves down → the low] updates.
The final traded price when the time closes → this becomes the close price .
The wick = price areas that were tested but rejected
The body = where the majority of aggressive trades occurred
If buyers push price up quickly but sellers slam it down before the close — the candle will have a long upper wick and close near the open, revealing seller absorption.
Understanding this flow helps you recognize traps, fakeouts, and reversals in real time.
🔵 CANDLE BODY: WHO'S IN CONTROL
The body of the candle reflects the result of the battle between buyers and sellers. A wide body with minimal wicks means dominance and commitment.
Big body, small wick → clear conviction
In an uptrend: buyer aggression
In a downtrend: panic or aggressive selling
Small body, long wicks → indecision, absorption, or trap
Often appears near tops/bottoms
Indicates both sides were active but neither won clearly
www.tradingview.com
🔵 WICKS: THE SHADOWS OF REJECTION
Wicks are not just “leftovers” — they show where price was rejected after being tested.
Long upper wick = seller presence or absorption at highs
Long lower wick = buyer defense or trap spring
Double wick = liquidity sweep / false breakout
Use wick direction to spot:
Failed breakouts
Smart money traps
Exhaustion candles
🔵 HIDDEN ORDER FLOW PATTERNS
1️⃣ Absorption Candle
A large wick with little movement afterward — shows that big orders absorbed market pressure.
2️⃣ Trap Candle
A candle that sweeps above/below a key high/low and closes opposite — classic smart money fakeout.
3️⃣ Imbalance Candle
Large-bodied candle that closes near the high/low with no wick on the other end — implies one-sided aggression (and often leaves an imbalance).
🔵 CLUSTERING & SEQUENCES MATTER
Never read a candle alone. The sequence of candles tells the full story:
3+ rejection wicks near resistance? Liquidity building before breakout or trap
Bearish engulfing after long upper wick = smart money selling into retail buying
Tight-range dojis + volume spike = compression before expansion
Context + volume + structure = hidden flow decoded.
🔵 PUTTING IT TOGETHER: A REAL EXAMPLE
Price breaks above previous high
Candle closes with long upper wick and smaller body
Next candle opens, dumps fast, leaving imbalance behind
Buyers trapped — move likely to continue down
This is how you read order flow from candle anatomy .
🔵 TIPS FOR MASTERY
Use a lower timeframe (1M–5M) to see microstructure
Watch how wicks behave near S/R or OBs
Confirm with volume spikes or delta-style indicators
Use replay mode to slow down the story and study cause/effect
🔵 CONCLUSION
Every candle is a message. You don’t need expensive tools to read order flow — just your eyes, context, and curiosity.
Learn to see candles not as symbols, but as evidence of behavior . Absorption, imbalance, and traps are all visible if you look closely.
Japanese Candlestick Cheat Sheet – Part Three- 3 candle patternsSo far in this series, we've broken down single candle formations ( Part 1 ) and explored double candle signals ( Part 2 ) — the kind of patterns that give you quick, often powerful hints about the market’s mood.
But now it’s time to go a step further.
👉 In Part 3, we dive into triple candlestick formations — patterns that take more time to form, but often offer stronger confirmation and a more reliable narrative.
They’re like reading three full sentences from the market instead of just one or two words.
If you’re ready to spot momentum shifts (not noise), this lesson is for you.
Let’s decode the story behind formations like Morning Star, Three White Soldiers, and so on.
MORNING STAR
Bias: Bullish
What is the Morning Star pattern?
The Morning Star pattern consists of a bearish candle, a small-bodied middle candle, and a bullish candle, forming at the end of a downtrend to signal potential reversal. This pattern reflects a shift from seller dominance to buyer strength, as the middle candle marks a pause before a reversal. The Morning Star is a reliable signal that buyer interest is reemerging.
Understanding Morning Stars helps traders anticipate shifts in momentum, providing valuable entry points for new uptrends.
Meaning:
Found in downtrends; signals potential bullish reversal as buyers gain control, with strength confirmed by the third candle closing above the first.
BULLISH ABANDONED BABY
Bias: Bullish
What is the Bullish Abandoned Baby pattern?
The Bullish Abandoned Baby is a rare but powerful reversal pattern that consists of a bearish candle, a gapped doji, and a bullish candle. The middle doji reflects indecision, while the third bullish candle confirms the reversal. This pattern highlights a dramatic shift in sentiment, showing that buyers are prepared to take control.
Recognizing the Bullish Abandoned Baby can offer traders insights into pivotal market shifts.
Meaning:
Appears in downtrends; suggests a strong bullish reversal, as the middle doji shows indecision, with confirmation by a strong bullish move.
THREE WHITE SOLDIERS
What is the Three White Soldiers pattern?
The Three White Soldiers pattern consists of three consecutive bullish candles, each closing higher than the last, often appearing in downtrends to signal a potential bullish reversal. This pattern reflects sustained buying pressure, indicating that buyer sentiment is strong. Psychologically, it shows that buyers are steadily gaining confidence, pushing prices upward.
For traders, Three White Soldiers provide a clear signal of momentum, ideal for capturing emerging trends.
Meaning:
Found in downtrends; signals potential trend reversal, showing sustained buying strength, often signaling the start of a bullish trend.
MORNING DOJI STAR
What is the Morning Doji Star pattern?
The Morning Doji Star pattern is similar to the Morning Star, but with a doji as the middle candle, indicating greater indecision before a reversal. This pattern consists of a bearish candle, a doji, and a bullish candle, highlighting a transition from bearish to bullish sentiment. The doji reflects a moment when market sentiment is balanced, but the third candle confirms a bullish shift.
Interpreting Morning Doji Stars can help traders identify turning points in downtrends, providing valuable entry opportunities.
Meaning:
Appears in downtrends; signals potential bullish reversal, with indecision from the doji and confirmation by a strong bullish candle.
EVENING STAR
What is the Evening Star pattern?
The Evening Star is a three-candle pattern that appears at the top of an uptrend, signaling a potential bearish reversal. It consists of a bullish candle, a small-bodied middle candle, and a bearish candle, showing a transition from buyer control to seller strength. This pattern often appears at market peaks, where optimism is giving way to caution.
Understanding the Evening Star pattern helps traders anticipate downtrend formations, allowing them to time their exits.
Meaning:
Found in uptrends; signals potential bearish reversal as sellers gain control, confirmed if the third candle closes below the first.
BEARISH ABANDONED BABY
What is the Bearish Abandoned Baby pattern?
The Bearish Abandoned Baby is the bearish counterpart to the Bullish Abandoned Baby and consists of a bullish candle, a gapped doji, and a bearish candle. This pattern reveals a dramatic shift in sentiment from bullish to bearish, highlighting a sudden reversal at the top of an uptrend.
Recognizing the Bearish Abandoned Baby can offer traders insight into market tops and impending trend changes.
Meaning:
Appears in uptrends; indicates strong bearish reversal, as indecision in the doji is followed by selling strength.
THREE BLACK CROWS
What is the Three Black Crows pattern?
The Three Black Crows pattern consists of three consecutive bearish candles, each closing lower than the last, appearing in uptrends to signal potential reversal. This pattern reflects sustained selling pressure, indicating that sellers are gaining control. The Three Black Crows highlight a moment when buyer confidence wanes, marking the beginning of downward momentum.
For traders, this pattern provides a clear signal to avoid buying into weakening trends or even entering short trades.
Meaning:
Found in uptrends; signals potential bearish reversal, with sustained selling pressure often marking the start of a downtrend.
EVENING DOJI STAR
What is the Evening Doji Star pattern?
The Evening Doji Star is similar to the Evening Star, but with a doji as the middle candle, highlighting greater indecision. This pattern consists of a bullish candle, a doji, and a bearish candle, indicating a shift from bullish to bearish sentiment. The doji suggests that buyers are losing control, with sellers prepared to reverse the trend.
Understanding Evening Doji Stars allows traders to recognize market tops, helping them avoid overextended trends.
Meaning:
Appears in uptrends; signals potential bearish reversal, as the doji suggests indecision, confirmed by strong selling on the third candle.
Japanese Candlestick Cheat Sheet – Part Two- 2 candle patternsTwo-Candle Patterns That Signal Shifts in Sentiment
Single candles whisper…
But two candles talk to each other — and when they do, they often reveal the first signs of a reversal or continuation.
In this second part of the series, we go deeper.
From engulfings to haramis, tweezer tops to piercing lines — these patterns don’t just look good on charts… they capture the psychological tug-of-war between buyers and sellers.
Price doesn’t lie.
And two candles in a row can say: “Something just changed.”
Learn to spot them early. Learn to listen when the chart speaks.
This is Part Two of your practical guide to mastering candlestick formations.
BULLISH KICKER
Bias: Bullish
What is the Bullish Kicker pattern?
The Bullish Kicker forms when a strong bullish candle follows a bearish one with no overlap between the two, indicating a sudden shift in sentiment. This pattern is a powerful indicator of a reversal as buyers take control. The sharp contrast between the bearish and bullish candles reflects a dramatic shift in market psychology, where bears are caught off-guard and forced to cover their positions.
Bullish Kickers are rare but extremely telling, providing a clear signal that sentiment is favoring buyers. Recognizing such decisive patterns can be a game-changer.
Meaning:
Found after downtrends or sell-offs; suggests a sudden shift in sentiment, indicating strong buying interest and potential trend reversal.
BULLISH ENGULFING
Bias: Bullish
What is the Bullish Engulfing pattern?
The Bullish Engulfing pattern occurs when a large bullish candle fully engulfs the previous smaller bearish candle, signaling a potential trend reversal. This pattern highlights a moment when buyers overpower sellers, often marking the beginning of upward momentum. Psychologically, it suggests that buyer confidence is returning, and sellers are losing their grip.
For traders, understanding Bullish Engulfing patterns can provide crucial entry points into emerging trends. Learning to identify and trade such patterns is essential for capturing momentum and new trends.
Meaning:
Typically found in downtrends, this pattern signals a potential bullish reversal as buyers overpower sellers, often indicating a shift toward upward momentum.
BULLISH HARAMI
Bias: Bullish
What is the Bullish Harami pattern?
The Bullish Harami consists of a small bullish candle within a preceding larger bearish one, indicating a pause in downward momentum and hinting at a potential reversal. This pattern shows that sellers are beginning to weaken as buyers cautiously test the waters. The Harami reflects a shift in sentiment from bearish to neutral, often marking a transitional phase in the market.
Interpreting the Bullish Harami helps traders spot moments when sentiment is shifting, potentially signaling the start of a trend change.
Meaning:
Seen in downtrends, it suggests indecision, with possible bullish reversal if the following candles confirm buying strength, indicating a weakening bearish trend.
PIERCING LINE
Bias: Bullish
What is the Piercing Line pattern?
The Piercing Line forms when a bullish candle opens below the previous bearish candle’s low but closes over halfway into it. Found in downtrends, this pattern reflects strong buying pressure as buyers step in at lower prices, creating a potential bullish reversal. The Piercing Line pattern suggests that sentiment may be shifting as buyers gain confidence.
This pattern’s strength lies in its psychological impact, revealing moments when buyers are willing to take risks. Recognizing these signs early can provide valuable insights for traders looking to time entries.
Meaning :
Found in downtrends, this pattern suggests a possible bullish reversal if buying continues, as sellers lose control to buyers.
TWEEZER BOTTOM
Bias: Bullish
What is the Tweezer Bottom pattern?
The Tweezer Bottom pattern is characterized by two consecutive candles with nearly identical lows, one bearish and one bullish. This pattern often signals the end of a downtrend, as the matching lows suggest a strong support level where buyers are stepping in. The Tweezer Bottom highlights market psychology at work, with sellers unable to push prices lower, reflecting renewed buying interest.
Tweezer Bottoms are ideal for traders looking to identify support zones and potential reversal points. By understanding this pattern’s significance, traders can make informed decisions.
Meaning:
Found in downtrends, it signals potential reversal, showing strong support at the matching low, suggesting buyers are stepping in.
BEARISH KICKER
Bias: Bearish
What is the Bearish Kicker pattern?
The Bearish Kicker is the inverse of the Bullish Kicker, forming when a strong bearish candle follows a bullish one without overlap, indicating a sharp sentiment shift. This pattern often marks a sudden reversal, with sellers taking control after an initial bullish period. Psychologically, Bearish Kickers are powerful, signaling that buyers are caught off-guard and losing momentum.
Recognizing Bearish Kickers provides traders with insights into sudden shifts in market dynamics, helping them avoid buying into weakening trends.
Meaning:
Found after uptrends; indicates a sudden sentiment shift, signaling potential trend reversal and intensified selling pressure.
BEARISH ENGULFING
Bias: Bearish
What is the Bearish Engulfing pattern?
The Bearish Engulfing pattern forms when a large bearish candle engulfs the previous smaller bullish candle, suggesting a potential reversal in an uptrend. This pattern signals that sellers have regained control, often marking the start of downward momentum. The Bearish Engulfing reveals a psychological shift, as selling pressure overtakes buying interest.
This pattern is a powerful tool for traders who aim to catch trend reversals, allowing them to align with emerging downward momentum.
Meaning:
Typically found in uptrends, this pattern signals a potential bearish reversal as sellers overpower buyers, often indicating a downward momentum shift.
BEARISH HARAMI
Bias: Bearish
What is the Bearish Harami pattern?
The Bearish Harami consists of a small bearish candle contained within a larger preceding bullish one, reflecting indecision and a potential trend reversal. Found in uptrends, it hints that buyers are losing strength, while sellers are cautiously testing the market. This pattern highlights moments when buyer momentum begins to wane, suggesting caution.
Interpreting the Bearish Harami allows traders to spot potential shifts in sentiment, helping them manage risk and time their exits.
Meaning:
Seen in uptrends, it suggests indecision with a potential bearish reversal if following candles confirm, indicating a weakening bullish trend.
DARK CLOUD COVER
Bias: Bearish
What is the Dark Cloud Cover pattern?
The Dark Cloud Cover appears when a bearish candle opens above the previous bullish candle but closes over halfway into it, reflecting a shift in control from buyers to sellers. This pattern suggests that bullish momentum may be fading, hinting at a potential reversal. Dark Cloud Cover patterns reveal moments when sentiment shifts from optimism to caution.
For traders, understanding this pattern helps them anticipate reversals at the top of uptrends.
Meaning:
Found in uptrends; signals potential bearish reversal if selling continues, as buyers lose control to sellers.
TWEEZER TOP
Bias: Bearish
W hat is the Tweezer Top pattern?
The Tweezer Top is formed by two candles with matching or nearly matching highs, typically one bullish and one bearish. This pattern signals potential resistance, as sellers are consistently pushing back against the same level. The Tweezer Top reflects a moment of seller strength, often marking the end of an uptrend.
Recognizing Tweezer Tops helps traders spot resistance zones and potential reversal points, allowing them to avoid buying into weakening trends or even shorting the asset.
Meaning:
Found in uptrends, it signals potential reversal, showing strong resistance at the matching high, suggesting selling pressure.
🧭 Final Thought
Two-candle formations often appear at key turning points — right where most traders hesitate or get trapped.
Learn to read them not just as patterns, but as conversations between candles — one pushing, the other reacting.
And if this is your first time reading the series, don’t miss Part One – where we covered single-candle signals like dojis, hammers, and marubozus — the very foundations of candlestick reading.
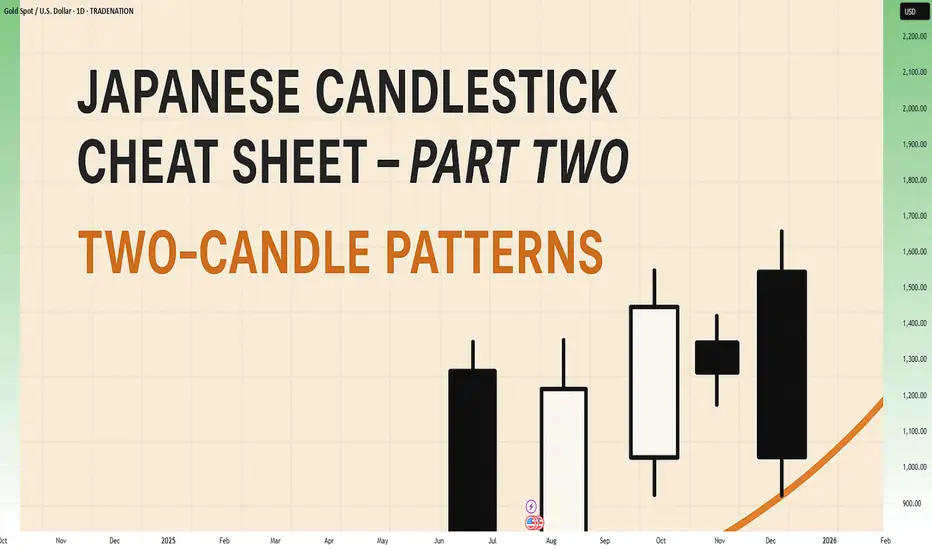
Japanese Candlestick Cheat Sheet – Part OneSingle-Candle Formations That Speak
Before you dream of profits, learn the one language that never lies: price.
Indicators are just subtitles — price is the voice.
Japanese candlesticks are more than just red and green bars — they reflect emotion, pressure, and intention within the market.
This series will walk you through the real psychology behind candlestick patterns — starting here, with the most essential:
🕯️ Single-candle formations — the quiet signals that often appear before big moves happen.
If you can’t read a doji, you’re not ready to understand the market’s hesitation.
If you ignore a hammer, you’ll miss the moment sentiment shifts.
Let’s start simple. Let’s start strong.
This is Part One of a five-part series designed to build your candlestick fluency from the ground up.
1. DOJI
Bias: Neutral
What is the Doji pattern?
The Doji candlestick pattern forms when a candle’s open and close prices are nearly identical, resulting in a small or nonexistent body with wicks on both sides. This pattern reflects market equilibrium, where neither buyers nor sellers dominate. Dojis often appear at trend ends, signaling potential reversals or pauses.
As a fundamental tool in technical analysis, Dojis help traders gauge the psychological battle between buyers and sellers. Proper interpretation requires context and experience, especially for spotting trend shifts.
Meaning:
Indicates market indecision or balance. Found during trends and may signal a reversal or continuation based on context.
LONG-LEGGED DOJI
Bias: Neutral
What is the Long-Legged Doji pattern?
The Long-Legged Doji captures a moment of intense uncertainty and volatility in the market. Its long wicks represent significant movement on both sides, suggesting that neither buyers nor sellers have control. This back-and-forth reflects the psychology of market participants wrestling for control, which often foreshadows a shift in sentiment. When traders see a Long-Legged Doji, it highlights the need to monitor for potential changes in direction.
They can appear within trends, at potential reversal points, or at consolidation zones. When they form at the end of an uptrend or downtrend, they often signal that the current trend may be losing momentum.
Meaning:
The prominent wicks indicate volatility. Buyers and sellers pushed prices in opposite directions throughout the session, ultimately reaching an indecisive close.
SPINNING TOP
Bias: Neutral
What is the Spinning Top pattern?
A Spinning Top is a candlestick with a small body and long upper and lower wicks, indicating that the market has fluctuated significantly but ultimately closed near its opening price. This pattern often points to a moment of indecision, where both buyers and sellers are active but neither dominates. Spinning Tops are commonly found within both uptrends and downtrends and can suggest that a trend is losing momentum.
For traders, a Spinning Top provides a valuable insight into market psychology, as it hints that the prevailing sentiment may be weakening. While Spinning Tops alone aren’t always definitive, they can serve as a precursor to larger moves if the following candles confirm a shift in sentiment.
Meaning:
Shows indecision between buyers and sellers. Common in both up and downtrends; signals potential reversal or pause.
HAMMER
Bias: Bullish
What is the Hammer pattern?
A Hammer candlestick appears at the end of a downtrend, with a small body and a long lower wick. This shape reflects a moment when sellers pushed prices lower, but buyers managed to absorb the selling pressure and drive prices back up before the close. This pattern is particularly important for spotting potential reversals, as it indicates that buyers are beginning to reassert control.
Hammers reveal the underlying psychology of a market where buying confidence is emerging, even if sellers have dominated for a while. To successfully trade this pattern, it’s essential to confirm the reversal with subsequent candles.
Meaning:
Showing rejection of lower prices. Signals potential bullish reversal, especially if followed by strong buying candles.
INVERTED HAMMER
Bias: Bullish
What is the Inverted Hammer pattern?
The Inverted Hammer forms at the bottom of a downtrend, with a small body and long upper wick. This pattern shows that buyers attempted to push prices higher, but sellers ultimately brought them back down by the close. The Inverted Hammer is an early sign of buyer interest, hinting that a trend reversal may be underway if subsequent candles confirm the shift.
Interpreting the Inverted Hammer helps traders understand where sentiment may be shifting from bearish to bullish, often marking the beginning of a recovery. Recognizing these patterns takes practice and familiarity with market conditions.
Meaning:
Showing rejection of higher prices. Can signal bullish reversal if confirmed by subsequent buying pressure.
DRAGONFLY DOJI
Bias: Bullish
What is the Dragonfly Doji pattern?
The Dragonfly Doji has a long lower wick and no upper wick, forming in downtrends to signal potential bullish reversal. This pattern reveals that sellers were initially in control, pushing prices lower, but buyers stepped in to push prices back up to the opening level. The Dragonfly Doji’s unique shape signifies that strong buying support exists at the lower price level, hinting at an impending reversal.
Recognizing the psychology behind a Dragonfly Doji can enhance a trader’s ability to anticipate trend changes, especially in markets where support levels are being tested.
Meaning:
Found in downtrends; suggests possible bullish reversal if confirmed by a strong upward move.
BULLISH MARUBOZU
Bias: Bullish
What is the Bullish Marubozu pattern?
The Bullish Marubozu is a large, solid candle with no wicks, indicating that buyers were in complete control throughout the session. This pattern appears in uptrends, where it signals strong buying momentum and often foreshadows continued upward movement. The absence of wicks reveals that prices consistently moved higher, with little resistance from sellers.
For traders, the Bullish Marubozu offers a glimpse into market psychology, highlighting moments when buyer sentiment is particularly strong. Learning to identify these periods of intense momentum is crucial for trading success.
Meaning:
Showing complete buying control. Found in uptrends or at reversal points; indicates strong buying pressure and likely continuation of the trend.
SHOOTING STAR
Bias: Bearish
What is the Shooting Star pattern?
The Shooting Star appears at the top of an uptrend, characterized by a small body and a long upper wick, indicating a potential bearish reversal. Buyers initially drove prices higher, but sellers took over, bringing prices back down near the open. This shift suggests that buyers may be losing control, and a reversal could be imminent.
Interpreting the Shooting Star gives traders valuable insights into moments when optimism begins to fade, providing clues about a potential trend shift.
Meaning:
Indicating rejection of higher prices. Signals a potential bearish reversal if followed by selling pressure.
HANGING MAN
Bias: Bearish
W hat is the Hanging Man pattern?
The Hanging Man candle forms at the top of an uptrend, with a small body and long lower wick. This pattern suggests that sellers attempted to drive prices down, but buyers regained control. However, the presence of a long lower shadow hints that sellers may be gaining strength, potentially signaling a bearish reversal.
The Hanging Man pattern reflects market psychology where buyers might be overextended, making it a valuable tool for identifying potential tops in trends.
Meaning:
Signals potential bearish reversal if confirmed by selling candles afterward.
GRAVESTONE DOJI
Bias: Bearish
What is the Gravestone Doji pattern?
With a long upper wick and no lower wick, the Gravestone Doji reveals that buyers pushed prices up, but sellers eventually regained control. Found in uptrends, it suggests that a bearish reversal could be near, as the upper shadow indicates buyer exhaustion. The Gravestone Doji often appears at market tops, making it a valuable indicator for those looking to anticipate shifts.
Understanding the psychology behind this pattern helps traders make informed decisions, especially in markets prone to overbought conditions.
Meaning:
Showing rejection of higher prices. Found in uptrends; signals potential bearish reversal if followed by selling activity.
BEARISH MARUBOZU
Bias: Bearish
What is the Bearish Marubozu pattern?
The Bearish Marubozu is a large, solid bearish candle without wicks, showing that sellers held control throughout the session. Found in downtrends, it signals strong bearish sentiment and suggests that the trend is likely to continue. The lack of wicks reflects consistent downward momentum without significant buyer support.
This pattern speaks about market psychology, offering traders insights into moments of intense selling pressure. Recognizing the Bearish Marubozu can help you align with prevailing trends and avoid buying into weakening markets
Meaning:
Showing strong selling pressure. Found in downtrends; signals continuation of the bearish trend or an intensifying sell-off.
👉 Up next: Double-candle formations – where price meets reaction.
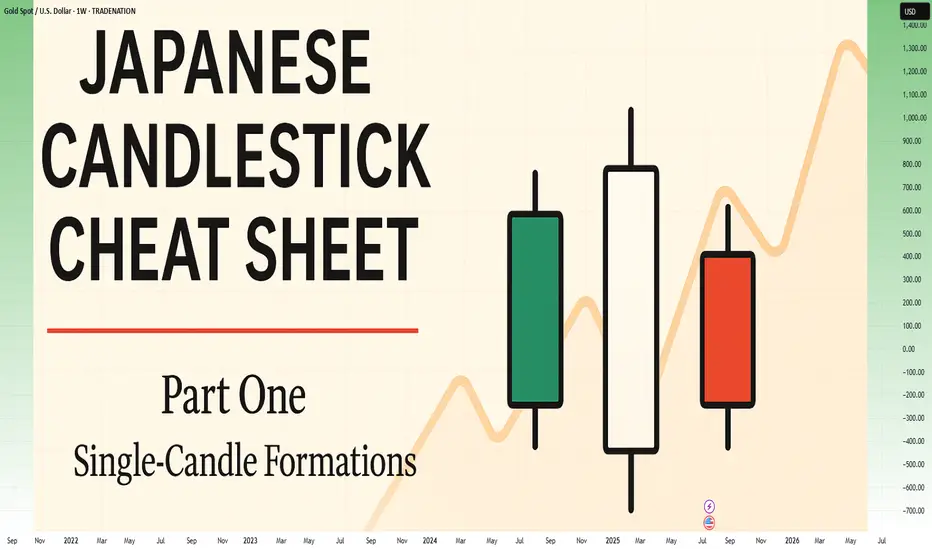
Candlestick Patterns - How to read them like a ProOverview
Candlestick charts serve as a cornerstone in technical analysis, presenting price activity in a visually digestible format. By examining how prices move over a given timeframe, traders gain key insights into potential market direction, sentiment shifts, and trend strength.
Mastering candlestick interpretation is essential for identifying bullish or bearish sentiment, as well as for spotting possible trend reversals or continuations. Still, candlesticks alone don’t paint the full picture—using them without broader context increases the risk of false signals.
---
What You'll Learn
What are candlestick charts?
Common bearish candlestick patterns
Common bullish candlestick patterns
How to apply candlestick analysis in trading
---
What is a Candlestick Chart?
A candlestick provides a snapshot of an asset’s price behavior during a specific time interval, whether it's one minute, one hour, or one day. This format allows traders to quickly assess how the price has moved within that period.
Each candle reveals four price points:
* Open – the price at the beginning of the interval
* Close – the price at the end of the interval
* High – the highest price reached
* Low – the lowest price during that time
Anatomy of a Candlestick:
* Body: The thick section between the open and close. A green (or white) body means the close was higher than the open (bullish), while red (or black) means the opposite (bearish).
* Wicks (or Shadows): Thin lines extending from the body to indicate the high and low.
* Upper wick: Marks the highest traded price
* Lower wick: Marks the lowest traded price
---
Bearish Candlestick Patterns
Understanding bearish candlestick patterns helps traders identify moments when buying momentum might be running out—setting the stage for a potential downward shift.
Evening Star
A three-candle formation that signals a shift from buying pressure to selling dominance. It starts with a strong bullish candle, followed by a small-bodied candle of indecision, and concludes with a large bearish candle that cuts deep into the first. This pattern often appears at the end of an uptrend.
Bearish Engulfing
This setup includes a small bullish candle followed by a large bearish candle that completely swallows the previous one. It indicates that sellers have seized control, potentially marking the beginning of a downward trend.
Shooting Star
With a small real body near the low and a long upper wick, this pattern reflects strong early buying that is ultimately rejected by the close—suggesting fading bullish momentum.
Gravestone Doji
This candle opens, closes, and hits its low all around the same price, leaving a long upper wick. It suggests that bulls pushed higher during the session but were overpowered by bears by the close.
Three Crows
Three consecutive bearish candles, all approximately the same size. These indicate that a sell off is coming soon.
---
Bullish Candlestick Patterns
Bullish patterns can alert traders to possible reversals after a downtrend or strengthen conviction during an uptrend.
Morning Star
This three-candle formation marks a potential turning point from bearish to bullish. It begins with a strong bearish candle, followed by a smaller candle showing indecision, and ends with a large bullish candle breaking upward—signaling buying strength is returning.
Bullish Engulfing
This two-candle pattern begins with a bearish candle, then a larger bullish candle that completely envelops the previous body. It reflects a sharp transition in sentiment, suggesting renewed buying pressure.
Dragonfly Doji
A single candle where the open, close, and high are all very close, with a long lower wick. It shows sellers pushed prices lower but buyers stepped in and brought them back up—an early sign of possible reversal.
Hammer
A classic bullish reversal signal that features a small real body near the top and a long lower shadow. It indicates a battle where sellers initially dominated, but buyers managed to close near the open price.
Three soldiers
Three consecutive bullish candles, all approximately the same size. These indicate that a big buy is coming soon.
---
Trading with Candlestick Patterns
Candlestick patterns become more meaningful when they align with major chart areas—such as previous support or resistance, trendlines, or retracement zones. A bullish signal at a support level can hint that the downward pressure is fading, while a bearish pattern at resistance may warn of an upcoming decline.
To increase the reliability of your trades, combine candlestick patterns with other forms of technical analysis:
* Support & Resistance Zones: These are price levels where the market has historically reacted. Candlestick patterns forming near these zones have stronger potential implications.
* Fibonacci Levels : These help identify likely retracement areas. When a candlestick pattern forms near a key Fibonacci level like 61.8%, it adds strength to a potential reversal setup.
* Liquidity Areas: Clusters of orders (buy or sell) tend to create strong reactions. When patterns appear in these zones, they often precede more decisive moves.
* Technical Indicators : RSI, MACD, Moving Averages, and Stochastic RSI can provide confirmation. For instance, a bullish reversal pattern that appears when RSI is oversold strengthens the signal.
💡 Tip: Don’t rush into trades based on one candlestick alone. Always wait for the next candle or price confirmation (e.g., a break of a previous high/low) to validate your signal.
---
Thanks for Reading!
✨ If you found this helpful, show some love by liking or commenting!
🔔 Don’t forget to follow for more technical breakdowns and trading insights coming soon!

3 Line Strike Pattern: What It Means and How to Use It3 Line Strike Pattern: What It Means and How to Use It in Trading
Candlestick patterns are crucial tools for traders, offering valuable insights into market sentiment and potential price movements. Among these patterns, the Three Line Strike setup is particularly sought after by traders in forex, stock, commodity, and index markets. This article explores the intricacies of the Three Line Strike, explaining how to identify it on charts, highlighting its unique characteristics, and discussing how to incorporate it into trading strategies.
Three Line Strike Pattern: An Overview
The Three Line Strike is a candlestick pattern used in technical analysis to trade trend continuations. However, it often appears ahead of trend reversals. The pattern consists of four candlesticks and can be found in up- and downtrends.
Bearish Three Line Strike
The bearish 3 Line Strike candlestick pattern suggests a continuation of a downtrend. It starts with three consecutive bearish candles, each opening and closing lower than the previous one. This is followed by a large bullish candle, which opens lower and closes above the open price of the first bearish candle. This pattern reflects the strength of the downtrend. Still, it may appear at the bottom of the downtrend and signal a trend reversal.
Bullish Three Line Strike
The bullish 3 Line Strike candlestick pattern suggests the potential continuation of a solid uptrend. It starts with three consecutive bullish candles, each opening and closing higher than the last. This is followed by a large bearish candle, which opens higher and closes below the close of the first bullish candle. This pattern indicates that the solid uptrend may continue, but it may signal the market will turn down if it’s formed at the peak of the uptrend.
Analysing Three Line Strike Patterns
As the Three Line Strike pattern can provide both reversal and continuation signals, it’s vital to combine it with other analytical tools, including trend indicators like moving averages and oscillators like the Relative Strength Index. Also, traders consider the overall trend on higher timeframes.
- Entry: To enter a trade using the Three Line Strike, traders identify the overall trend. They may wait for the pattern to be formed and the following candle to close. If the following candle is bearish, traders usually open a sell position. If it is bullish, they consider an opportunity to go long. However, traders also may enter the market at the closure of the pattern’s fourth candle.
- Stop Loss: Risk management is crucial, and traders typically set their stop-loss levels above/below the fourth candle, considering the trend strength. Alternatively, they may place the stop-loss order below or above the nearest swing point or support/resistance level, considering market volatility and risk tolerance.
- Take Profit: Traders aim to secure their potential profits by setting profit targets based on the risk/reward ratio. This could be at the next significant support or resistance level or based on technical indicators, including Fibonacci retracements.
A trader finds a bullish 3 Line Strike setup on the daily chart of Qualcomm stock. However, this time, it serves as a reversal signal. They enter the short position at the close of the candle, following the pattern. Their stop loss is above the setup, with the take profit at the next support level.
A bearish Three Line Strike setup is formed on the hourly chart of Brent Crude Oil. A trader takes a long position at the close of the fourth candlestick. Their stop loss is below the formation, with the take profit placed at the next resistance level.
Psychology Behind the Three Line Strike Pattern
The effectiveness of the Three Line Strike pattern relies on understanding the underlying psychological factors influencing market participants. Greed, fear, hope, and anxiety drive buying and selling decisions.
- Initial Sentiment: The first few candlesticks in a Three Line Strike candlestick pattern represent the prevailing sentiment in the market. Typically, this sentiment is characterised by either greed (in an upward trend) or fear (in a downward trend), depending on the market direction prior to forming the pattern.
- Potential Reversal: Although this pattern is considered continuation, in most cases, it provides a reversal signal. A strong fourth candle that engulfs three smaller candlesticks reflects the change in the market sentiment. The reversal signal triggers market participants to reassess existing positions and strategies.
- Reaction: Those who were previously aligned with the old trend may feel fear or anxiety, leading them to unwind their positions to avoid potential losses. Meanwhile, contrarian traders, driven by a sense of opportunity and confidence, may enter new positions in anticipation of the emerging trend reversal, fueled by their belief that market sentiment is shifting.
Application in Trading Strategies
Applying the 3 Line strike pattern in trading strategies encompasses various elements beyond just its recognition. Let's delve into how traders implement additional steps to enhance their overall trading performance.
- Seeking Additional Confirmation: Traders often seek additional confirmation from other technical indicators such as the Relative Strength Index (RSI), Moving Average Convergence Divergence (MACD), or Bollinger Bands. These indicators offer complementary insights into market dynamics, validating the signals generated by the Three Line Strike pattern.
- Strategic Placement and Timeframe Alignment: Traders may align the pattern with key support or resistance levels on higher timeframes to validate its significance and potential reversal points. Through multi-timeframe trading, traders may gain a more comprehensive understanding of market trends to analyse future price movements.
- Entry and Risk Management: Traders should place their entry and exit points carefully. As the pattern may provide continuation and reversal signals, incorporating disciplined risk management techniques might help traders protect their capital and minimise their potential losses.
Caveats to the Pattern
High volatility periods can amplify the occurrence of false signals and erratic price movements, potentially leading to misguided trades. Conversely, during periods of low volatility, price action may be sluggish, and confirmations could be delayed. Therefore, it's important for traders to adapt their strategies accordingly.
Another important consideration is the possibility of false breakouts. Despite the apparent formation of a Three Line Strike pattern, there's a risk of the price briefly breaching the pattern's boundaries before reverting to its original direction. These false breakouts can deceive traders into entering premature trades, resulting in losses. To mitigate this risk, traders can exercise patience and vigilance, waiting for strong confirmation signals before committing to a trade.
Key Differences Between Three Line Strike and The Three Black Crows/Three White Soldiers
The key differences between the Three Line Strike pattern and the Three Black Crows/Three White Soldiers patterns lie in their trading formations and implications:
Aspect - Three Line Strike Pattern
Formation - Consists of four consecutive candlesticks, with the fourth candlestick completely engulfing the previous three.
Implication - Indicates either a trend continuation or a reversal in market sentiment, either from bullish to bearish or vice versa.
Aspect - Three Black Crows/Three White Soldiers
Formation - Consists of three consecutive candlesticks with progressively lower (crows) or higher (soldiers) closing prices.
Implication - Reflects a strong momentum in the direction of the prevailing trend, suggesting a continuation of the trend rather than a reversal.
The Bottom Line
The Three Line Strike is a complicated pattern as it may provide continuation and reversal signals. Despite its complexity, it often appears on a price chart, making it a valuable tool for traders. Mastering price action chart analysis is a gradual process. However, with skill, traders can potentially improve their trading efficiency.
FAQs
What Is the 3 Strike Rule in Trading?
The 3 strike rule in trading refers to the Three Line Strike pattern. The pattern consists of three consecutive up/down candles followed by a fourth long bearish/bullish candle that opens above/below the previous candle’s close but closes below/above the first candle's open. It’s believed to provide continuation signals, but it often appears before a trend reversal.
What Is the Three Strike Strategy?
The Three Strike Strategy refers to the 3 Line Strike candlestick pattern. It’s based on the assumption that the pattern will be followed by either a reversal or a continuation of the trend. Traders often wait for the candlestick to close above/below the pattern for an entry point, place a profit target, considering the closest resistance/support levels, and potentially limit losses by placing a stop-loss order below/above the pattern.
This article represents the opinion of the Companies operating under the FXOpen brand only. It is not to be construed as an offer, solicitation, or recommendation with respect to products and services provided by the Companies operating under the FXOpen brand, nor is it to be considered financial advice.

What Is a Morning Star Pattern & How Can You Use It in Trading?What Is a Morning Star Pattern, and How Can You Use It in Trading?
The morning star candlestick is a popular price action pattern that technical analysts and traders use to identify potential trading opportunities. It indicates a reversal from a bearish to a bullish trend and is a valuable addition to any trader's toolkit. In this article, we will cover all the technical aspects of the morning star candlestick pattern.
What Is the Morning Star Candlestick Pattern?
The morning star in technical analysis is a reversal formation that appears at the end of a downtrend and signals a trend reversal. It consists of three candles.
To identify it on the chart, you should look for the following:
1. Downtrend: The market should be in a downtrend, and the first candle should be long and bearish.
2. Indecision: The second candle is usually expected to have a gap down, but gaps are uncommon in forex. Therefore, a small-bodied candle is considered sufficient. It's worth noting it can be either bullish or bearish, but if it’s bullish, the signal is stronger.
3. Significant increase: The third candle should be strong and bullish and close above the midpoint of the first bearish one. If it forms with a gap up, the buy signal is considered stronger.
When Morning Star Candlestick Patterns Occur
Traders can identify the morning star candlestick pattern in stocks, forex pairs, commodities, and cryptocurrencies*. It may also be observed across various timeframes, from minutes to weeks.
Generally speaking, a morning star pattern can be considered more reliable when it appears on a higher timeframe. For instance, a morning star candlestick pattern has more significance when it occurs over three days vs three minutes, given the increased amount of price action and market participation reflected over longer periods.
Psychology Behind the Pattern
The morning star reversal pattern reflects a shift in market sentiment from bearish to bullish. Initially, a strong bearish candle indicates prevailing selling pressure. The second candle, with its small body, suggests indecision as the market stabilises and neither bulls nor bears dominate. This pause indicates that sellers are losing momentum. The third morning star candle, a strong bullish one, confirms the shift as buyers take control, driving prices higher. This pattern signals that the downtrend is likely exhausted, and a potential reversal is underway due to increasing buyer confidence.
Trading with the Morning Star
Traders can use the following steps to trade this setup:
1. Identify the setup: Look for a setup on the chart formed after a solid downtrend.
2. Confirmation: After identifying the formation, traders should confirm it before entering a long position.
3. Enter a long position: Consider entering a long position once the formation is confirmed.
4. Determine a take-profit target: Although candlesticks don’t provide specific entry and exit points, traders may consider the closest resistance level to take potential profit.
5. Monitor the trade: Continuously monitor the trade and adjust the stop-loss and take-profit levels as needed based on market conditions.
What Is the Morning Star Candlestick Strategy?
The morning star trading strategy leverages the formation's ability to signal a bullish reversal after a downtrend. The formation's reliability increases when it occurs at a support level and is confirmed by a momentum indicator like the RSI or MACD.
Entry:
- Traders look for the full morning star to form at a support level.
- They then look for a confirmatory bullish signal from a momentum indicator, such as RSI showing oversold conditions, a bullish MACD crossover, or a bullish divergence in either.
- Traders may wait for additional confirmation, like RSI moving back above 30, or enter on the close of the third candle in the pattern.
Stop Loss:
- A stop loss might be set below the swing low of the setup.
- Alternatively, traders may place the stop loss beyond the lower boundary of the established support level.
Take Profit:
- Profits might be taken at a predetermined risk-reward ratio, like 2:1 or 3:1.
- Traders also often aim for an opposing resistance level where a further reversal might occur.
Morning Star and Other Formations
Traders should not confuse the morning star candle formation with other formations, such as the evening star, which is the complete opposite.
Doji Morning Star
In a traditional morning star reversal pattern, the candle that appears in the middle of the formation has a small real body, meaning there is a clear difference between the opening and closing prices.
In a morning doji star formation, the second candlestick has characteristics of a doji, where the opening and closing prices are very close to each other, resulting in a very small real body. This reflects the indecision as neither bulls nor bears can take control of the market.
The doji setup is less common than the traditional formation, but it still signals a potential upward movement after a prolonged downtrend.
Evening Star
In contrast to a morning setup, an evening star is a bearish setup occurring after an uptrend. It also consists of three candles – a long bullish one, a small-body one (it can also be a doji), and a long bearish one that closes below the midpoint of the first bullish candle. This suggests that the market is about to turn down.
Benefits and Limitations of the Morning Star Candle
The morning star is a useful tool for traders seeking to identify potential market reversals, but it does come with some benefits and limitations.
Benefits
- Strong Reversal Signal: Indicates a bullish reversal after a downtrend, helping traders anticipate upward moves.
- Broad Applicability: Effective across various financial instruments such as forex, stocks, commodities, and cryptocurrencies*.
- Timeframe Flexibility: It can be observed on different timeframes, from intraday to weekly charts.
Limitations
- False Signals: Like all patterns, it can produce false signals, especially in volatile markets.
- Confirmation Needed: A morning star pattern entry requires confirmation from additional indicators or formations to improve accuracy.
- Experience Required: Identifying the formation correctly and interpreting its signals requires experience and a good understanding of price action.
Final Thoughts
While candlestick formations such as the morning star can be useful for traders to identify potential trading opportunities, it is crucial to remember that they are not foolproof and should not be the sole choice of market participants when making their trading decisions. Traders should also incorporate technical indicators and develop risk management techniques to potentially minimise losses.
FAQ
What Is a Morning Star in Trading?
The meaning of a morning star in trading refers to a bullish reversal formation consisting of three candles. It appears at the end of a downtrend, indicating a potential shift to an uptrend. The setup includes a long bearish candle, a small-bodied candle, and a long bullish candle.
Is the Morning Star Bullish or Bearish?
It is a bullish candlestick pattern that indicates a potential reversal from a downtrend to an uptrend in the market. It suggests that the selling pressure is subsiding, and buying pressure is beginning to take over.
What Does the Morning Star Pattern Indicate?
It is a three-candle price action, often indicating a bullish reversal in the market. It suggests that selling pressure has been exhausted, and buyers are starting to gain control of the market.
How Do You Read the Morning Star Pattern?
To read the morning star formation, traders should look for the following characteristics: a long bearish candle formed in a solid downtrend and followed by a bullish or bearish candle with a small real body, which in turn is followed by a long bullish candle closing above the midpoint of the first one.
What Is the Opposite of Morning Star?
The opposite of a morning star is the evening star, a bearish reversal pattern. It appears at the end of an uptrend, signalling a potential shift to a downtrend. The morning and evening stars are similar, except the latter mirrors the former, consisting of a long bullish candle, a small-bodied candle, and a long bearish candle.
*Important: At FXOpen UK, Cryptocurrency trading via CFDs is only available to our Professional clients. They are not available for trading by Retail clients. To find out more information about how this may affect you, please get in touch with our team.
This article represents the opinion of the Companies operating under the FXOpen brand only. It is not to be construed as an offer, solicitation, or recommendation with respect to products and services provided by the Companies operating under the FXOpen brand, nor is it to be considered financial advice.

What is a Bearish Breakaway and How To Spot One!This Educational Idea consists of:
- What a Bearish Breakaway Candlestick Pattern is
- How its Formed
- Added Confirmations
The example comes to us from EURGBP over the evening hours!
Since I was late to turn it into a Trade Idea, perfect opportunity for a Learning Curve!
Hope you enjoy and find value!

Bullish Engulfing Pattern: A Strong Reversal SignalBullish Engulfing Pattern: A Strong Reversal Signal
The bullish engulfing pattern is a two-candlestick formation that suggests a possible reversal from a downtrend to an uptrend in the financial market. This particular pattern holds immense value for traders and technical analysts as it equips them with the means to discern potential buying opportunities. In this article, we will explain how traders implement this pattern in their trading strategies.
What Is a Bullish Engulfing Pattern?
The bullish engulfing is a technical analysis pattern consisting of two candles. This formation emerges when a large bearish candlestick is succeeded by a larger green one that entirely engulfs it.
What does the bullish engulfing mean? The bullish engulfing indicates a potential shift in market sentiment, suggesting that buying pressure might surpass selling pressure in the near future and highlighting a possible reversal from a downtrend to an uptrend.
Traders can find the bullish engulfing candlestick pattern across various financial instruments, including currencies, stocks, cryptocurrencies*, ETFs, and indices.
Bearish Engulfing vs Bullish Engulfing
The bullish engulfing pattern has a counterparty - bearish engulfing. The bearish engulfing pattern occurs during an uptrend, indicating a change in market sentiment and potential price reversal to the downside. It consists of two candles, where the second is larger and bearish and completely engulfs the body of the preceding candlestick.
How Can You Trade the Bullish Engulfing Pattern?
Here are some steps traders consider when trading with the bullish engulfing:
- Identification: Look for a clear bullish engulfing setup on a price chart at the end of a downtrend.
- Entry Point: Although candlestick patterns don't provide precise entry and exit points as chart patterns do, there are general rules you could use.
The entry point could be set slightly above the high of the bullish engulfing formation. In the conservative approach, traders enter the market after several candles close higher. In a risky approach, traders open a buy position after the pattern is formed.
- Exit Point: A stop-loss level could be below the low of the engulfing candle or below a nearby support level. A take-profit level could be based on a trader’s risk/reward ratio or key resistance levels.
- Risk Management: You can consider a risk management strategy to potentially limit losses. Traders focus on appropriate position sizing and risk-to-reward ratios to maintain a balanced approach to trading.
- Trade Monitoring: Once you have entered the trade, monitor price action and market conditions. Pay attention to any sign of reversal confirmation or potential obstacles that may invalidate the signal.
- Stop-Loss and Take-Profit Adjustment: As the trade progresses, you may consider adjusting your stop-loss level to protect potential returns. Similarly, you may consider adjusting your take-profit level if the price signals a strong uptrend.
Live Market Example
Let's consider an example of a bullish engulfing on the forex chart. The bullish engulfing candle in the example below is marked with 1 and 2. The trader sets the entry point above the green candle and a stop-loss level below it. The take profit is at the closest resistance level.
How Do Traders Confirm a Bullish Engulfing Candlestick Pattern?
Confirming this pattern enhances the reliability of its signals and helps traders make informed decisions. Here are key steps to confirm it:
- Volume Analysis: Traders typically look for increased buying trading volume accompanying the candle. Higher volume suggests stronger buyers’ interest and validates the reversal signal.
- Follow-Up Candlesticks: Waiting for subsequent closes can confirm the upward momentum. A series of higher closes strengthens its credibility.
- Support Levels: If it forms near a significant support level, this adds context to the reversal, as buyers are stepping in at a critical price point.
- Technical Indicators: Complementary indicators like the Relative Strength Index (RSI), Stochastic Oscillator, or a pair of moving averages can confirm the shift in sentiment.
- Market Context: Traders assess the overall market trend and news to ensure the formation aligns with broader market conditions.
Bullish Engulfing and Other Patterns
Let’s take a closer look at how this pattern compares to other chart formations, like the piercing and harami.
What Is the Difference Between a Bullish Engulfing and a Piercing Pattern?
A bullish engulfing pattern occurs when a large bearish bar is followed by a larger candlestick that completely overtakes the former's body. This indicates a strong potential reversal from a downtrend to an uptrend.
In contrast, a piercing formation also signals a potential reversal but is slightly weaker. It forms when a bearish candle is followed by a bullish candle that closes above its midpoint but doesn’t envelop it entirely.
What Is the Difference Between a Bullish Engulfing Pattern and a Bullish Harami Pattern?
The bullish harami pattern consists of a large red candle followed by a smaller green candle that is completely contained within the body of the red candle. This formation suggests a potential reversal but is generally considered less strong than the bullish engulfing candle pattern, as the latter completely envelops the previous bearish bar, showing more decisive buying pressure.
Final Thoughts
While this pattern offers valuable insights into potential trend reversals, it's essential to complement it with technical indicators and robust risk management for effective use. Also, be sure to explore other patterns as they may look very similar but provide different signals.
FAQ
What Is a Bullish Engulfing Pattern?
A bullish engulfing pattern is a two-candlestick formation in technical analysis that suggests a potential reversal from a downtrend to an uptrend. It occurs when a large bearish candlestick is followed by a larger bullish candlestick that completely engulfs the body of the preceding bearish candle.
How Reliable Is the Bullish Engulfing Pattern?
The reliability of the bullish engulfing pattern as a reversal signal depends on various factors, including the overall market context, confirmation from other technical indicators, and the timeframe being analysed. While it can be a strong indication of a potential trend reversal, it is not foolproof and should be used in conjunction with other tools and fundamental analysis.
What Is a Bullish Engulfing Candle Trading Strategy?
The bullish engulfing candle strategy involves identifying this pattern at the end of a downtrend as a signal for a potential sentiment shift. Traders typically enter a buy position slightly above the high of the closing bar, with stop-loss levels set below the low or beneath nearby support levels. Take-profit levels are determined based on risk/reward ratios or key resistance levels.
Do Wicks Matter in Engulfing Candlesticks?
Yes, wicks matter in the formation. The wicks provide insights into price rejection and volatility. For a strong confirmation, the absence of long upper wicks suggests sustained buying pressure, reinforcing its validity as a reversal signal.
*Important: At FXOpen UK, Cryptocurrency trading via CFDs is only available to our Professional clients. They are not available for trading by Retail clients. To find out more information about how this may affect you, please get in touch with our team.
This article represents the opinion of the Companies operating under the FXOpen brand only. It is not to be construed as an offer, solicitation, or recommendation with respect to products and services provided by the Companies operating under the FXOpen brand, nor is it to be considered financial advice.

Hammer Candlestick: Meaning and SignalsHammer Candlestick: Meaning and Signals
Technical analysis is a commonly used approach in the financial markets. It involves studying historical price data to make informed trading decisions. Among the various tools and formations employed in technical analysis, the hammer candlestick pattern stands out as a powerful tool. This article will delve into the meaning of the hammer candlestick pattern and explain how traders can interpret it on a forex, stock, and crypto* price chart.
What Is a Hammer Candle?
A hammer is a candlestick that is found on trading charts. It occurs at the end of a downtrend and acts as a bullish reversal signal.
To identify a bullish hammer candle on a price chart, traders do the following:
- Look for a significant downward movement: They begin by searching for a notable decline in an asset’s price.
- Observe the candle shape: The setup is characterised by a small body near the top of the candle and a long lower shadow. The lower shadow must be at least two times the length of the body. The colour of the candle doesn’t matter, but if it’s a green hammer candlestick, meaning it closed higher than it opened, the signal may be stronger.
- Analyse the context: Traders usually look for areas of support nearby as they may increase the setup's reliability.
Bullish Hammer Pattern: Trading Rules
Here are the common steps traders take when trading with a hammer:
- Confirm validity: Traders ensure that the hammer meets the criteria discussed earlier, such as a significant market decline followed by a candle with a small real body near the top and a large lower wick.
- Determine the entry point: Once the bullish hammer candlestick is confirmed, traders identify an appropriate entry point. Candlesticks don’t provide specific entry points. However, traders usually wait for the subsequent bar to close above and enter the trade if the market moves higher.
- Set stop-loss and take-profit levels: Traders place a stop-loss order below the low of the hammer to potentially limit risks. Traders determine a suitable take-profit level based on their trading approach, such as at the nearest resistance level or in accordance with the risk/reward ratio.
Trading Example
A trader spots a hammer on the hourly chart of the EURUSD pair. They wait for the candle to close above the hammer to enter the market. Their stop loss is below the hammer’s lower shadow, with the take profit calculated in accordance with the 1:2 risk/reward ratio.
How Can You Confirm the Hammer Candlestick?
Confirming the hammer candlestick pattern enhances the reliability of trading decisions. Beyond its basic identification, several techniques and indicators help validate its potential bullish reversal signal.
- Volume Analysis: A significant increase in trading volume during the formation of the hammer candlestick suggests stronger confirmation. Higher buying volume indicates heightened interest and participation, reinforcing the potential reversal.
- Support Levels: The presence of a strong support level near the hammer adds credibility to the pattern. Support levels act as psychological barriers where buying interest may increase, boosting the likelihood of a reversal.
- Subsequent Candlesticks: Observing the price action of the next few candlesticks after the hammer can provide further confirmation. A bullish candle closing above the high of the hammer enhances its validity.
-Double Hammer Pattern: While rare, a double hammer candlestick pattern where two candles appear consecutively can offer strong confirmation of a bullish movement.
- Trend Indicators: Utilising trend indicators like moving averages can help confirm the hammer. A rising moving average confirming the upward trend or a hammer forming in line with a broader trend adds weight to the potential reversal.
- Divergence: Identifying divergence between the price and momentum indicators, such as the Relative Strength Index (RSI) or Moving Average Convergence Divergence (MACD), can strengthen the pattern's reliability.
Hammer and Other Candlestick Patterns
Let’s compare the hammer to other candle formations you can spot on price charts.
Inverted Hammer
The inverted hammer is similar to the hammer but has a different appearance. It is characterised by a small body near the bottom of the candle and a long upper wick. The inverted hammer signals a potential bullish reversal as buyers start to gain strength and push the market up. The small body and small lower shadow reflect the rejection of lower prices, suggesting a shift in market sentiment from bearish to bullish.
Doji
In contrast to the red or green hammer candlestick pattern, the doji features a small real body with equal or close opening and closing prices and long upper and lower wicks. It represents market indecision, where neither buyers nor sellers have gained a clear advantage. While the hammer is potent during the downtrend, the doji can occur after both uptrends and downtrends, and it signals market consolidation or a potential trend reversal.
Shooting Star
The shooting star formation emerges at the top of an uptrend and suggests a potential bearish reversal. It is identified by a small real body near the bottom of the candle and a long upper wick, implying a rejection of higher prices and potential exhaustion of buying pressure.
Hanging Man
The hanging man emerges after an uptrend and suggests a potential bearish reversal. It resembles the hammer with a small real body near the top and a long lower wick, but the crucial difference is that it occurs in an uptrend. The hanging man implies that sellers are starting to exert influence, potentially leading to a reversal in the market.
Limitations of the Hammer Pattern
While the hammer is a valuable tool in technical analysis, it is not without its limitations.
- False Signals: It can sometimes produce false signals, leading to premature or incorrect trade entries. In certain market conditions, such as strong downtrends or highly volatile environments, the hammer may be less effective. Its success rate can vary across different assets and market scenarios.
- Dependence on Confirmation: The reliability of the hammer significantly depends on additional confirmation tools and indicators. Without these, alone it might not provide sufficient confidence for trading decisions.
- Short-Term Nature: The hammer primarily signals short-term price movements and typically can’t be used to anticipate medium or long-term price trends.
The Bottom Line
Successful implementation of the hammer formation requires experience, practice, and the use of additional technical analysis tools and indicators. Traders never rely solely on the hammer’s signals but integrate it into a comprehensive trading strategy.
FAQ
What Is a Hammer Candlestick?
A hammer is a specific setup found in charts that indicates a potential reversal to an uptrend. It is formed when a financial instrument opens at a certain price and experiences a significant decline during the trading period but eventually rallies back and closes near its opening price.
Is a Hammer Candlestick Pattern Bullish?
Yes, the hammer candlestick pattern is generally considered bullish. It signifies a potential trend reversal after a downtrend, as buyers enter the market and drive the price higher from its lows. The long lower shadow indicates that the buying pressure is strong and can potentially lead to further upward movement in the market.
Can a Hammer Candle Be Bearish?
A hammer candle is generally considered a bullish reversal signal, signalling a potential upward price movement after a downtrend. There is no bearish hammer. If the market continues to move lower after it forms, it just means that bearish market conditions were stronger and didn’t allow buyers to change market sentiment.
What Is the Hammer Candle Rule?
The hammer candle rule states that it must occur after a significant downtrend, have a small real body near the top of the candle, and feature a long lower shadow at least twice the length of the body. This pattern indicates a potential bullish reversal if confirmed by subsequent price action.
What Is the Hammer Strategy?
The hammer trading strategy involves identifying a candlestick at the end of a downtrend, confirming its validity with additional indicators or signals, and then entering a long position. Traders typically set stop-loss orders below the hammer's low and determine take-profit levels based on risk/reward ratios or nearby resistance levels.
*Important: At FXOpen UK, Cryptocurrency trading via CFDs is only available to our Professional clients. They are not available for trading by Retail clients. To find out more information about how this may affect you, please get in touch with our team.
This article represents the opinion of the Companies operating under the FXOpen brand only. It is not to be construed as an offer, solicitation, or recommendation with respect to products and services provided by the Companies operating under the FXOpen brand, nor is it to be considered financial advice.

Candlestick Patterns + Trend and Momentum: A Perfect CombinationCandlestick patterns provide valuable insights into price action, showing potential reversals, continuations, or market indecision. However, to significantly improve their effectiveness, combining candlestick analysis with trend and momentum indicators is essential. Here’s how you can use these combinations to trade with more confidence and accuracy.
1. Why Candlestick Patterns Matter
Candlestick patterns visually represent traders’ psychology through price movements, including four key prices: Open, Close, High, and Low. Some of the most common and useful patterns include:
Doji: Indicates market indecision and potential reversals.
Hammer & Hanging Man: Signals possible trend reversals at support or resistance.
Engulfing Pattern: Often marks the beginning of a significant reversal.
Morning/Evening Star: Combination patterns that strongly suggest a trend reversal.
2. Adding Trend and Momentum Indicators
Candlestick patterns alone might lead to false signals or confusion. By pairing them with other technical tools, such as moving averages, RSI (Relative Strength Index), or MACD (Moving Average Convergence Divergence), you gain crucial context to confirm the reliability of the patterns.
Here’s how:
Trend Alignment:
Using moving averages, such as the 20 or 50-period EMA, helps confirm whether a bullish candlestick pattern appears in an uptrend (strengthening the signal) or countertrend (potentially weaker signal).
Momentum Confirmation:
Oscillators like the RSI or MACD can confirm the underlying momentum behind a candlestick pattern. For instance, a bullish engulfing pattern becomes more reliable if it coincides with RSI moving upward from oversold territory or MACD showing a bullish crossover.
Volume Analysis:
Higher volume on the candle that forms the pattern typically confirms increased market interest and strengthens the validity of the signal.
3. Practical Example: Bullish Engulfing + RSI
Imagine you spot a bullish engulfing pattern forming at a clear support level after a downtrend:
Step 1: Identify the Pattern: Confirm the bullish engulfing visually.
Step 2: Check RSI: Ensure RSI is below 30 or rising, signaling oversold conditions and potential bullish momentum.
4. Why This Approach Works
Enhanced Accuracy: Combining candlestick signals with trend and momentum indicators increases signal reliability.
Improved Risk Management: Clearer signals mean more confident entries and better-defined stop-loss levels.
Reduces False Signals: Multiple confirmations reduce the risk of false breakouts or reversals.
5. Final Tips
Always look for multiple confirmations (trend, momentum, volume) before making trade decisions based solely on candlestick patterns.
Be patient—waiting for full confirmation can help avoid premature trades.
Regularly backtest and practice recognizing these combined signals to strengthen your trading strategy.

A Triple Top Pattern: Signals and StrategiesA Triple Top Pattern: Signals and Strategies
Traders are always on the lookout for reliable analysis tools that can help them make informed trading decisions. One such tool is the triple top trading pattern. It is a bearish reversal formation that can help traders identify potential trend reversals and take advantage of market opportunities.
In this FXOpen article, we will explore what the triple top pattern is, what it indicates, and how to identify it on price charts. Keep reading to find examples that will help you understand how to use it in a trading strategy.
What Is a Triple Top Pattern?
A triple top is a technical analysis pattern that signals a potential reversal in a trend. Is the triple top bullish or bearish? It’s a bearish formation. The pattern occurs when the price of an asset hits the same resistance level three times, failing to break above it on each occasion. This indicates that buyers are losing strength and sellers are starting to dominate the market. It is often seen after a sustained uptrend.
Identifying a triple top involves spotting three distinct peaks at roughly the same price level, separated by two troughs. The peaks are formed when the price hits resistance but fails to push through, while the troughs occur when the price retraces after each failed attempt.
To confirm a valid triple top, the peaks should be close in height, and the troughs should create a roughly horizontal neckline. The pattern is confirmed when the price breaks below the neckline, signalling that sellers have overtaken buyers.
Triple Top Chart Pattern Trading Strategy
Once traders have identified the triple top formation, they can use various trading strategies to take advantage of it. However, there are common rules that are used as the basis:
- Entry: Traders enter a short position when the price breaks below the neckline, which is the level that connects the two troughs that separate the peaks. This level is a critical support level, and when it is broken, it confirms the triple top candlestick pattern and indicates that the trend is reversing.
- Stop Loss: To manage risk, traders place a stop-loss order above the neckline. If the price starts to rise again, the stop-loss order will limit potential losses. The theory states that traders can place a stop-loss on the neckline. However, the price often retests the support level after a breakout, so the risk of an early exit rises.
- Take Profit: There are several ways of determining a profit target. The most common technique is to measure the distance between the tops and bottoms and subtract it from the triple top breakout point.
Another strategy is to identify the target based on the closest support levels. However, this may limit potential returns if the support is too close to the entry point. Therefore, traders sometimes use trailing stops to lock in potential profits as the price continues to fall.
Trading Example
In the chart above, the price formed the triple top. We could have entered a short position once the price broke below the neckline and closed it either at the point equal to the distance between the peaks and the neckline or at the closest support level, as the levels are almost equal. However, selling volumes were low (1) at the breakout level, so we could have expected an upcoming bullish reversal. Therefore, we wouldn’t have kept the position beyond the initial take-profit target.
How Traders Confirm the Triple Top
To confirm the triple top pattern and ensure its validity, traders use a combination of technical tools and indicators. These help confirm that the trend is indeed reversing and not just experiencing a temporary pullback. Here are the key methods traders use:
- Neckline Break. The most important confirmation comes when the price breaks below the neckline, which is the horizontal level connecting the lows between the peaks. A clean break suggests a stronger reversal.
- Volume Analysis. Volume plays a crucial role in confirming the triple top. Traders look for a surge in selling volume when the price breaks the neckline. If the volume is low during the breakout, the pattern may not be reliable, and a bullish reversal could follow.
- Momentum Indicators. Traders often use momentum indicators like the Stochastic Oscillator or Moving Average Convergence Divergence (MACD). When these indicators show bearish divergence, it signals a potential downward reversal. A negative crossover in the MACD or Stochastic adds further confirmation.
- Retest of Neckline. Sometimes, after breaking the neckline, the price may retrace and retest this level as resistance. A failed retest, where the price does not move back above the neckline, confirms that sellers are in control.
Triple Top vs Triple Bottom
It is important to distinguish between the triple top and the triple bottom chart patterns, as the former is the bearish setup, while the latter is a bullish reversal formation. The triple bottom setup forms when the price hits a particular support level three times and fails to break through it. It suggests that the sellers have lost their strength, and the buyers are starting to take control. The bottoms are separated by two peaks, which occur when the price retraces some of its gains from the support level.
Traders use the same principles to trade the triple bottom as they would the triple top but vice versa. They enter a long position when the price breaks above the neckline and set a stop-loss order below it. The take-profit target might equal the distance between bottoms and peaks or be set at the closest resistance level.
Triple Top Challenges
While the triple top pattern is a valuable tool for spotting reversals, it has its limitations. Traders should be aware of the following challenges:
- False Breakouts. The price may break below the neckline only to quickly reverse back, leading to a false signal. This can cause traders to enter losing positions if they act too quickly without further confirmation.
- Extended Sideways Movement. Sometimes, the price can stay near the neckline after a breakout, leading to indecision and uncertain market behaviour. This sideways movement can make it difficult to determine if the trend has truly reversed.
- Retests Leading to Reversals. After the initial breakout, the price may retest the neckline and move back above it, invalidating the triple top pattern. Traders need to be cautious and set appropriate stop-loss orders to help potentially mitigate risk.
Final Thoughts
The triple top pattern offers traders a powerful tool for identifying potential market reversals. However, it’s crucial to confirm the pattern and integrate it with other forms of analysis to avoid false signals. Ready to put these insights into action? Open an FXOpen account today, and trade with a broker offering tight spreads, low commissions, and advanced trading platforms.
FAQ
What Does a Triple Top Mean in Trading?
The triple top pattern meaning refers to a bearish reversal formation indicating a potential end to an uptrend. It forms when the price reaches the same resistance level three times without breaking through, suggesting weakening buying momentum and increasing selling pressure. This pattern signals that the asset's price may soon decline.
How Do You Confirm the Triple Top Pattern?
To confirm a triple top pattern, traders watch for a decisive break below the neckline, which connects the lows between the peaks. Increased trading volume during the breakout strengthens the confirmation, indicating strong seller interest. Technical indicators like the Stochastic Oscillator showing bearish divergence can provide additional validation.
Is a Triple Top Bullish?
No, a triple top is not bullish; it is a bearish reversal pattern. It signifies that the asset's price has repeatedly failed to surpass a resistance level, indicating diminishing upward momentum. Traders see this as a cue to consider short positions or to exit existing long positions.
Is a Triple Top Stronger Than a Double Top?
A triple top is generally considered stronger than a double top pattern because the price has failed to break resistance three times instead of two. This extra failed attempt reinforces the strength of the resistance level and increases the likelihood of a significant reversal. However, both patterns are important and should be analysed with other market factors.
This article represents the opinion of the Companies operating under the FXOpen brand only. It is not to be construed as an offer, solicitation, or recommendation with respect to products and services provided by the Companies operating under the FXOpen brand, nor is it to be considered financial advice.

How Can You Use a Spinning Top Candlestick Pattern in Trading?How Can You Use a Spinning Top Candlestick Pattern in Trading?
The spinning top candle is a key tool in technical analysis, highlighting moments of market indecision. This article explores what spinning tops represent, how they differ from similar patterns, and how traders can interpret them to refine their strategies across various market conditions.
What Does a Spinning Top Candlestick Mean?
A spinning top is a candlestick pattern frequently used in technical analysis. It consists of one candle with a small body and long upper and lower shadows of approximately equal length. The candle’s body symbolises the discrepancy between the opening and closing prices during a specified time period, while the shadows indicate that volatility was high and neither bulls nor bears could take control of the market.
This pattern signifies market indecision, where neither buyers nor sellers have gained dominance. It suggests a state of equilibrium between supply and demand, with the price oscillating within a narrow range. The spinning top may indicate continued sideways movement, particularly if it appears within an established range. However, if it forms after a bullish or bearish trend, it could signal a potential price reversal. Traders always look for additional signals from confirming patterns or indicators to determine the possible market direction.
It’s important to note that the spinning top candle is neutral and can be either bullish or bearish depending on its context within the price chart. The colour of the candle is not important.
Spinning Top vs Doji
Doji and spinning top candlesticks can be confused as they have similar characteristics. However, the latter has a small body and upper and lower shadows of approximately equal lengths. It indicates market indecision, suggesting a balance between buyers and sellers without a clear dominant force. Traders interpret it as a potential reversal signal, reflecting a possible change in the prevailing trend.
The doji candlestick, on the other hand, has a small body, where the opening and closing prices are very close or equal, resulting in a cross-like shape. If it’s a long-legged doji, it may also have long upper and lower shadows. A doji candle also represents market indecision but with a focus on the relationship between the opening and closing prices. Doji patterns indicate that buyers and sellers are in equilibrium, and a potential trend reversal or continuation may occur.
How Do Traders Use the Spinning Top Pattern?
Traders often incorporate the spinning top candle pattern into their analysis as a way to interpret moments of market indecision. Whether the pattern appears during a trend or at key turning points, its context plays a significant role in shaping trading decisions.
In the Middle of a Trend
When a spinning top forms in the middle of an ongoing trend, traders often view it as a signal of potential market hesitation. This indecision can indicate a pause in momentum, suggesting either a continuation of the trend or the possibility of a reversal.
Entry
In such cases, traders typically wait for confirmation of the next price move. A break above the high of the spinning top may signal the trend will continue upward, while a break below the low could suggest the trend may move down. Observing how subsequent candles interact with the spinning top can help a trader gauge the market’s intentions.
Take Profit
Profit targets might be aligned with key price levels visible on the chart, such as recent highs or lows. For traders expecting trend continuation, these targets might extend further, while those anticipating a reversal might aim for closer levels.
Stop Loss
Stop-loss orders might be set in accordance with the risk-reward ratio. This placement helps account for the pattern's characteristic volatility while potentially protecting against unexpected movements.
At the Top or Bottom of a Trend
When a spinning top forms at a significant peak or trough, it often draws attention as a potential reversal signal. This appearance may reflect market uncertainty after a prolonged uptrend or downtrend.
Entry
Confirmation from subsequent price action is critical. Traders typically observe if the price breaks above the candle (bullish spinning top) or below the candle (bearish spinning top) to determine the likelihood of a reversal.
Take Profit
Targets could be set at major support or resistance zones. A trader expecting a reversal may look for levels reached during the previous trend.
Stop Loss
Stops could be placed in accordance with the risk-reward ratio, allowing for the volatility often present at trend-turning points while potentially mitigating losses.
Remember, trading decisions should not solely rely on this formation. It's crucial to consider additional technical indicators, market trends, and risk management principles when executing trades.
Live Example
In the EURUSD chart above, the red spinning top candle appears at the bottom of a downtrend. A trader went long on the closing of the bullish candle that followed the spinning top. A take-profit target was placed at the closest resistance level, and a stop-loss was placed below the low of the spinning top candlestick.
There is another bearish spinning top candlestick pattern on the right. It formed in a solid downtrend; therefore, a trader could use it as a signal of a trend continuation and open a sell position after the next candle closed below the lower shadow of the spinning top candle.
A Spinning Top Candle: Benefits and Drawbacks
The spinning top candlestick pattern offers valuable insights into market indecision, but like any tool in technical analysis, it has its strengths and limitations. Understanding these might help traders use it more effectively.
Benefits
- Identifies Market Indecision: Highlights moments where neither buyers nor sellers dominate, providing a clue about potential price reversals or continuations.
- Versatile Across Trends and Markets: Can signal price consolidation, continuation, or reversal depending on its context. It’s also possible to use the spinning top across stocks, currencies, and commodities.
- Quick Visual Insight: The distinctive shape makes it easy to spot on charts without extensive analysis.
Drawbacks
- Requires Confirmation: On its own, the pattern lacks particular signals, needing additional indicators or price action for confirmation.
- Context-Dependent: Its reliability depends heavily on where it forms in the trend, making it less useful in isolation.
- Prone to False Signals: Market noise can produce spinning tops that do not lead to meaningful movements, increasing the risk of misinterpretation.
Takeaway
The spinning top candlestick reflects market indecision and suggests a potential reversal or consolidation. Traders use this pattern as a tool to identify areas of uncertainty in the market. Therefore, it's important to consider the spinning top pattern within the broader context and get confirmation from other analysis tools.
If you want to test your spinning top candlestick trading strategy or apply it to a live chart, open an FXOpen account and start trading with tight spreads from 0.0 pips and low commissions from $1.50. Good luck!
FAQ
What Is a Black Spinning Top?
A black (red) spinning top is a variation of the spinning top candlestick pattern with a small body and equal-length shadows. This is different from the white (green) spinning top, as its body indicates a lower closing price. Traders analyse its context, technical factors, and confirmation from other indicators to interpret its significance.
What Is a Spinning Top Candlestick?
A spinning top candle meaning refers to a pattern characterised by a small body and long upper and lower shadows of roughly equal length. It reflects market indecision, where neither buyers nor sellers hold a clear advantage, and is often used in technical analysis to assess potential trend reversals or consolidations.
Is the Spinning Top Bullish or Bearish?
The spinning top candlestick pattern is neutral by nature. Its significance depends on the context within the price chart. When it appears at the end of an uptrend, it may signal a bearish sentiment, while at the end of a downtrend, it can indicate a potential bullish reversal.
What Does a Spinning Top Candle Indicate?
This pattern indicates a period of indecision and balance between buying and selling pressure. Depending on its position within a trend, it can signal consolidation, continuation, or a reversal in price direction.
What Is the Spinning Top Rule?
There is no fixed "rule" for spinning top trading. Traders typically look for confirmation from subsequent price movements or other technical indicators to decide on a course of action.
Is Spinning Top a Doji?
Although similar, spinning tops and doji candles differ. A spinning top has a small body with visible discrepancies between opening and closing prices, whereas a doji’s body is almost non-existent.
Trade on TradingView with FXOpen. Consider opening an account and access over 700 markets with tight spreads from 0.0 pips and low commissions from $1.50 per lot.
This article represents the opinion of the Companies operating under the FXOpen brand only. It is not to be construed as an offer, solicitation, or recommendation with respect to products and services provided by the Companies operating under the FXOpen brand, nor is it to be considered financial advice.

The Three Black Crows Pattern: Trading PrinciplesThe Three Black Crows Pattern: Trading Principles
Various candlestick and chart patterns indicate potential market reversals. One such formation is the three black crows pattern that indicates a potential bearish reversal in the price of an asset. You can find three black crows stock, commodity, and forex patterns. This FXOpen article will help you understand how such a pattern is formed, explaining how it can be used to spot trading opportunities in the market and demonstrating live trading examples.
What Are the Three Black Crows?
The three black crows is a bearish candlestick pattern used in technical analysis to signal a potential reversal of an uptrend. It consists of three consecutive long bearish candlesticks that occur after a strong upward trend. The pattern suggests that the momentum has shifted from buyers to sellers, indicating that a downtrend could be about to begin.
Key Characteristics:
- Three Consecutive Bearish Candles: The pattern is composed of three long bearish candlesticks that open within the body of the previous candle and close near their lows.
- Appears After an Uptrend: The pattern typically forms after a prolonged uptrend, signalling a potential shift in market sentiment.
- Declining Price with Minimal Wicks: The candles should ideally have small upper and lower wicks, showing that the sellers controlled the market throughout the session.
- Steady Decline: Each candlestick in the pattern opens higher than the previous candle’s close but then reverses to close lower.
Psychological Interpretation
The pattern reflects a growing bearish sentiment among traders. Each successive bearish candlestick suggests that sellers are taking over, and buying pressure is weakening. This gradual increase in selling activity is often interpreted as a sign that the market could be heading for a downturn.
How Can You Trade the Three Black Crows Chart Pattern?
The three black crows formation has general trading rules. They can be modified depending on the timeframe, market volatility, and risk tolerance.
Entry
Once the formation is confirmed with the third long red candle and additional indicators, traders enter a short position below its low.
Take Profit
The pattern doesn’t provide specific take-profit targets. Usually, traders use other technical indicators and strong support levels to determine a suitable take-profit point. Some traders set the take-profit order with regard to the risk-reward ratio, say 1:2 or 1:3.
Stop Loss
The theory states that a stop-loss order can be placed above the first candlestick’s high to potentially limit losses. Moreover, it should be based on the trader's risk tolerance and trading approach.
Live Market Example
The above example shows the formation of the three black crows’ pattern on a weekly chart of the EUR/USD pair. When the pattern formed, the relative strength index had just left the overbought zone, confirming a potential trend reversal. A trader could go short after the third long bearish candle at 1.42550 and place a stop loss near above the first pattern’s candle (at 1.51763). The profit target could be set at the next important support level of 1.23378. It took six months for the price to reach the target level.
Practical Trading Strategies Using the Three Black Crows Pattern
Now, let’s look at two specific 3 black crows trading strategies.
MACD Strategy
The combination of the three black crows candlestick pattern and the MACD crossover offers traders a strong signal of a bearish reversal after a bullish movement. The three black crows formation suggests weakening bullish momentum, while the MACD crossover confirms the shift in momentum from buyers to sellers. Together, these indicators increase the likelihood of a sustained downtrend, offering an opportunity for traders to enter the market with greater confidence.
Entry
- Traders observe a bearish MACD crossover within a few candles of the three black crows, either just before, during, or just after.
- Both conditions (pattern completion and MACD crossover) are typically met by the close of the third candle, signalling a potential opportunity for a sell trade.
Stop Loss
- Stop losses might be placed just beyond the swing point before the three black crows pattern to potentially protect against false signals.
Take Profit
- Traders often set take-profit targets at a risk-reward ratio, such as 1:2 or 1:3, to lock in potential returns.
- Alternatively, profits might be taken at key support levels where the price may reverse.
- Another option might be to exit the trade upon observing a bullish MACD crossover, signalling the end of the downtrend.
HMA Strategy
Using two hull moving averages (HMA), one set to 20 and the other to 50, provides traders with an extra filter to confirm that a downtrend is beginning following the three black crows pattern. The three black crows indicate a potential bearish reversal, but a cross of the 20-period HMA below the 50-period HMA helps confirm the strength of the downtrend. HMAs are used as they are more responsive to trend shifts than other moving averages.
Entry
- Traders look for a bearish crossover where the 20 HMA crosses below the 50 HMA within a few candles of the three black crows.
- Both the pattern and the HMA crossover typically confirm the start of a downtrend, allowing traders to enter a short position.
Stop Loss
- Stop losses might be set just above the swing high before the pattern.
- Alternatively, they might be placed above one of the HMAs, depending on the trader’s risk tolerance and desired level of protection.
Take Profit
- Take-profit targets might be based on a risk-reward ratio, such as 1:2 or 1:3.
- Traders may also take profits at a known support level where price reversal is likely.
- Another potential exit point is when the HMAs cross over again, signalling the end of the trend.
Three Black Crows vs Three White Soldiers
The three white soldiers candlestick pattern is the opposite of the three black crows. It is a bullish reversal setup that traders commonly use to identify the potential end of a prior downtrend and the start of an uptrend. It consists of three consecutive long bullish candlesticks with highs and lows higher than the previous ones and with little or no wicks. It suggests that the buyers have taken control of the market and that the price will likely continue rising. The candles together create a formation that resembles three soldiers marching in a bullish direction.
This formation is usually considered a strong bullish signal when it appears after a prolonged downtrend, in contrast to the three black crows formation, which indicates a strong potential bearish reversal. Traders often use it as an indication to enter long positions, with a stop-loss order placed near the bottom of the pattern.
Confirmation Tools
Confirmation tools can help traders ensure that the 3 black crows candlestick pattern signals a true bearish reversal rather than a short-term pullback. Here are some key tools to consider when confirming the pattern:
- Volume Increase: A spike in selling volume during the formation of the three black crows can confirm heightened pressure and a stronger likelihood of a trend reversal.
- Momentum Indicators: Tools like the Relative Strength Index (RSI), MACD, or a Stochastic Oscillator can show a shift in momentum. An overbought RSI, a bearish MACD crossover, or bearish Stochastic divergence may reinforce the bearish signal.
- Support Level Break: Watch for a break below a key support level after the three black crows form. This can further validate the downtrend, indicating that sellers are gaining control.
- Bearish Candlestick Patterns: Additional bearish patterns, such as engulfing or dark cloud cover, emerging after the three black crows, can reinforce the likelihood of a sustained downtrend.
- Moving Averages: A cross of a short-term MA below a long-term MA can offer further confirmation of a bearish reversal.
Common Mistakes When Trading the Three Black Crows Pattern
In 3 black crows trading, it's common to make several mistakes that may lead to poor results or false signals. Here are key pitfalls to watch out for:
- Ignoring Volume: Failing to check for a rise in volume during the formation of the three black crows can lead to misinterpreting the pattern. Low volume may indicate weak selling pressure and an unreliable signal.
- Trading Without Confirmation: Jumping into a trade as soon as the pattern forms without using additional confirmation tools like momentum indicators or support breaks can increase the risk of a false reversal.
- Overlooking Market Context: The three crows candlestick pattern works in specific conditions. If the pattern appears in a sideways or range-bound market, it may not signal a true trend reversal, leading to misinterpretation.
- Setting Tight Stop-Losses: Placing stop-loss orders too close to the first candlestick’s high can result in early exit due to market noise. Proper risk management with room for fluctuations is essential.
- Neglecting Trend Strength: Ignoring the strength of the prior uptrend may lead to premature trades. The pattern is believed to be the most effective after a prolonged uptrend; using it in weak trends can result in false signals.
Final Thoughts
The three black crows pattern is a powerful bearish reversal signal that can help traders identify potential downtrends after a sustained uptrend. By understanding its formation, confirming the pattern with additional technical indicators, and implementing sound risk management strategies, traders can incorporate this pattern into their trading plans. However, as with any trading strategy, patience and proper confirmation are key to avoiding false signals.
Once you have practised identifying the black crows, consider opening an FXOpen account to start your trading journey!
FAQ
What Do 3 Black Crows Mean in Trading?
The 3 black crows’ meaning refers to a candlestick pattern signalling a bearish reversal. It consists of three consecutive long bearish candlesticks following an uptrend, indicating that sellers are taking control of the market. This pattern suggests a potential shift in momentum from bullish to bearish, meaning the price is likely to decline further as selling pressure increases.
What Do Three Black Crows Indicate?
The 3 black crows’ candlestick formation, after a prolonged uptrend, indicates a potential downside reversal. It means that sellers are taking control, and the price will likely trade downwards.
What Is the Success Rate of the 3 Black Crows?
The success rate of the three black crows pattern varies depending on market conditions, timeframe, and confirmation tools used. While it is generally considered a reliable bearish reversal signal, traders often use volume, momentum indicators, and support level breaks to confirm the pattern and improve success rates.
What Is the Meaning of Identical Three Crows?
The identical three crows is a variation of the traditional pattern. In this case, the three bearish candles open at the close of the previous candlestick, showing even stronger bearish pressure. This variation suggests that sellers are overwhelming buyers consistently, signalling an even more pronounced reversal.
How Do You Trade Three Black Crows?
To trade the 3 black crows pattern, traders wait for confirmation of a bearish reversal after the three consecutive down candles in an uptrend. They enter a short position once the pattern is completed and confirmed by additional indicators like increased volume or a break below support. They may place a stop-loss order above the high of the first candle and target key support levels below for profit-taking. Traders always manage risk carefully by using stop-losses and monitoring market conditions.
Are Three Black Crows Bullish?
No, the three black crows pattern is not bullish; it is a bearish candlestick pattern. It signals a potential reversal from an uptrend to a downtrend, indicating that selling pressure is starting to overwhelm buying pressure.
Trade on TradingView with FXOpen. Consider opening an account and access over 700 markets with tight spreads from 0.0 pips and low commissions from $1.50 per lot.
This article represents the opinion of the Companies operating under the FXOpen brand only. It is not to be construed as an offer, solicitation, or recommendation with respect to products and services provided by the Companies operating under the FXOpen brand, nor is it to be considered financial advice.

Shooting Star Pattern: Meaning and Trading RulesShooting Star Pattern: Meaning and Trading Rules
In the fast-paced world of trading, recognising key chart patterns is crucial for informed decision-making. One pattern that traders often look for is the shooting star trading pattern. This article will delve into what a shooting star pattern is, how to spot it on a chart, its associated trading strategies, and its distinctions from similar patterns.
What Is a Shooting Star?
A shooting star in trading is a bearish candlestick pattern that can signify a potential reversal of an uptrend. It consists of a single candlestick with the following characteristics:
- A small body that is located at the lower end of the candlestick.
- A long upper shadow that is at least twice the length of the candle's body.
- A short or nonexistent lower shadow.
The appearance of the setup suggests that the price opened near its low and rallied significantly during the trading session but ultimately closed near its opening price. This pattern indicates sellers regained control after a brief period of bullishness.
While the formation is considered more probable when it closes red, it’s possible to see a green shooting star. A green shooting star candlestick simply indicates that sellers weren’t able to push the price down quite as aggressively.
How Can You Trade the Shooting Star?
The shooting star trading strategy involves the following key points:
- Entry: After identifying the candle in the strong uptrend, consider entering a short position. To validate the pattern, you may wait for the next one or two candles to close below the shooting star.
- Take Profit: Although candlestick patterns don’t provide specific entry and exit points, you can use common technical analysis techniques. For example, you may set a take-profit level based on the support level, Fibonacci retracement level, or nearest swing lows.
- Stop Loss: You may want to protect your position with a stop-loss order. This is usually placed above the high price of the shooting star. This helps potentially limit losses if the pattern doesn't lead to a reversal.
Let's consider a live market example of a shooting star in the stock market to illustrate the concept. A trader analyses the Meta stock chart and spots a shooting star stock pattern after an extended uptrend. They wait for confirmation, i.e. for the next bar to close lower. Upon confirmation, they decide to enter a short trade, setting their take-profit target at a significant support level and placing a stop loss above the formation’s high.
How Traders Confirm the Shooting Star Signals
Confirming the shooting star pattern's reliability involves a multifaceted approach, adding robustness to your trading decisions. Traders look beyond the candlestick itself, integrating various technical analysis tools to validate signals.
Key confirmation methods include:
- Volume Analysis: A high trading volume accompanying the shooting star candlestick pattern can strengthen the signal, indicating that the reversal is supported by significant market participation.
- Subsequent Candles: Observing the next few candles for bearish confirmation is essential. A strong bearish candle following the shooting star suggests that sellers are gaining momentum.
- Technical Indicators: Indicators can offer confirmatory signals, particularly momentum indicators like the Relative Strength Index (RSI) and Stochastic Oscillator. A moving average crossover can also add confluence.
- Support and Resistance Levels: The proximity of the shooting star to established resistance levels enhances its significance. A shooting star forming near a resistance zone often signals a strong reversal point.
- Above Swing High/Low: A shooting star pattern that breaks into the area just above a key high or low before reversing can signal a stop hunt/liquidity grab.
- Contextual Analysis: The broader market context, such as prevailing trends and economic news, can influence the pattern's effectiveness. Aligning the shooting star with broader market sentiment increases the pattern’s reliability.
Shooting Star and Other Candlestick Formations
Let's compare the shooting star with other patterns with which it is often confused.
Shooting Star vs Inverted Hammer
The shooting star and inverted hammer look similar – they have small bodies and long upper shadows. However, they differ in their implications. The former is a bearish reversal pattern found in uptrends, while the latter is a bullish reversal formation seen in downtrends.
Shooting Star vs Evening Star
Both formations signal an uptrend reversal; however, the shooting star is a single-candle setup, whereas the evening star consists of three candles, including a large bullish candle, a small-bodied candle, and a large bearish candle.
Shooting Star vs Gravestone Doji
The shooting star and gravestone doji are both bearish reversal patterns. The shooting star features a small body at the lower end of the candlestick with a long upper shadow, signifying a failed rally.
In contrast, the gravestone doji has no or a tiny real body, as the open and close prices are identical or nearly identical, with a long upper shadow and no lower shadow. The gravestone doji suggests strong indecision in the market, with buyers initially driving prices up but ultimately failing to maintain that momentum, which often signals a sharp reversal.
Shooting Star vs Hanging Man
The shooting star and hanging man also share similarities but differ in appearance and market positioning. The shooting star is a bearish pattern occurring after an uptrend, indicating a potential reversal as bears managed to pull the price down at the end of a trading session.
Conversely, the hanging man appears at the top of an uptrend as well but has a small body at the upper end and a long lower shadow, reflecting that sellers were able to push the price down significantly before buyers pulled it back up. The hanging man suggests that selling pressure is starting to outweigh buying interest.
Advantages and Limitations
This formation offers traders valuable insights, but it comes with its own set of advantages and limitations. Understanding these can help traders use the pattern more effectively within their strategies.
Advantages
- Early Reversal Signal: It provides an early indication of a potential trend reversal, allowing traders to prepare for or act on a change in market direction.
- Simplicity: The pattern is straightforward to identify, even for less experienced traders, making it an accessible tool for technical analysis.
- Versatility: It can be applied across various markets and timeframes, with traders often spotting the shooting star in forex, stock, and commodity markets as well as across both short-term and long-term charts.
Limitations
- False Signals: The pattern alone is not always reliable and can generate false signals, especially in volatile markets or when not used with other confirmation tools.
- Lack of Precision: It does not provide exact entry or exit points, requiring traders to rely on additional indicators or analysis to determine these.
- Dependency on Context: The effectiveness of the formation is highly dependent on the broader market context and trend strength, limiting its standalone use.
Final Thoughts
Understanding chart patterns like the shooting star is essential for making informed decisions in trading. Remember that while this formation can provide valuable insights, it is more effective in conjunction with other tools for signal confirmation. As a trader, staying informed about market developments and continuously honing your skills could be a key to effective trading in the dynamic trading environment. Open an FXOpen account today to trade in over 600 markets with tight spreads from 0.0 pips.
FAQ
Can Candlestick Patterns Be Time-Sensitive?
Yes, candlestick patterns vary depending on the timeframe. A shooting star on a 1-minute chart provides short-term signals, while a shooting star on a daily chart may signal a longer-term reversal. However, the choice of timeframe goes hand in hand with your market strategy and goals.
How to Improve Candlestick Pattern Recognition Skills?
Improving your candlestick pattern recognition skills requires practice and study. You can analyse historical charts, use trading simulators, read educational materials like those at FXOpen, and engage with experienced traders to gain insights and practical experience.
Why Are Candlestick Patterns Important in Trading?
Candlesticks visually represent price action and help traders identify potential trend reversals, continuations, and key support and resistance levels. They are valuable tools for technical analysis.
What Is the Meaning of a Shooting Star Pattern?
The shooting star pattern is a bearish reversal candlestick that forms after an uptrend. It signals a potential shift in market sentiment, where buyers initially drive the price higher, but sellers take over, pushing the price back down near its opening level.
Is a Shooting Star Candlestick Bullish?
No, a bullish shooting star does not exist. It is a bearish pattern, indicating that an uptrend may be losing momentum and that a reversal to the downside could be imminent. A similar bullish formation is the inverted hammer.
Is a Shooting Star a Doji?
A shooting star is not a doji. While both patterns can signal reversals, a doji has nearly identical opening and closing prices with no significant body, reflecting indecision, whereas a shooting star has a small body with a long upper shadow, indicating a failed rally.
How Can You Trade a Shooting Star Candle?
Trading this candle involves looking for confirmation of the reversal, such as a bearish candle following the pattern. Traders often set stop-loss orders above the shooting star's high and target profit levels near key support zones or previous lows.
Trade on TradingView with FXOpen. Consider opening an account and access over 700 markets with tight spreads from 0.0 pips and low commissions from $1.50 per lot.
This article represents the opinion of the Companies operating under the FXOpen brand only. It is not to be construed as an offer, solicitation, or recommendation with respect to products and services provided by the Companies operating under the FXOpen brand, nor is it to be considered financial advice.
