BITCOIN – THE REAL REASON BEHIND THE FALLWhen I started trading someone told me something I’ll never forget: “If you can predict tomorrow’s newspaper headline, you understand the market.”
He didn’t mean I should chase news. He meant I should read structure so well that I know what kind of headline the market is already writing, before the mass even see it.
And now, looking around online, I see the complete opposite. Everywhere you look, there’s another “confluencer” talking about crypto with big words and zero understanding.
People selling dreams, memberships, and indicators, while they don’t even know what open interest or CVD means.
I’m not here to sell anything. I’m here to help people actually learn how to read data and see through the noise. Because what most of these so-called experts call “analysis” is just emotional guessing wrapped in confidence.
What I called and what happened
Last week I posted my “Big Dump” thesis.
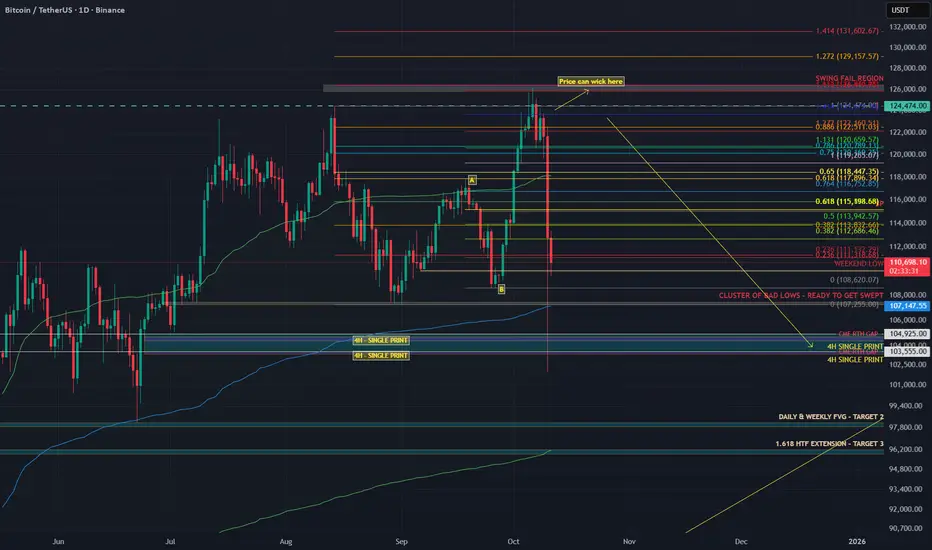
I said Bitcoin would swing fail above the highs, then drop into the 104K region. That is exactly what happened.
Price ran the sweep into 126K, trapped the late buyers, and dumped straight into 104K.
People blamed tariffs. The tariff headline was the spark. The fuel was crypto’s own positioning.
Why the structure was ready to snap
Before the crash, the data told the story clearly.
Stablecoin OI went from 257K to 285K contracts (+10.9%). That is new leveraged exposure.
Coin-margined OI dropped during the breakout, then rose again near the highs. Shorts were fading strength.
Spot CVD stayed flat to slightly negative. Real buyers were missing.
The long/short ratio fell from 2.05 to 1.02 even while price kept climbing.
That’s what distribution looks like. Buyers on leverage pushing price up while stronger hands sell into them. No real spot demand, just futures exposure.
You don’t need a macro event to fall. You only need a reason for those leveraged buyers to stop bidding. Think of it like a crowded elevator. Everyone keeps piling in as it moves up, feeling safe because it hasn’t stopped yet. But the moment one person hesitates, the weight shifts. When the next person panics, the whole thing drops.
That’s what happens when a market is driven by leverage instead of conviction. You don’t need bad news, you just need hesitation.
Look back at similar events.
In May 2021, funding rates were insane, perps overloaded, and spot volume thin. Elon Musk tweeted about Bitcoin’s energy use. That tweet didn’t cause the dump. It just made leveraged longs pause. The bids disappeared and the cascade started.
In August 2023, Evergrande headlines hit. Bitcoin was sitting at resistance with flat spot CVD and rising OI. Equities wobbled, crypto longs hesitated, and the structure collapsed within hours.
In March 2020, when COVID panic hit, Bitcoin had already been stretched thin. Funding was high, leverage was heavy, and liquidity was weak. The virus didn’t break the market, leverage did.
Leverage creates confidence until it doesn’t. Price doesn’t fall because people start selling. It falls because nobody steps in to buy. Headlines decide when the drop starts. Structure decides how far it goes.
Why 104K was my first target
I didn’t pick 104K out of thin air. That level was built on confluence.
1) AVWAP from the April 7 auction
That swing low kicked off with massive volume. When a move starts with that kind of participation, the anchored VWAP becomes a key reference for institutional flow. It represents the average cost of that whole auction, and when extended forward, it acts as a dynamic area where liquidity and algorithms interact.
That blue AVWAP line from April has been running right through the 104K region.
It’s not that price revisited that auction, it’s that the anchored VWAP from that event still marks the fair value area for that entire move.When price traded back down into that region, it met that same volume-weighted anchor, creating a major confluence zone that algos and larger players watch closely.
2) The June 22 breakout left an LVN
A new auction started on June 22 and pushed higher, leaving a Low Volume Node behind.
An LVN is a thin zone on the volume profile where the market moved quickly with little trade.
Markets often revisit these thin areas later to find balance or test unfinished business.
3) HTF Fibonacci cluster
Multiple higher timeframe Fibonacci retracements and extensions overlapped near the same 104K area. When several fib levels align with structure, that’s a strong confluence zone watched by both human traders and algorithms.
The 104K region was where the AVWAP line, LVN, and fib cluster all met. That’s not a random target. It’s a structurally defined area where liquidity concentrates and where markets tend to react sharply. And that’s exactly what happened.
The spark versus the structure
The tariff headline didn’t cause the drop. It triggered it.
The structure was already unstable. Leverage was maxed. Spot demand was flat. Funding was positive and rising. When the tariff news hit, traditional markets pulled back and crypto followed instantly. It wasn’t correlation, it was liquidity contagion.
Traders managing multiple books de-risk across assets when volatility spikes. That creates a gap in liquidity. When the bids vanish, the market falls into the first real pool of resting orders — in this case, the 104K zone.
You saw the same mechanics during the March 2020 crash and the 2021 deleverage. External shocks trigger internal liquidation cascades. That’s why saying “this had nothing to do with crypto is completely wrong.
This had everything to do with crypto. It’s like blaming the thunder for breaking a window when the glass was already cracked. Or saying the iceberg sank the Titanic when the captain was already steering through a sea of warnings.
Crypto was structurally weak. Leverage was stretched, spot demand was gone, and funding was positive. When the headline hit, it didn’t cause the collapse. It just gave the market permission to do what it was already set up to do — unwind.
Crypto is built on leverage.
Perpetual futures dominate volume.
Stablecoin collateral drives exposure.
When external risk events change funding conditions or risk appetite, the crypto market reacts instantly because its structure is fragile by design.
Example:
When yields spike, the dollar strengthens and funding costs rise. Leveraged longs become more expensive to hold, so traders unwind positions.
When equities dump, cross-asset desks reduce risk globally, which pulls liquidity out of crypto perps too.
Intermarket correlation always matters. Macro sets the mood. But the speed and violence of crypto moves always come from leverage inside the system.
How you can spot it next time
Compare Spot CVD vs Stablecoin CVD. If stablecoin CVD rises while spot stays flat or negative, the rally is leverage-driven.
Track Open Interest vs Price. Both rising together usually means exposure is building. Confirm with spot flow.
Watch the Long/Short ratio. If it drops while price rises, shorts are entering and the move may be getting absorbed.
Anchor VWAPs to real pivots like swing lows, breakouts, or liquidation spikes. Those levels attract institutional flow.
Study Volume Profiles. LVNs are thin and often retested. HVNs are balance zones that attract price.
Map HTF fib clusters for confluence. Reactions are stronger when multiple timeframes agree.
Note single prints and thin brackets on TPO or volume profiles. These often act as magnets.
When these factors line up, you don’t need to predict headlines.
You’ll already most likely know which headline will break the market.
TLDR
The rally was leverage-driven: Stablecoin OI up 10.9%, Spot CVD flat, Long/Short ratio down from 2.05 to 1.02
The swing fail at 126K was the final liquidity grab
104K was the target due to AVWAP + LVN + HTF fib cluster
The tariff headline was the spark, not the cause
The crash was caused by leverage and missing spot demand
Crypto didn’t fall because of politics. It fell because the market was already begging for an excuse to reset.
The data showed it clearly weeks before the drop.
If this helped you see the market a little clearer or made you think differently about how price really moves, please leave a like and drop a reaction. It keeps me motivated to keep posting real analysis, not the copy-paste bullshit hype that floods your feed every day.
Check the Order Flow Data from 6 October here: ibb.co
Dump
What on Earth Is a Circuit Breaker?!Every couple of days since April 2nd, everybody's been talking about a stock market halt all day. You're left there trying to Google it so you're not the only person in the group chat who doesn't know what's going on. But actually, nobody else in your group chat knows what's going on either. They're low-key Googling it under the desk. You don't have to know everything in the market to be a "seasoned" trader. What does get disappointing is when people guess instead of providing facts or a direct link to an article about market halts.
So, this is your quick-but-detailed-read article/ guide to market halts and circuit breakers. Send it to your friends in that group chat. Why today's dump happened in the first place? More on that later. It's a long story. 🥹
What is a circuit breaker?
It's simple: a circuit breaker is a 15 minute OR whole-day market-wide HALT when the market reaches 1 of 3 decline levels. It all depends on the level, how fast the decline is, and potentially other factors that we are not aware of. Keep in mind this is not something we have to deal with often.
When does it happen? And what stock does it track?
Good question. The halt is triggered following declines in the S&P 500 only . That is: AMEX:SPY SP:SPX $CME_MINI:ES1!.
If these level 1 & 2 are reached before 3:25 PM EDT , there is a 15 minute market-wide trading halt. Meaning you cannot enter or exit positions. If level 3 is reached at any time in the day, the entire day's trading will come to an end.
Level 1: -7.00% | 15 minute halt
Level 2: -13.00% | 15 minute halt
Level 3: -20.00% | Entire day halt
So when the S&P 500 index reaches -6.98%, be sure a halt is coming very soon at -7.00%. Sure, like today, "they" might pump it and use that as support and prevent a halt (we got very close to -6.35% on CME_MINI:ES1! if I'm not mistaken). But it's good to be vigilant and make sure you're not in any daytrades.
Does CME_MINI:NQ1! NASDAQ:QQQ CBOT_MINI:YM1! trigger the halt also?
No. The halt is only triggered by the S&P 500. The Nasdaq Composite famously moves much more than S&P 500, so a 7% drop in S&P is way more dramatic than a 7% drop in Nasdaq and it's highly likely at -7% in S&P that Nasdaq would be at -8% or -9%. Although, both are undoubtedly decimating for any long positions.
Why does this rule exist?
This was introduced after Black Monday of 1987 where the market was free falling ( DJ:DJI dropped 22.6%) with no safety stops in place to prevent a market-wide disaster. This prevents further panic selling and massive stop loss raids, and also gives institutional traders time to zoom out and see the bigger picture.
How close did we get recently?
Today we got within 0.7% of getting a 15 minute halt.
See for yourself:
And the intraday 15 minute chart:
FUN FACT: What if I shorted the top on CME_MINI:ES1! ?
Assuming your time machine goes back 24 hours (some time machines only go back 10 years minimum), you'd have booked 1500 ticks at $12.50 per tick. So around $19k per contract. You know that's not too bad. It's almost a Toyota Camry per contract. Do better! 😆
How do I trade this?
Do you really have to? Please do not FOMO & catch a falling knife. Trade light. The market is open for the rest of the year. Trade with a stop loss, and remember, if you FOMO'd and bought at -3% just because it's down 3%, you'd have gotten decimated. Use the charts not the % on your screen. 🔥
Hit the follow button for free educational content because knowledge is free. KD out.

Relationship Between BTC.D and BTC price and Altcoin priceshello friends today i want to tell you how can you peredict altcoins behavaior according to the
bitcoin price and bitcoin dominance.
so come with me to say you how it works:
liek you can see in below chart :
if BTC price increase and BTC .D( Bitcoin Dominance) increase too ====> Altcoins price decreases.
if BTC price decrease and BTC .D increase ====> Altcoins price Dump and decrase heavy.this is dump phase.
if BTC price go sidewalk(without up or down) and BTC .D increase ====>Altcoins price dont change and this is accumulation phase.
if BTC price increase and BTC .D decrease ====> Altcoins price increase quickly and this is altseason.
if BTC price decrease and BTC .D decrase too ====> Altcoins prices go sideways.
if BTC price go sidewalk and BTC .D decrease ====> Altcoins prices increase.
hope this article be useful for you.
please support me for more useful subjects.
thanks friends.

🌳very important terminologies in Trading🌳Hello every one
🟡(1) Price action
The Movement of an asset or Security's price over Time , Plotted on The chart
🟡(2) All-Time High (ATH)
The Highest asset has Ever been in Price
🟢(3) Support
a Point in the market where the Price is less likely to drop below due to previous demand or price action
🟡(3) Resistance
a Point in the market where the Price is less likely to break above due to previous demand or price action
🔵(4) Trend line
a line indicating the General Price Direction of a chart
🟡(5) break out
when the Price of the asset break through a pre-determined Trendline
⚪(6) Formation
when a Financial Chart moves in such a way as to create a Recognizable pattern.patterns to signal trading opportunities either to enter or exit positions.
🟢(7) pump or bullish
The price of an asset is going up
🟡(7) Dump or bearish
The price of an asset is going Down
🔵(8) Long Position
a Regular Buy in The Market. a Trade that is Predicting the asset will go up in value
🟡(8) short Position
The opposite of a long Position. Entering a Trade position betting the asset to go down in value.


02.10.2019 Stellar (XLM/USD)Hi traders!
We are going to analyze absolutely specific chart today - XLM / USD . It's not a typical technical analysis, but we want to prepare you for various traps and extremes on the crypto market .
Stellar is the tenth biggest cryptocurrency from the market capitalisation perspective, thus it's not any dwarf. So what can we read from the chart?
Stellar has been nicely finishing its structure and the last wave of a cycle, anticipating early growth. Triangle formation is often located before the last move in the current direction and it was even followed by a falling wedge formation. If you see these two formations, one after another, you win! In the vast majority of cases break and growth comes, and they did come. The growth of more than 52% in about 3 days . It even managed to stay high and the coin looked superbly.
However, Bitcoin broke down . Sharp decline sent Stellar to the bottom of the sea, literally. It fell by 42% in a couple of days . Given today's situation, we think it will continue to decline. At this point is essential to remind, that we are talking about the 10th biggest cryptocurrency. Similar extremes are common in cryptocurrencies and therefore we need to pay special attention. Key takeaway to remember here is to always scan the market as the whole . If any cryptocurrency looks really good but then Bitcoin is falling through floors you may simply have bad luck.
What to learn from this analysis?
1. Don't be greedy
2. Use stop-loss
3. Watch the market as the whole
4. Don't let emotions control you (market will keep tempting you)
5. Search only for the best situations on the chart
May the crypto be with you!

Trump-ah-pump! Fake news and more!What a day it has been on Wall Street (DJI)! The markets moved north on Mr Trump waxing lyrical that he's off the hook - yet again.
What the Mueller report actually said at p182, was that, " The evidence we obtained about the President's actions and intent presents difficult issues that would need to be resolved if we were making a traditional prosecutorial judgment. At the same time , if we had confidence after a thorough investigation of the facts that the President clearly did not commit obstruction of justice, we would so state. Based on the facts and the applicable legal standards, we are unable to reach that judgment. Accordingly, while this report does not conclude that the President committed a crime, it also does not exonerate him ."
In simpler language, the Mueller Inquiry was not tasked with prosecuting the President. It was outside of their powers. Importantly they term their conclusions (which are not definitive) in double negatives. I say that this is an invitation to Congress (the legislature in America) to investigate further. The report did NOT exonerate Mr Trump! That is as clear as daylight! But fake news and fake assertions drives markets! The evidence for that is right there - before your eyes - on the chart.

Longs and shorts: short analysis!It seems like people is opening more shorts (red line) with respect to (green line).
This keeps pressure for the bulls and the price is not showing bounce signals.
Keep also in mind that the total shorts opened are still less than total long opened.
We suggest to keep short and longs in consideration before making any trade on ethereum, as the price is very volatile due the low volumes.

A QUICK LESSON ON BEAR FLAGS! Hey guys, just wanted to post this quick educational analysis of what a bear flag looks like and how to calculate the measured move. Pretty straightforward from the chart, but if you have any questions feel free to comment. Also, this bear flag ties in with my other idea that is linked below in case you want to see how it plays along with the current situation.
As always, this is for educational purposes only, please LIKE if this has helped you!
