Currency Shifts and Their Impact on Global Trade1. Understanding Currency Shifts
A currency shift refers to a change in the value of one nation’s currency relative to another in the foreign exchange (forex) market. This movement is driven by multiple factors including interest rates, inflation, fiscal policies, political events, and market psychology.
The value of a currency is typically measured against others through exchange rates — for instance, 1 U.S. Dollar equals ₹83 Indian Rupees. If the rupee weakens to ₹85 per dollar, it means the rupee has depreciated; conversely, if it strengthens to ₹80, it has appreciated.
Key Drivers of Currency Shifts:
Interest Rate Differentials: Higher interest rates attract foreign capital, boosting demand for that currency.
Inflation: Low inflation generally strengthens a currency; high inflation erodes purchasing power.
Economic Growth: Strong GDP growth signals a healthy economy, attracting investment.
Political Stability: Investors prefer stable nations with predictable economic policies.
Trade Balances: Countries with large trade surpluses tend to have stronger currencies due to export demand.
Market Sentiment: Traders’ expectations often move currencies even before data confirms trends.
2. The Mechanics of Currency Appreciation and Depreciation
When a currency appreciates, it gains value relative to others. For example, if the euro strengthens against the dollar, European goods become more expensive for U.S. buyers, potentially reducing exports. On the other hand, depreciation makes exports cheaper and imports more expensive, often improving trade balances for export-heavy economies.
Currency Appreciation:
Exports become costlier, reducing demand abroad.
Imports become cheaper, increasing domestic consumption of foreign goods.
Inflationary pressures ease due to cheaper imports.
Tourism becomes costlier for foreign visitors.
Currency Depreciation:
Exports become cheaper and more competitive globally.
Imports become expensive, raising domestic inflation.
Foreign investors may hesitate due to reduced returns in depreciated terms.
Tourism becomes attractive to foreign travelers.
These movements create ripple effects in trade balances, corporate earnings, and even employment rates in export-dependent industries.
3. Currency Shifts and Export Competitiveness
The direct relationship between currency values and export competitiveness is one of the most crucial aspects of international trade.
When a nation’s currency weakens, its goods and services become more affordable to global buyers. This often leads to:
Increased export volumes.
Higher revenues for export industries.
Improved trade balance.
For example, China’s export boom in the 2000s was partly supported by a deliberately undervalued yuan, which kept Chinese products inexpensive in global markets.
Conversely, a strong currency can hurt exporters. Japan’s experience in the 1990s and early 2000s is a classic case — a strong yen made Japanese goods costly overseas, slowing growth and triggering deflationary pressures.
Example: The Indian Perspective
A weaker Indian Rupee benefits textile and IT exporters, as they earn in dollars but pay costs in rupees. However, it hurts oil importers and increases domestic inflation — showing how currency shifts can have both winners and losers within the same economy.
4. Impact on Imports and Domestic Consumption
Currency shifts don’t just affect exports — they deeply influence imports and consumer prices.
When a country’s currency depreciates, imported goods become more expensive. This can drive up prices of:
Crude oil and energy.
Machinery and electronics.
Raw materials for manufacturing.
As import costs rise, domestic inflation tends to follow, reducing the purchasing power of consumers.
On the other hand, currency appreciation makes imported goods cheaper. This benefits consumers and import-heavy industries but can also weaken domestic producers who face tougher competition from foreign suppliers.
Example: The U.S. Dollar’s Global Role
A strong U.S. dollar makes imports cheaper for Americans — from electronics to automobiles — but can hurt U.S. exporters like Boeing or Caterpillar, as their goods become more expensive abroad.
5. Balance of Payments and Trade Deficits
Currency shifts are closely tied to a country’s balance of payments (BoP) — the record of all transactions between residents of a country and the rest of the world.
A depreciating currency can reduce trade deficits by boosting exports and curbing imports.
An appreciating currency can widen trade deficits as imports rise and exports fall.
However, this relationship isn’t always linear. Sometimes, despite a weaker currency, exports may not rise if:
Global demand is weak.
Supply chains are disrupted.
Exporters rely on imported raw materials (which become costlier).
Case Example: The U.S. Trade Deficit
Despite periodic dollar weakness, the U.S. maintains a persistent trade deficit because of its reliance on imports and strong consumer demand. The dollar’s status as a global reserve currency also keeps it artificially strong, sustaining the deficit.
6. Currency Shifts and Multinational Corporations (MNCs)
For multinational corporations, currency shifts are a constant strategic concern. A company earning revenue in multiple currencies faces exchange rate risk, which can affect profits when converting earnings into the home currency.
Impact Areas:
Revenues: Exporters gain from weaker home currencies, while importers benefit from stronger ones.
Costs: Companies sourcing materials abroad face rising costs when their home currency weakens.
Profits: Fluctuating exchange rates can distort earnings reports and shareholder returns.
Example: Apple and the Dollar
Apple earns a major portion of its revenue overseas. When the U.S. dollar strengthens, Apple’s international earnings, once converted into dollars, decline — even if sales volumes remain constant. Hence, large firms use hedging instruments like forward contracts and options to manage this risk.
7. Currency Wars: Competitive Devaluation and Trade Tensions
At times, nations deliberately weaken their currencies to gain a trade advantage — a phenomenon known as a currency war. By devaluing their currency, they make exports cheaper and imports costlier, spurring domestic production and employment.
However, this often leads to retaliatory devaluations and trade frictions.
For instance:
The 1930s Great Depression saw major economies engage in competitive devaluation, worsening global instability.
The 2010s U.S.-China tensions reignited accusations of “currency manipulation” as China kept the yuan undervalued to boost exports.
Currency wars can escalate into trade wars, where countries impose tariffs or restrictions to counter perceived unfair advantages.
8. Currency Shifts and Commodity Trade
Commodities like oil, gold, and agricultural products are traded globally in U.S. dollars. Therefore, currency shifts — especially movements in the dollar — significantly affect commodity prices.
Strong Dollar:
Commodities become more expensive in other currencies, reducing demand.
Oil and gold prices typically fall.
Weak Dollar:
Commodities become cheaper for foreign buyers.
Prices of oil, metals, and gold usually rise.
This dynamic explains why emerging markets, which rely on commodity exports, are highly sensitive to dollar strength. For example, when the dollar weakens, countries like Brazil, Russia, and Indonesia benefit from higher export revenues.
9. Managing Currency Risks in Global Trade
Given the unpredictability of exchange rates, businesses and governments employ various strategies to manage currency risk.
For Businesses:
Hedging Instruments: Using forward contracts, futures, and options to lock in exchange rates.
Currency Diversification: Operating in multiple markets to balance currency exposure.
Natural Hedging: Matching revenues and expenses in the same currency to minimize conversion losses.
For Governments:
Foreign Exchange Reserves: Central banks hold large reserves to stabilize their currencies.
Monetary Policy Interventions: Adjusting interest rates or directly buying/selling currencies in forex markets.
Trade Policy Adjustments: Imposing tariffs or export incentives to offset currency shifts.
Example: India’s RBI Strategy
The Reserve Bank of India often intervenes to smooth excessive volatility in the rupee, buying or selling dollars to maintain stability. This ensures predictability for exporters and importers alike.
10. The Future of Currency and Global Trade
The 21st century is witnessing rapid shifts in the global currency landscape. The rise of digital currencies, blockchain-based settlements, and central bank digital currencies (CBDCs) may reshape how trade is conducted and how exchange rates are managed.
Key Future Trends:
De-dollarization: Countries are gradually reducing dependence on the U.S. dollar in global trade, using local currencies or alternatives like the yuan.
Digital Payments Revolution: Instant cross-border settlements via blockchain can reduce currency conversion costs.
Geopolitical Realignment: Emerging economies, especially in Asia and Africa, are forming regional trade blocs with local currency trade mechanisms.
AI-Driven Forex Models: Advanced algorithms are increasingly predicting and managing exchange rate risks for corporations and funds.
In the coming decade, the line between traditional currency systems and digital ecosystems may blur, making global trade faster but also more complex to regulate.
Conclusion: The Currency-Trade Equation in a Globalized World
Currency shifts are not mere financial statistics; they are powerful forces shaping the destinies of nations, industries, and individuals. From determining the price of crude oil to influencing job growth in export sectors, exchange rate movements ripple through every layer of the global economy.
A weaker currency can boost exports and employment but risk inflation. A stronger one may curb inflation but dampen competitiveness. Striking the right balance is a constant challenge for policymakers and traders alike.
In today’s interconnected world, understanding the interplay between currency shifts and trade is essential not only for economists and governments but also for investors, businesses, and consumers.
As technology, geopolitics, and digital finance redefine global commerce, the ability to adapt to currency movements will determine who thrives — and who struggles — in the ever-evolving landscape of international trade.
Forexsignals
Explaining the Lower Timeframe Function and Its Role in Trading Introduction
Candlesticks on higher timeframes summarize long periods of trading activity, but they hide the internal balance of buying and selling. A daily candle, for instance, may show only a strong close, while in reality buyers and sellers may have fought much more evenly. To uncover this hidden structure, Pine Script offers the requestUpAndDownVolume() function, which retrieves up-volume, down-volume, and delta from a chosen lower timeframe (LTF).
Function in Practice
By applying this function, traders can measure how much of a move was supported by genuine buying pressure and how much came from selling pressure. The function works across timeframes: when analyzing a daily chart, one can select a one-minute or one-second LTF to see how the volume was distributed within each daily bar . This approach reveals details that are invisible on the higher timeframe alone.
Helper for Data Coverage
Lower-timeframe data comes with strict limitations. A one-second chart may only cover a few hours of history, while a one-minute chart can stretch much further back. To make this limitation transparent, a helper was implemented in our code: it shows explicitly how far the available LTF data extends . Instead of assuming full coverage, the trader knows the exact portion of the higher bar that is represented.
//══════════════
// Volume — Lower TF Up/Down
//══════════════
int global_volume_period = input.int(20, minval=1, title="Global Volume Period", tooltip="Shared lookback for ALL volume calculations (e.g., averages/sums).", group=grpVolume)
bool use_custom_tf_input = input.bool(true, "Use custom lower timeframe", tooltip="Override the automatically chosen lower timeframe for volume calculations.", group=grpVolume)
string custom_tf_input = input.timeframe("1", "Lower timeframe", tooltip="Lower timeframe used for up/down volume calculations.", group=grpVolume)
import TradingView/ta/10 as tvta
resolve_lower_tf(bool useCustom, string customTF) =>
useCustom ? customTF :
timeframe.isseconds ? "1S" :
timeframe.isintraday ? "1" :
timeframe.isdaily ? "5" : "60"
get_up_down_volume(string lowerTf) =>
= tvta.requestUpAndDownVolume(lowerTf)
var float upVolume = na
var float downVolume = na
var float deltaVolume = na
string lower_tf = resolve_lower_tf(use_custom_tf_input, custom_tf_input)
= get_up_down_volume(lower_tf)
upVolume := u_tmp
downVolume := d_tmp
deltaVolume := dl_tmp
//──── LTF coverage counter — counts chart bars with valid Up/Down (non-na) 〔Hazel-lite〕
var int ltf_total_bars = 0
var int last_valid_bar_index = na // new: remember the bar_index of the last valid LTF bar
if not na(deltaVolume)
ltf_total_bars += 1
last_valid_bar_index := bar_index
int ltf_safe_window = ltf_total_bars
var label ltf_cov_label = na // label handle for the “coverage” marker
Use in Strategy Development
Because both the main function and the helper for data coverage have been implemented in our work, we use the Hazel-nut BB Volume strategy here as a practical example to illustrate the subject. This strategy serves only as a framework to show how lower-timeframe volume analysis affects higher-timeframe charts. In the following sections, several charts will be presented and briefly explained to demonstrate these effects in practice.
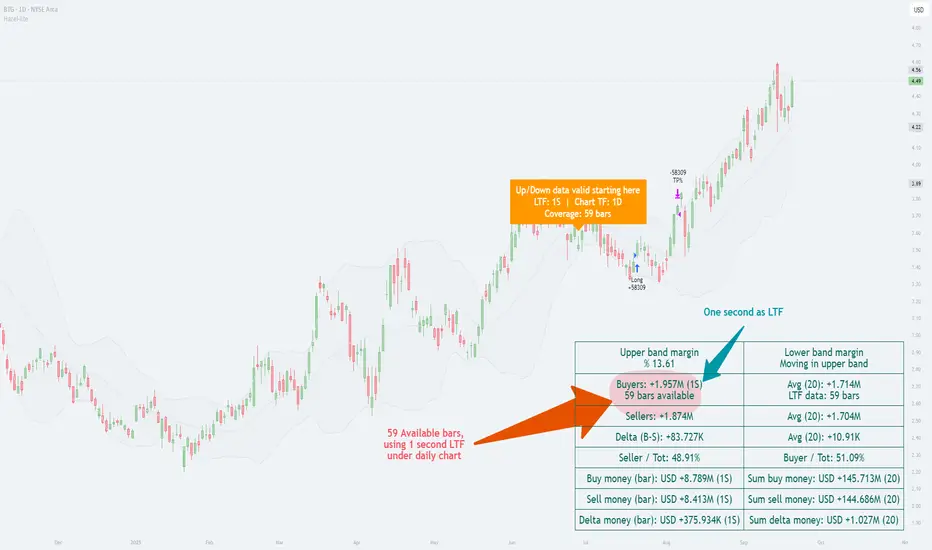
In this example, the daily chart is used as the main timeframe, while a one-second lower timeframe (LTF) has been applied to examine the internal volume distribution. The helper clearly indicates that only 59 one-second bars are available for this daily candle. This is critical, because it shows the analysis is based on a partial window of intraday data rather than a full day.
The up/down volume split reveals that buyers accounted for about 1.957 million units versus sellers with 1.874 million, producing a positive delta of roughly +83,727. In percentage terms, buyers held a slight edge (≈51%), while sellers were close behind (≈49%). This near balance demonstrates how the daily candle’s bullish appearance was built on only a modest dominance by buyers.
By presenting both the margin values (e.g., upper band margin 13.61%) and the absolute money flow, the chart connects higher-timeframe Bollinger Band context with the micro-timeframe order flow. The annotation “Up/Down data valid starting here” reinforces the importance of the helper: it alerts the user that valid LTF volume coverage begins from a specific point, preventing misinterpretation of missing data.
In short, this chart illustrates how choosing a very fine LTF (1 second) can reveal subtle buyer–seller dynamics, while at the same time highlighting the limitation of short data availability. It is a practical case of the principle described earlier—lower-timeframe insight enriches higher-timeframe context, but only within the boundary of available bars.
Analysis with One-Minute LTF
In this chart, the daily timeframe remains the base, but the lower timeframe (LTF) has been shifted to one minute. The helper indicates that data coverage extends across 353 daily bars, a much deeper historical window than in the one-second example. This means we can evaluate buyer/seller balance over nearly a full year of daily candles rather than just a short slice of history.
The up/down split shows buyers at ≈2.019M and sellers at ≈1.812M, producing a positive delta of +206,223. Here, buyers hold about 52.7%, compared to sellers at 47.3%. This stronger bias toward buyers contrasts with the previous chart, where the one-second LTF produced only a slim delta of +83,727 and ratios closer to 51%/49%.
Comparison with the One-Second LTF Chart
Data coverage: 1s gave 59 daily bars of usable history; 1m extends that to 353 bars.
Delta magnitude: 1s produced a modest delta (+83k), reflecting very fine-grained noise; 1m smooths those micro-fluctuations into a larger, clearer delta (+206k).
Interpretation: The 1s chart highlighted short-term balance, almost evenly split. The 1m chart, backed by longer history, paints a more decisive picture of buyer strength.
Key Takeaway
This comparison underscores the trade-off: the lower the LTF, the higher the detail but the shorter the history; the higher the LTF, the broader the historical coverage but at the cost of microscopic precision. The helper function bridges this gap by making the coverage explicit, ensuring traders know exactly what their analysis is built on.
Impact of TradingView Plan Levels
Another factor shaping the use of this function is the user’s access to data. TradingView accounts differ in how much intraday history they provide and which intervals are unlocked.
◉ On the free plan, the smallest available interval is one minute, with a few months of intraday history.
◉ Paid plans unlock second-based charts, but even then, history is measured in hours or days, not months.
◉ Higher tiers extend the number of bars that can be loaded per chart, which becomes relevant when pulling large volumes of lower-timeframe data into higher-timeframe studies
Conclusion
With requestUpAndDownVolume(), it becomes possible to see how each symbol behaves internally across different timeframes. The helper function makes clear where the data stops, preventing misinterpretation. By applying this setup within strategies like Hazel-nut BB Volume, one can demonstrate how changing the lower timeframe directly alters the picture seen on higher charts. In this way, the function is not just a technical option but a bridge between detail and context.
Why Spot Forex is the First Choice for Retail Traders1. Understanding Spot Forex
Before exploring the reasons for its popularity, it’s important to understand what spot forex really is.
Definition: Spot forex is the purchase or sale of one currency for another, with settlement occurring “on the spot” (usually within two business days, but in practice, retail brokers provide immediate execution).
Currency pairs: Trades happen in pairs like EUR/USD, GBP/JPY, or USD/INR. The first currency (base) is being bought or sold against the second (quote).
Objective: Traders aim to profit from the fluctuations in exchange rates between currencies.
Unlike futures or options, where contracts are traded, spot forex involves the direct exchange at current prices. For retail traders, brokers provide contracts via platforms that simulate this process with tight spreads, leverage, and easy order execution.
2. Historical Growth of Retail Forex
Until the late 1990s, forex was largely the playground of banks, hedge funds, and large corporations managing cross-border exposures. Retail investors had little or no access because:
Minimum transaction sizes were too large.
Trading required specialized knowledge and infrastructure.
Pricing was not transparent to the public.
However, the rise of online trading platforms around the year 2000 changed everything. Brokers like OANDA, FXCM, and later a flood of global platforms, introduced small contract sizes, user-friendly software (like MetaTrader), and access to leverage. Suddenly, anyone with an internet connection could participate.
By the mid-2000s, millions of retail traders had entered the forex market, with Asia, Europe, and later Africa becoming hotspots for new traders. Today, forex is the largest segment of retail online trading, far surpassing traditional stock trading in many regions.
3. Core Advantages of Spot Forex for Retail Traders
3.1 Liquidity and Market Size
Forex is the world’s most liquid market, with trillions of dollars traded daily. This liquidity brings several benefits:
Tight spreads: Bid-ask spreads are minimal, especially on major pairs like EUR/USD.
Instant execution: Orders can be filled within milliseconds.
No market manipulation (at retail scale): Because the market is so vast, individual retail traders or even brokers cannot manipulate prices significantly.
For beginners, this means fair pricing, ease of entry and exit, and reduced slippage compared to thinly traded assets.
3.2 24-Hour Market
Unlike stock exchanges that operate within specific hours, forex trading runs 24 hours a day, five days a week. From the Sydney open on Monday morning to the New York close on Friday evening, trading never stops.
This round-the-clock access is particularly attractive for retail traders who often trade part-time:
A student can trade after classes.
A working professional can trade after office hours.
A freelancer can pick sessions that match their schedule.
Flexibility is a major reason why forex fits into people’s lives more easily than stock markets with rigid timings.
3.3 Leverage and Low Capital Requirement
One of the most powerful attractions of forex is leverage. Brokers allow traders to control positions much larger than their deposit. For example:
With leverage of 1:100, a trader can control $10,000 worth of currency with just $100 margin.
Some brokers even offer leverage as high as 1:500 or more.
This means retail traders don’t need large starting capital. Someone with $500 can participate meaningfully in the market, unlike in stocks where buying even a few shares of large companies can consume the entire amount.
Of course, leverage is a double-edged sword (covered later), but its availability makes forex highly accessible.
3.4 Low Transaction Costs
Forex brokers earn mainly from spreads (the difference between buy and sell prices), which are often as low as 0.1 to 1 pip for major pairs. Compared to stock brokers who charge commissions or commodity markets with exchange fees, forex is cost-efficient.
No clearing fees, exchange fees, or government stamp duties make the cost structure simpler and lighter for retail traders.
3.5 Variety of Currency Pairs
Forex offers a wide menu of tradable instruments:
Majors: EUR/USD, GBP/USD, USD/JPY, USD/CHF.
Minors: EUR/GBP, AUD/JPY, GBP/CHF.
Exotics: USD/TRY, USD/ZAR, USD/INR.
This variety allows traders to pick pairs that suit their trading style. Some prefer stable majors with tight spreads, while others thrive on the volatility of exotic currencies.
3.6 Advanced Technology & Platforms
The retail forex industry has benefited enormously from trading technology. Platforms like MetaTrader 4 (MT4), MetaTrader 5 (MT5), and cTrader provide:
One-click execution.
Real-time charts.
Custom indicators and automated trading (Expert Advisors).
Mobile apps for trading on the go.
Such sophisticated tools, often free, are a huge reason forex became the default choice for retail traders.
4. Practical Reasons Retail Traders Prefer Spot Forex
4.1 Easy Account Setup
Opening a forex trading account is often easier than opening a stock brokerage account. With online KYC, low minimum deposits (sometimes as low as $10), and demo accounts, the barrier to entry is minimal.
4.2 Demo Accounts for Practice
Unlike many stock or commodity brokers, forex brokers almost always provide free demo accounts with virtual money. This allows beginners to practice strategies without financial risk, making the learning curve smoother.
4.3 Global Access
Forex is a truly global market. Whether you live in India, Nigeria, Brazil, or Europe, you can access the same currency pairs and pricing as traders in New York or London. This universality is rare in other asset classes.
5. Psychological & Behavioral Appeal
5.1 The Thrill of Leverage
For many beginners, the ability to control large amounts with small deposits is exhilarating. The idea of turning $100 into $1,000 in a short span appeals strongly to retail traders, even though the risks are equally high.
5.2 Freedom and Independence
Forex gives traders the sense of being their own boss. No middle managers, no clients to report to—just you, your strategy, and the market. This independence attracts people seeking financial freedom.
5.3 Quick Feedback Loop
Unlike long-term stock investing, forex provides immediate feedback. A trader knows within minutes or hours whether a trade is working, which keeps engagement high.
6. Risks and Misconceptions
It would be incomplete to discuss forex’s appeal without addressing its risks.
6.1 Overuse of Leverage
Leverage magnifies profits and losses. Many retail traders blow up accounts by over-leveraging, thinking they can get rich overnight.
6.2 Emotional Trading
The fast pace and 24-hour availability often lead to overtrading, revenge trading, or lack of discipline. Psychology plays a huge role in whether traders succeed or fail.
6.3 Broker Risks
Not all brokers are regulated. Many retail traders in emerging markets fall prey to fraudulent brokers promising unrealistic leverage or bonuses.
Despite these challenges, the majority of traders still flock to forex because the potential rewards outweigh perceived risks in their minds.
Conclusion
Spot forex has become the first choice for retail traders because it combines accessibility, liquidity, low costs, global reach, and technological sophistication in a way that no other market does. For individuals with limited capital, flexible schedules, and a desire for independence, forex is the natural starting point.
Yes, the risks are real—particularly misuse of leverage and emotional trading—but the sheer scale of opportunities continues to draw millions of retail traders each year.
For beginners and seasoned traders alike, the spot forex market remains not only the largest financial arena but also the most democratic—open to anyone, anywhere, with the willingness to learn and the discipline to trade.
Master Your Edge: It’s Not About Just Being Right
Most traders obsess over being right on every trade. But the truth is, consistent profitability doesn’t come from perfect predictions—it comes from disciplined risk management.
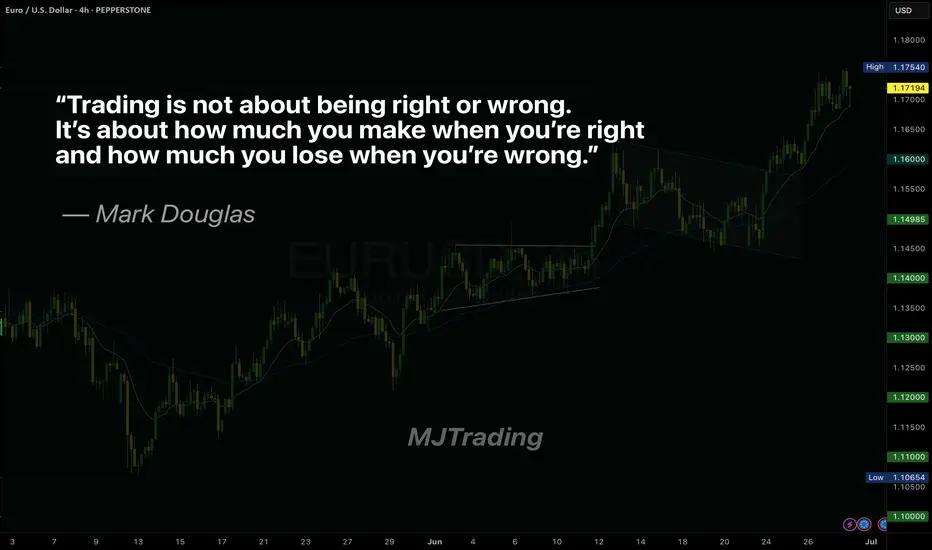
Mark Douglas reminds us:
“Trading is not about being right or wrong. It’s about how much you make when you’re right and how much you lose when you’re wrong.”
Focus less on proving yourself right, and more on protecting your capital when you’re wrong. That’s how professionals thrive in uncertain markets.
#MJTrading
#TradingPsychology #MarkDouglas #ForexMindset #TraderMindset #EURUSD #TradingQuotes #ForexLife #RiskManagement #TradingDiscipline #ForexEducation #ChartOfTheDay #PriceAction #MindOverMarkets
Master Forex Trading with ICT Kill Zones (2024 Guide)The forex market runs 24/5, but not all hours are equally profitable. ICT Kill Zones highlight the 4 most volatile trading windows where institutional activity creates prime opportunities.
ICT Kill Zones Timetable (GMT/EST)
Asian: 8PM - 10PM EST / 12AM - 2AM GMT
London: 2AM - 5AM EST / 6AM - 9AM GMT
New York: 7AM - 9AM EST / 11AM - 1PM GMT
London Close: 10AM - 12PM EST / 2PM - 4PM GMT
Key Characteristics:
Asian Session
Best for AUD, NZD, JPY pairs
Low volatility; ideal for 15-20 pip scalps
London Session
Highest liquidity (trade EUR/GBP)
Often sets daily highs/lows
New York Session
Overlap with London creates high volatility
Focus on USD pairs (e.g., USD/CAD)
London Close
Price retracements to daily range
Quick 15-20 pip reversal plays

Part 1: How to Analyze Events in the Forex Market?
The forex market is one of the most dynamic and volatile financial markets in the world. It is deeply influenced by global events, economic data, and geopolitical developments. Traders who understand how to analyze these events can make informed decisions and capitalize on market movements.
Influence Of the Global Events:
The forex market is directly linked to global economic health. Since currencies represent the economies of their respective countries, any significant event like an interest rate decision, inflation data, or geopolitical conflict. It can cause major fluctuations in currency prices. Here’s global events play important role:
- Central Bank Policies: When the Federal Reserve (Fed) or European Central Bank (ECB) changes interest rates, it impacts global liquidity and investment flows.
- Economic Data Releases: GDP growth, inflation, and employment reports provide insights into economic stability, affecting investor confidence.
- Geopolitical Events: Wars, elections, trade agreements, and diplomatic conflicts impact currency demand and risk sentiment.
What Happens When News Is Published?
When a major economic event or news release occurs, the forex market reacts instantly. Here’s the typical stages of events:
Stage 1: Market Expectations: Before the news release, traders anticipate the outcome based on forecasts. The market often prices in expectations.
Stage 2: Immediate Volatility: If the actual data differs from the forecast, there’s a sharp price movement in the affected currency pairs.
Stage 3: Liquidity Fluctuations: Spreads widen, and liquidity dries up momentarily as traders rush to execute orders.
Stage 4: Short-Term Correction: After the initial reaction, the market stabilizes, and price action follows the broader trend.
Major Events:
Central Bank Meetings – Institutions like the Fed, ECB, BoJ, and BoE set monetary policies. Interest rate hikes strengthen a currency, while rate cuts weaken it. Forward guidance also plays a role in shaping long-term trends.
Inflation Reports (CPI & PPI): These measure inflation levels, influencing central bank decisions. Higher inflation often leads to interest rate hikes, strengthening the currency, while lower inflation may result in monetary easing, weakening it.
Employment Data (NFP & Job Reports) – The US Non-Farm Payrolls (NFP) report is a key indicator. Strong job growth supports a stronger USD, while weak employment data signals economic trouble.
GDP Growth Reports –:A higher-than-expected GDP growth rate boosts investor confidence and strengthens the currency, while economic contraction leads to depreciation.
Political & Geopolitical Events: Elections, government policies, trade wars, and conflicts create uncertainty, often pushing investors toward safe-haven currencies like the USD, JPY, or CHF
One's Loss, Another's Win:
When the U.S. releases strong economic data, such as higher-than-expected GDP growth, strong job reports (NFP), or an interest rate hike by the Federal Reserve, The demand for the U.S. dollar increases. This leads to USD appreciation against other currencies, including the euro.
For example,
---> EUR/USD falls : USD is gaining strength, it takes fewer dollars to buy 1 euro, causing the EUR/USD exchange rate to drop.
---> USD/EUR rises : USD is now wortth more, the inverse exchange rate (USD/EUR) increases, meaning 1 USD can now buy more euro.
Key strategies for trading events:
•Stay Ahead with an Event Calendar: Keep track of important economic events and central bank meetings to anticipate potential market-moving news.
• Gauge Market Expectations: Understand forecasts and market sentiment before the event to predict how the market might react.
• Implement Stop-Loss Orders: Protect your trades from excessive risk by setting stop-loss orders to cap potential losses during volatile moves.
• Wait for Market Stability: Allow the market to settle after the event to avoid getting caught in the initial volatility and better assess the trend.
• Evaluate the Market’s Response: Assess the immediate market reaction to the event to identify if the initial price move is sustainable or a short-term spike.
Drawbacks of Trading News:
High Volatility & Whipsaws: Prices can spike in both directions before settling on a trend, leading to stop-loss hunting.
Widened Spreads: During news releases, brokers often widen spreads, increasing trading costs.
Slippage: Rapid price movements can lead to orders being executed at unexpected prices.
Emotional Trading: Sudden market swings can trigger impulsive decisions, leading to losses.
Market Manipulation: Big players and institutions often move the market unpredictably before major news releases.
In the next part, we will focus on the specific events and strategies.

Traders MindsetLet’s talk about mindset! You hear everyone saying; mindset is the most important in trading. But what is having “the right mindset” ?
Now here is a little secret. Mindset is not just being focused on the money. “I must be profitable”. No. Having the right mindset is having a set of attitudes. Quite literally the definition..
Mindset /ˈmʌɪn(d)sɛt/
noun (usually in singular) the established set of attitudes held by someone.
How you approach the market is very important.
Have a set of rules for yourself.
- Do I have a trading plan? Having a trading plan is important. It helps you follow something day in and day out.
- Do I have good market conditions? Having good market conditions is important as it helps you make more clear decisions. Trading in sideways markets usually ends badly. It forces the trader to become impatient and entering too soon, expecting a breakout to either side usually leads to loses.
- Do I know the risk? Understanding the risk before you enter the trade is important. Majority of traders over-leverage, meaning they use high leverage thus being able to open higher lot size positions. That usually leads to blown accounts. Knowing what you are risking, eliminates a lot of the emotions.
- Do I have any confirmations? Whether that’s a break, a pullback, fundamentals supporting your view that’s great! Having confirmations on your analysis or trade is important.
- Is this trade forced? Am I being nervous before entering? Am I not sure? Am I gambling on this trade? Understanding your emotions is important. Ever felt like this when you opened a trade, knowing you shouldn’t and it instantly went against you? Avoid these trades.
One more thing I would like to add. Ever been stuck to your screen 24/7? Lost sleep over a trade. Here is a fact. You watching the chart, won’t change its path. Sad truth. There is nothing wrong with following your trade, but if you are watching your losing trade, then I already know where it leads. You do too. Avoid this. Going back to the #1 rule. Know your risk before entering. Eliminate emotions.
Having the right mindset is following your own rules and having a set of habits. Habits that help you to grow as a trader. Eliminate bad habits. Review your past trades. You all know why you lost a trade. But will you look for an excuse? “Ah the market did a liquidity sweep” or “market is manipulated”. The market is never wrong. You as a trader are.
Don’t celebrate wins or mourn loses on your account. Treat it as your full time job. You have some good days, you have some bad days. You win, you move on. You lose, you move on. As long as you are following the trading plan, you will succeed.
Understanding this, combined with experience will grow you as a trader. And guess what the by product of this is? Money.
So don’t focus on money. Focus on self-growth, mindset, experience and upgrading your skillset of trading. Money will be the byproduct of your journey.
Create your mindset plan. A set of rules for yourself. Try doing it for 30 days. Come back to this post and tell us if you have improved.
Nothing or no one is stopping you from being a successful trader but yourself. It’s not the market and no it’s not the broker.
Majority of traders quit after blowing a few accounts. The rest stick around for years but make no progress. Only a few % of them actually find the meaning behind it and succeed.
What’s the secret? Signals? Prop Firms? Account managers? EA’s? No. Sure all these things can benefit you slightly. But what truly is the secret to being successful in trading?
You! You are the secret. Understanding yourself, your emotions, your reactions to certain events. Trading is a mirror of you. An amplified picture of you. Are you impatient? Scared? Nervous? Greedy? Forex will amplify those emotions.
The biggest battle you have to win is the battle with yourself. Not the market.
Trading is easy, you have a trading plan, you stick to it. Sometimes you may have a loosing week, happens right? But as long as you are sticking to your strategy, understanding the market, using a positive R:R and understanding the importance of consistency you should be fine. But here is the hard part. Your reactions. Your emotions.
Let’s take for example NFP Data release. Weeks or even months of progress can be wiped out due to irrational decisions during news. Don’t be that trader. Suppress your emotions, don’t get greedy. Take a jab at the market, but only after the data is out.
Remember, no one is stopping you from being a successful trader, but yourself.
A key element added to a traders mindset is PATIENCE .
patience /ˈpeɪʃns/
(noun) - the capacity to accept or tolerate delay, problems, or suffering without becoming annoyed or anxious.
That’s the definition of patience. Trading is a stressful field. Not only does your analysis have to be on point, you have to be focused, have a trading plan, use proper risk to reward ratio… so many factors and then comes the patience. We already know that the market always provides unexpected problems. It plays with our emotions, ranges, does not move, goes against us etc.
How many times have you entered in a position and the price started to range, while you float in loss? You start doubting, you get scared and you close the position. Or even worse, you get stopped out. Later in the day you check the chart and you see your Take Profit (TP) would have been hit, but only if you were more patient?
Or how many times have you had an A+ setup, everything was going to plan but you closed it early because you wanted to secure the profit?
Being a good trader is hard, but it’s not impossible. Discipline is everything as well as patience. Without patience you are bound to lose.
From talking to many people, you would be surprised at how many of them want to “flip” their account. “Do you think I can make 2000$ this week” with 1000$ in their account.
We will always advocate for patience. Playing the long game. Consistency + patience will get you far.
Check some of the last trades you did. Were you patient? Ask yourself. Majority can find themselves in these stories.
Work on your patience, and you will get far.
For example, check out this long-term analysis on XAUUSD (Gold) posted on January 9th. Now we did close it earlier, but we still managed to secure +500 pips (50$ price action) in 3 days of holding. Patience.
This post was made due to a high request of people liking our minds, so it has all been posted in a single educational post.
FxPocket

Pattern and Structure This image provides a visual guide to key chart patterns and market structures in Forex trading. It emphasizes the importance of understanding how these patterns form and how price action influences market movements. The chart showcases several common patterns:
1. Bearish Channel: Traders are advised to buy at the retest after a breakout from the channel.
2. Double Bottom: This reversal pattern suggests buying after the confirmation of the second bottom or the breakout.
3. Rising Wedge: A bearish continuation pattern where selling is recommended after a breakout.
4. Flag Pattern: This continuation pattern typically occurs after a strong price move. The image suggests buying after the breakout.
5. Inverted Head and Shoulders (H&S): A reversal pattern signaling a potential bullish move, with a buying opportunity after the breakout.
6. Symmetrical Triangle: This pattern can break either way, but the focus is on buying at the retest after an upward breakout.
The psychological level plays a significant role, as it represents critical zones where market sentiment often shifts. The chart encourages re-entry after successful retests in bullish patterns. This comprehensive structure helps traders enhance their technical analysis skills and make informed decisions.

What America Does with Its Money ? 🇺🇸 Decoding America's Spending: A Deep Dive into Government Finances
This topic has been on the horizon for a while, and I think many new traders will be pleased to see it so LFG
Just like a business, the government has its own financial records :
💰 Money comes in (primarily from taxes)
💸 Money goes out (to fund a variety of programs)
With an expected gross domestic product (GDP) of nearly $29 trillion in 2024, the US remains the world’s largest economy, surpassing China’s $18.5 trillion.
However, the US government isn’t exactly profitable. In fact, it’s been consistently running a growing deficit, raising concerns about its long-term financial stability.
As a general election approaches, it's more important than ever to understand how the US generates and spends its money. So, let’s dive into the details
Here’s a quick overview:
- Revenue: A deep dive into taxes
- Spending: Powering the nation
- Bottom Line: Operating costs & the deficit
- National Debt: A mounting challenge
- The Future: America's financial outlook
1. Revenue: A Deep Dive into Taxes
The US government operates on an enormous scale, and like any large organization, it requires a consistent stream of income to stay functional. However, unlike businesses that sell products or services, the government generates revenue primarily through taxes and fees
In fiscal year 2023, the federal government collected an astounding $4.4 trillion
So, where does all of this money come from? Let’s take a closer look:
👥 Individual Income Taxes:Nearly 50% of the government’s total revenue comes from individuals. Every time you receive a paycheck, a portion is automatically sent to Uncle Sam. This also includes taxes on capital gains from investments.
🏦 Social Security and Medicare Taxes: About 36% of revenue is generated from these taxes, which support programs like Social Security and Medicare for retirees and older adults. It’s a system where current workers help fund benefits for those who have already retired.
🏢 Corporate Income Taxes:Around 10% of the total revenue comes from businesses, which contribute a portion of their profits to the federal government. This is reflected in the income tax provisions that companies report.
🧩 Other Revenue:The remaining ~4% is sourced from various channels such as excise taxes (extra charges on goods like alcohol and tobacco), estate taxes, customs duties, and even fees collected from national park visits.
2. Spending: Powering the Nation
Now that we’ve seen how money flows into the US Treasury, it’s time to explore the exciting part figuring out how it’s spent. The US government faces the enormous responsibility of keeping the country functioning, covering everything from national defense to healthcare and infrastructure. And that demands a massive amount of spending
In fiscal year 2023, the federal government's net cost was $7.9 trillion, which is almost as large as the combined GDP of Germany and Japan the world’s third and fourth largest economies!
-Outlays vs. Net Cost:In FY23, total outlays (the actual cash spent) reached $6.1 trillion. Outlays refer to the cash disbursements, while the net cost also includes accrual-based accounting adjustments, such as changes in the future value of federal employee retirement benefits.
Who’s Deciding Where the Money Goes
So, how does the government determine how to allocate all this money? It’s a balancing act involving both the President and Congress:
-The President’s Proposal: The President begins the process by proposing a budget, outlining spending priorities based on requests from federal agencies. Think of it as a wish list—with a lot of extra zeros.
-House and Senate Role:Next, the House and Senate Budget Committees take over. They review the President’s proposal, make adjustments, and ultimately create the final spending bills. This process involves hearings, debates, and a fair amount of political negotiation.
Types of Spending
-Mandatory Spending:These are legally required expenses, like Social Security and Medicare, which make up a significant portion of the budget. These costs rise over time, particularly as the population ages
-Discretionary Spending:This is the part of the budget where the President and Congress decide how much to allocate to areas like defense, education, and more. In FY23, discretionary spending accounted for roughly 28% of total outlays, and it involves a yearly struggle as various departments compete for funding.
-Supplemental Spending: In cases of emergency, Congress can pass additional funding outside the normal budget cycle, as it did for the COVID-19 pandemic in 2020.
Where the Money Goes
Now, let's dive deeper into the specific areas where all that spending is directed:
-🏥 Healthcare Heavyweight:The Department of Health and Human Services commands the largest portion of spending, making up 22% of the net cost. This reflects the huge outlays for healthcare programs like Medicare and Medicaid.
-👵 Social Safety Net:Programs like Veterans Affairs and the Social Security Administration also require significant funding, together accounting for 18% of the budget. This demonstrates the high priority placed on supporting veterans and retirees.
-🫡 Defense and Security:The Department of Defense, tasked with ensuring national security, takes up 13% of government spending!
-💸 The Interest Burden: A growing share of the budget is going toward paying interest on the national debt, consuming 9% of total spending.
In FY23, government outlays represented 22% of the US economy (GDP). Over the past decade, this figure has remained slightly above 20%, excluding the exceptional impact of the COVID-19 pandemic.
3. Bottom Line: Operating Cost & Deficit
When government expenditures exceed its revenue, a budget deficit occurs
In FY23, the U.S. government recorded a $1.7 trillion deficit (revenue minus outlays).
Here’s a breakdown of two key financial terms:
-Net Operating Cost:This includes all costs incurred by the government, even if the payments haven’t been made yet. In FY23, the net operating cost was $3.4 trillion
-Budget Deficit:This is a narrower measure, focusing only on the cash difference between revenue and outlays. As mentioned, the FY23 budget deficit stood at $1.7 trillion
Both of these financial measures reveal a government consistently spending beyond its means—a pattern that has persisted for decades. In fact, over the past 50 years, the U.S. federal budget has only seen a surplus four times, with the most recent one occurring in 2001.
4. National Debt: A Mounting Challenge
So, how does the government continue operating despite being in the red?
It borrows money, mainly by issuing Treasury bonds, bills, and other securities. This borrowing adds to the national debt, which has grown into a major concern for the country’s economic outlook.
As of September 2024, the national debt has reached a staggering $36 trillion. To put that in perspective, it's as if every person in the US owes over $100,000!
Every time the government spends more than it earns, the shortfall is added to the national debt, which, in turn, increases the interest payments that need to be made in the future.
Why the Debt Keeps Growing ?
Several factors contribute to the relentless increase of the national debt:
-Persistent Deficits:For decades, the government has continuously spent more than it collects in revenue, leading to ongoing debt accumulation.
-Wars and Economic Crises: Significant events such as wars (like those in Iraq and Afghanistan) and economic crises (including the 2008 recession and the COVID-19 pandemic) often necessitate large government expenditures, further escalating the debt.
-Tax Cuts and Spending Increases: Policy decisions that either reduce government revenue (through tax cuts) or increase spending (by introducing new programs or expanding existing ones) also play a role in growing the debt.
The national debt presents a complicated issue without straightforward solutions. It requires balancing essential funding for programs and services while ensuring the nation’s long-term financial health.
5. The Future: America’s Finances
The road ahead is filled with challenges. The national debt continues to rise, with a debt-to-GDP ratio surpassing 100%, raising concerns about the nation's long-term economic stability and ability to fulfill financial commitments.
According to the Department of the Treasury, the current fiscal trajectory is unsustainable. Projections based on existing policies show a persistent gap between expected revenue and spending. Without substantial policy reforms, the national debt is likely to keep increasing.
Several factors will influence the future of America’s finances:
-Economic Growth: A strong economy generates higher tax revenues, making it easier to manage the debt. Conversely, slower growth could worsen the deficit and increase the debt burden.
-Interest Rates:Rising interest rates would elevate the cost of servicing the national debt, redirecting funds from other vital programs.
-Inflation: Excessive government debt can contribute to inflation, diminishing the purchasing power of individuals and businesses.
-Political Polarization: The significant partisan divide in U.S. politics complicates consensus-building on fiscal policy and the implementation of long-term solutions to address the debt.
-Demographic Shifts: An aging population increases pressure on entitlement programs like Social Security and Medicare, leading to higher government spending and potentially widening the deficit.
To tackle the challenges of growing debt and deficits, a combination of strategies is needed:
-Controlling Spending:Identifying areas for budget cuts or finding more efficient methods to deliver government services.
-Increasing Revenue:Exploring avenues for raising revenue through tax reforms or other means.
-Fostering Economic Growth:Implementing policies that promote sustainable long-term economic growth and boost tax revenues.
-Encouraging Bipartisan Cooperation:Seeking common ground across party lines to implement lasting fiscal reforms.
The future of America’s finances remains uncertain, but one thing is clear: addressing the national debt and ensuring the nation’s long-term fiscal health will require tough decisions and a commitment to responsible financial management.
What Can Be Done?
It’s easy to feel overwhelmed by the scale of these challenges, but meaningful change often starts with informed citizens. As we head into a new election cycle, understanding how the US government manages its finances is more crucial than ever.
So, what do you think should be America’s financial priorities?
Should policymakers concentrate on cutting spending, raising taxes, or fostering economic growth?

Fibonacci Retracement ExplainedWhat Are Fibonacci Retracement Levels?
In simple terms, Fibonacci Retracement Levels are horizontal lines on a chart that represent price levels. These price levels help identify where support or resistance may likely occur on a chart.
Each retracement level corresponds to a specific percentage, indicating how much of a pullback has taken place from a previous high or low. These percentages are derived from the Fibonacci sequence and include 23.6%, 38.2%, 61.8%, and 78.6%. Although not an official Fibonacci ratio, the 50% level is also commonly used.
This indicator is useful because it can be drawn between a high and a low price point, creating levels that indicate potential retracement areas between those two prices.
The basic Fibonacci Retracement amongst many trading platforms would normally look like this:
While this is okay, I would recommend changing the settings to my suggested format to improve clarity and comprehension. The revised version would look like this:
To copy this, the revised Fibonacci Retracement Settings are bellow:
By doing this, it shows you the “Golden Zone.” This spot is considered one of the most important areas because price often pulls back into this zone right before “extending” in a bullish pattern.
>>>>>NERDY INFO AHEAD<<<<<
Calculating Fibonacci Retracement Levels
The origin of the Fibonacci numbers is fascinating. They are based on something called the Golden Ratio.
This is a sequence of numbers starting with zero and one. Then, keep adding the prior two numbers to get the third number. This will eventually produce a number string looking like this:
• 0, 1, 1, 2, 3, 5, 8, 13, 21, 34, 55, 89, 144, 233, 377, 610, 987...with the string continuing indefinitely.
Fibonacci retracement levels are derived from the Fibonacci number sequence. As the sequence progresses, dividing one number by the next number yields 0.618, or 61.8% (233 divided by 377 gives you 0.618037.
Divide a number by the second number to its right; the result is 0.382 or 38.2% (233 divided by 610 gives you 0.381967.
All these ratios, apart from 50% (which is not officially part of the Fibonacci sequence), are calculated based on relationships within this number sequence.
The golden ratio can be found in various places in nature as well. This includes spiral patterns of seashells (like nautilus shells), the arrangement of leaves on a plant stem, the petals of certain flowers, and the structure of pinecones; it's also often observed in art and architecture, such as in the proportions of the Mona Lisa and the Parthenon, where artists intentionally incorporated it for aesthetic appeal.
Now, as you can tell, the Fibonacci isn’t just some lines and numbers someone made up. It’s in everything you encounter. It’s on charts. It’s in nature. It’s in geometry. It’s even in HUMAN DNA.
Fibonacci Retracements vs. Fibonacci Extensions
Remember when I said, “price often pulls back into this zone right before extending in a bullish pattern.” ???
That’s because Fibonacci Retracement, sometimes confused with Fibonacci Extension, is the act of price level pulling back to the Golden Zone. The Fibonacci Extension is when price level continues to move in a bullish pattern after pulling back to the Golden Zone.
For example, if a stock goes from $10 to $20, then back to $13. The move from $20 to $13 is the retracement. If the price starts rallying again and goes to $30, that is the extension.
Limitations of Using Fibonacci Retracement Levels
While the retracement levels suggest potential areas for support or resistance, there’s no guarantee that the price will reverse to these levels. This is why traders often look for additional confirmation signals such as price action and patterns. A double bottom in this Golden Zone coupled with an RSI divergence is a very good indication the price will move after entering the Golden Zone.
!!!Fun Fact!!!
Fibonacci retracement levels were named after Italian mathematician Leonardo Pisano Bigollo, famously known as Leonardo Fibonacci. However, Fibonacci did not create the Fibonacci sequence. Instead, Fibonacci introduced these numbers to western Europe after learning about them from Indian merchants. Some scholars suggest Fibonacci retracement levels were formulated in ancient India between 700 BCE and 100 AD, while others estimate between 480-410 BCE.2
Cheers everyone!!! Happy Trading 😊

Foreign exchange trading skills worth collecting (Part 2)
Continuing from the previous article;
25. Observe the magnitude of market changes: When the market falls (rises) with the same small amount every day, it may be a signal of a rebound (fall).
26. The dense area is likely to form a support belt or pressure belt: The dense area can be regarded as an obstacle to slow down the market price fluctuations. Once the trading range is broken, the price will make progress. Generally speaking, the longer the trading range lasts, the greater the price movement after the breakout.
27. Significant price rises and falls are often accompanied by key reversals: When the price hits a new high on high trading volume, then falls and closes lower than the previous day, it is usually a reversal phenomenon in the uptrend. The reversal in the downtrend is that the price first goes down, then rebounds strongly on the same day, and finally closes at a higher closing price than the previous day.
28. Pay attention to the head and shoulders pattern: When a head and shoulders pattern is formed on the price chart, it is usually a signal of a big rise. The appearance of the head and shoulders will not be clear until the second shoulder rebounds or pulls back to the level.
29. Pay attention to the highest point of "M" and the lowest point of "W": When the market trend forms a large M on the price chart, it suggests that you can sell. When it forms a W, it suggests that the price will rise.
30. Buy and sell at three highs and three lows: When the market climbs to a peak for the second or third time, it is a bearish signal; otherwise, it is a bullish signal.
31. Observe changes in trading volume: When trading volume rises with price, it is a buy signal. When trading volume increases and prices fall, it is a sell signal, but when trading volume decreases, no matter how the price moves, it is a wait-and-see or expecting a reversal signal.
32. The amount of open contracts can also provide intelligence: If open contracts increase when prices rise, it is a buy signal, especially when trading volume increases at the same time. Conversely, if open contracts increase when prices fall and trading volume is large, it provides sell information.
33. Pay attention to the fact that things will turn around when they reach their extremes, and good times will come after bad times: when a rising trend is very strong, pay attention to the implicit downward trend and pay attention to negative factors at any time; when a falling trend is very weak, pay attention to the implicit recovery information, pay more attention to positive news, and beware of market reversals.
34. Carefully judge the news effect: first, judge the authenticity of the news; second, understand the timeliness of the news; third, analyze the importance of the news; and finally, study the indicative nature of the news.
35. Retire before the delivery period: Commodity prices will have relatively large fluctuations in the delivery month. Commodity trading novices should move to other commodities before this to avoid this additional risk. The potential profits during the delivery period should be sought by experienced spot market traders.
36. Buy and sell when the market breaks through the opening price: This is a good hint of price trends, especially after a major news report. A breakthrough in the opening price may indicate the trend of trading that day or in the next few days. If the market breaks through the upper limit of the opening price, buy; if the breakthrough point is at the lower limit of the opening price, sell.
37. Buy and sell at the previous day's closing price breakthrough point: Many successful traders use this rule to decide when to establish new contracts or increase contracts. It means buying only when the transaction price is higher than the previous day's closing price; or selling when the transaction price is lower than the previous day's closing price.
38. Buy and sell at the previous week's high and low price breakthrough points: This rule is similar to the daily rule mentioned above, but his high and low prices are predicted based on the high point of the week. When the market breaks through the highest point of the week, it is a buy signal; when the market breaks through the lowest point of the week, it is a sell signal.
39. Buy and sell at the previous month's high and low price breakthrough points: The longer you observe, the more market momentum your decision will be based on. Therefore, the price breakthrough point of each month is a stronger hint of price trend, which is more important for futures commodity traders or hedge traders to make or break.
40. Establish pyramid trading: When you add contracts, do not add more contracts than the first one. This is a dangerous trading technique because as long as the market reverses slightly, all your profits will be wiped out. In the inverted pyramid trading, the average cost is close to the market price, which will hurt you.
41. Be careful with stop loss orders: The use of stop loss orders is a simple self-discipline; it can help you stop losses automatically. An important factor is: when you place an order, you must also set a stop loss point at the same time. If you don’t do this, you will lose more money and increase your losses in vain.
42. The retracement in a bull market is not the same as the bear market: conversely, the rebound in the bear market is not a bull market. Most investors like to short in a bull market and believe that it will definitely retrace, and vice versa. Change the rhythm and learn to buy in the retracement in the bull market and short in the rebound of the bear market. You will get more profits.
43. Buy and sell when the price is out of the track: Some successful traders use this rule most often. They buy and sell when prices are out of the norm or beyond general expectations. If ordinary buyers and sellers believe that market prices are rising, but in fact they are not, it is usually a good sell signal, especially after important information is released. Successful traders will wait for the general public to lean to one side, and then choose the time to buy and sell in the opposite direction.
44. The market will always fluctuate in a narrow range after violent fluctuations: when the market stabilizes after a sharp rise or a heavy fall, you must observe when the actual buying or selling begins to increase steadily, so that you can understand whether the market is ready to start, and take the opportunity to get on the train and wait to earn a wave of market.
45. When the bulls are rampant, the rise will slow down: if the market is filled with strong bullish arrogance, the price will not rise easily. Why is this so? When everyone is bullish and enters the market to do more, who can buy again and push the market up? Therefore, the price can only continue to rise after the people who originally did more can't stand the price softening and exit the market.
46. Buy and sell at the breakout points of rising and falling wedges: Any trend has its own process of brewing, generation, and development. When recorded on a chart, it will take on a certain shape. Once a certain pattern is formed, it usually has a considerable enlightenment effect on the future market development. Although it is not absolute, it has a high probability and has its reference value.
47. Don't buy and sell multiple commodities at the same time: If you try to pay attention to the pulse of many markets, that is, if you want to grasp the news of several markets at the same time, you will hurt yourself. Few people can succeed in both the stock index and the grain market at the same time because they are affected by irrelevant factors.
48. Don't add to the losing commodities: No matter how confident you are, don't add contracts to the commodities that have already lost money. If you do that, it shows that you can no longer keep up with the market, but some traders disagree with this rule and prefer to believe in a price averaging technology.
49. In a bear market, put aside the statistical reports: In a bear market, you must be able to ignore all the statistical figures and focus on the market trend. You must understand that the figures to be published reflect the past, not the future. The figures to be published in the future are the results of the present and the near future.
50. The market can only give you so much, so don't hold unrealistic expectations: Some operators always hope to make every penny in the market; trying to squeeze the last drop of profit in the market, the time and energy spent are not worth it; a fish is divided into three parts: the head, the body, and the tail, and the largest part is the body; the operator only needs to find a way to eat the fish meat, and leave the head and tail for others to eat.
I hope it helps you. The rest will be updated in new articles. If you need it, you can check it on the homepage after following it.

Bitcoin: How to Forecast the End of a Trend.The advance from Dec 2018 seems to be tracing an impulse pattern. Wave 1 is an impulse, wave 2 is a zigzag which neatly predicts flat wave 4 by guideline of alternation.
The fifth wave appears to be tracing an impulse as well; an extension. It's probable that two minute degrees have reached completion at this stage and the market appears to be tracing out the third wave.
So how do you forecast the target for wave 5?
One way is to use an Elliott wave channel. Connect the end of wave 2 and 4. Draw a parallel line along the top of wave 3 to project wave 5 target. It is quite common for wave 5 to end upon reaching the upper boundary line of the channel
In some cases, when wave 3 is uncommonly strong, almost vertical. Draw a parallel line using the top of wave 1 instead of wave 3.
From experience, it's quite advantageous to draw the two upper boundary lines.

How to Confirm an Elliott Wave Count.Hello fellow traders, today I would like to show you how to apply a Kennedy Channeling technique (by Jeffrey Kennedy) to identify and confirm Elliott waves with more confidence.
1. Base Channel:- Wave 3 identification
When wave 2 is complete, connect the origin of wave 1 and the end of wave 2. Draw a parallel line along the top of wave 1. As long as price action stays within this channel, you can consider price action corrective, probably wave C of a Zigzag. In a bullish trend, prices ought to break above the upper boundary line of this channel for wave 3 count to be acceptable.
2. Acceleration Channel:-Wave 4 identification.
Connect the extreme of wave 1 and the top of wave 3. Draw a parallel line starting at the bottom of wave 2. Only after prices break through the lower boundary line of the acceleration channel, could you be convinced that wave 3 is over and wave 4 is unfolding.
3. Final Channel:- Wave 5 identification
Connect the end of waves 2 and 4. Draw a parallel line along the top of wave 3 to project wave 5 target. It is quite common for wave 5 to terminate upon reaching the upper trendline of the final channel.
That's all for today. Trade wisely!

Want to spot a turning point in trend before it happens?Want to spot a turning point in trend before it happens? Use Elliott wave parallel channel
This chart shows the GBP/JPY currency pair using monthly candlesticks. The advance from Sep 2011 to June 2015 can be labeled as an impulse wave (A). From that high, the pair declined in three waves labeled as wave (B) of a Zigzag A-B-C correction with an expanding diagonal characteristic in the C wave position.
As a rule, in a Zigzag rally, wave B notably terminates above the origin of wave A. When wave (C) advance of a zigzag rally is in operation, we can forecast where wave (C) might end.
We can use Elliott wave channel projection by connecting the origin of wave (A) with the end of wave (B) and then drawing a parallel line from the end of wave (A). As a guideline, the resulting channel gives us a potential target for the wave (C) endpoint.
Moreover, we can also use ratio analysis to improve the odds. As a guideline, in Zigzag formations, wave (C) commonly ends after traveling the same length as wave (A). Observe this level corresponds with the Elliott wave channel projection.
This cluster of evidence hints at wave (C) advance from Mar 2020 is in late stages and that prices are approaching a major top.

How am I profitable on the Market ??! XAUUSD exempleHey !
I'm sharing with you the key to succes on the market.
In this page, I will share many things to you, to be a profitable trader like me.
This video is based on how to have a good risk management on Gold.
P.S. = I m French Canadian, So I'm here to improved my english aswell

Mastering the Art of Trading Doji Candlesticks in Forex 📈🕯️
Mastering the Art of Trading Doji Candlesticks in Forex 📈🕯️
✅Introduction
=================
In the world of forex trading, the use of candlestick patterns is an essential tool for analyzing and predicting market movements. Among these patterns, the doji candlestick holds a special significance due to its potential to signal market reversals and trend continuations. In this article, we will explore the characteristics of doji candlesticks, their significance in forex trading, and strategies for effectively trading them.
Formation of 2 doji candles on a daily time frame on GBPUSD after a retracement was a strong bullish signal.
✅Understanding the Doji Candlestick
=====================================
The doji candlestick is characterized by its very small or non-existent body, indicating that the opening and closing prices are essentially the same. This results in the formation of a short or non-existent body, with long upper and lower wicks. The doji represents market indecision, signaling a potential reversal or continuation of the current trend.
Doji candle helped me to predict a bearish reversal on USDJPY.
✅Trading Strategies with Doji Candlesticks
==============================================
1. Reversal Strategy: When a doji candle forms after a strong upward or downward trend, it can indicate market indecision and potential reversal. Traders can look for confirmation from other technical indicators or patterns to enter a trade in the opposite direction of the previous trend.
Example: After a prolonged uptrend, a doji candle forms, indicating indecision. Traders can wait for a bearish confirmation candle, such as a bearish engulfing pattern, before entering a short trade.
2. Continuation Strategy: Sometimes, a doji candle can signify a brief pause in the current trend before continuing in the same direction. Traders can wait for a break above or below the high or low of the doji to confirm the continuation of the trend.
Example: In a strong uptrend, a doji candle forms, indicating uncertainty. Traders can wait for a break above the high of the doji to enter a long trade, expecting the trend to continue.
3. Doji Patterns: Certain variations of the doji candle, such as the dragonfly doji, gravestone doji, or long-legged doji, carry their own specific implications based on their shape and position within the broader price action. Traders can develop specialized strategies based on these patterns.
Combining key levels and doji gives even more powerful confirmation
✅Conclusion
================
In conclusion, mastering the art of trading doji candlesticks in forex requires a deep understanding of their characteristics and the ability to integrate them into effective trading strategies. By incorporating doji candlesticks into their arsenal of technical tools, traders can gain valuable insights into market sentiment and improve their decision-making process.
By learning to recognize and interpret doji patterns, traders can enhance their ability to identify potential trend reversals and continuations, leading to more profitable trading outcomes. Incorporating the strategies outlined in this article, traders can leverage the power of doji candlesticks to gain an edge in their forex trading endeavors. Happy trading! 📊💰

AUD JPY Swing Buys Ask Me Live ($9K Banked)"Explore the intricacies of Forex trading with a focus on the AUD/JPY Buy Swing Position in my latest video - 'AUD JPY Fibonacci Entries Unveiled (Forex Trading).' 📈💹 Join me on a journey through the market nuances as I delve into the specific details of Fibonacci entries for this strategic swing position.
In this comprehensive guide, I unveil the power of Fibonacci retracement levels in navigating the AUD/JPY market. Discover the secrets to identifying optimal entry points and enhancing your trading precision. Whether you're a seasoned trader seeking advanced strategies or a beginner aiming to grasp the fundamentals, this video is tailored to elevate your trading game.
Don't miss the opportunity to fine-tune your skills and gain a competitive edge in the dynamic world of Forex trading. Subscribe, hit the notification bell, and let's master the markets together! 🌐✨ #ForexTrading #AUDJPY #FibonacciEntries #TradingStrategies #MarketAnalysis"

Risk Management vs. Time ManagementHey! Have you been spending day thinking about mistakes you made and things you didn't do?
Investors are knowingly comparing an exchanges to a casino. A gambler, losing, does not get up from the gambling table in the hope of winning back. He believes that the likelihood of winning increases with every lost bet. This phenomenon, called player mistake, is common among investors.
The pioneers of the theory of behaviour finance Hersh Shifrin and Meyer Statman showed in 1985 that investors intuitively misjudge the likelihood of repeating random results - they hold unprofitable positions too long, hoping for a return in prices, and close profitable positions too quickly, fearing that the movement will end.
The assertion that the market cannot fall for many sessions in a row is untenable. Short-term changes in asset prices are mostly random, notes analyst and author of several books on behaviour finance, James Montier, in his article Global equity strategy, gamblers fallacy. Tails does not become more probable after a series of heads, the coin has no memory - in the same way, the chances of success do not increase after a series of failures.
The major problem in the trading when we trying to recoup from losses. Many people make this mistake over and over again.
The reason of this mistake is the unwillingness to accept and calculate affordable losses and come to terms with the result, the wrong internal setting that you must end every trade and every trading session with a profit. But not every trade will be profitable.
How can I avoid this mistake?
1. After loss trade, tell yourself: "Stop, I won't trade now, I will pause."
2. Analyze the failed trade and write it down. Thus, you will allow yourself to "cool down" and more intelligently approach the situation on the market. There will always be opportunities, don't be afraid to miss out on any movement and profits.
3. Calmly develop a new trading plan based on market changes. If according to the trading plan you need to enter, then enter and earn. Do not rush to enter the market immediately, because it is easy to enter, but it is difficult to exit, since it is no longer possible to change the initial price at which you entered.
4. Make sure you following your risk management and always trade with possibility to lose.
Stay safe and good luck!

Strifor || Education: Break LevelHello traders❗️ This is Viktor and Strifor team❗️ We welcome you to our learning content, where we briefly talk about the main things and learn how to apply our knowledge in practical trading.
The topic of today's lesson is Break Level . So, let's see what it is☝️
❗️To get know more about levels support this video with a like and a comment, follow us and trade with us👍🚀

Don't jump early for this H&S pattern!Hello Traders
Our technical view has been shown in the chart.
If you like it then Support us by Like, Following, and Sharing.
Thanks For Reading
Team Fortuna
-RC
(Disclaimer: Published ideas and other Contents on this page are for educational purposes and do not include a financial recommendation. Trading is Risky, so before any action do your research.)

How I use ICT Discount And Premium Strategy For Forex TradingHow I use ICT Discount And Premium Strategy For Forex Trading.
In this video, I explained how I use ICT discount and premium levels for daily bias and also for intraday entry.
If you find this video helpful, give a thumb up, drop a comment, follow me for future updates and also share this video link on your social media timeline.

3 Types of Stop LossesToday’s topic is going to be on three types of stop losses . This is a very critical topic because stop losses come under the category of risk management.
Risk management is such a pivotal, important and critical topic. Why? Because professional traders and investors, the first thing that they always do and constantly think about before they get into a trade or investment is not how much profit they’re going to make, it’s how much they can afford to lose.
The only control that you have when you enter into a trade and you’re in the trade is the risk factor because most of us will not have the capital power to control that trade. It’s a collective pool of people’s thoughts and a lot of other factors that come in which then determines how the price moves in the market, especially how smart money enters the market actually. So in light of all of that, the real power that you have, the real control that you have is your risk management. How much you can afford to lose. In terms of that, we’re going to be looking at the three types of stop losses and how to stop your loss when the market does something which is not favourable to you and not in line with the direction of the trade that you are taking on.
The first type is what we call the technical stop . This is the one most people will be familiar with. That’s where all your different kinds of stop losses come under: moving averages, channels, trend lines and so forth. All these are summarised under technical stop losses. Even if you use tier based stop losses, they come under technical stop losses.
The second one is called a money stop . A money stop is basically one where you write in your rules, and this is how you execute a trade as well is that you say, for example, you enter a trade and it is going well in profit. You tell yourself to trail your stop loss to break even as soon as the trade is 3% in profit. You don’t care what the moving averages are or where the price pattern is whatsoever, you would just move your stop loss to break even. So that is purely based on money. That is called a money stop because the stop loss is adjusted according to your profits or your losses. Usually it’s to your profits – that’s when you trail and adjust your stop loss.
The final one is the time stop . As you’ve already guessed, the time stop is based on time. Especially for intra-day trading it’s very important because you know certain times of the day volume is really high and other times of the day volume starts to dry up. So especially if you want to capture a certain percentage of move, you want to capture it before a certain time and you usually know that after 5pm or 6pm the volume usually dries up. Price movement is not really that much especially towards 9pm. So you can have a rule saying, for example, at 5pm or 6pm you’ll look at exiting a trade if it’s not reached an objective. If you’re a swing trader you start saying things like you know if it’s consolidating for 10-15 days in a row I will possibly exit out of the trade. So all that is basically based on time.
Let me ask you a question. Out of all the three stops I’ve talked about: technical, money and time, what do you think is the strongest stop of them all? I think, if my guess is right as we have coached thousands of traders, most of them usually tell me it’s either the technical or the money stop. In fact, let me tell you Traders, the weakest one of them all is the money stop because there’s no basis for it. It’s just based on money and just trailing it. The strongest is the time stop because everything is determined on time and you’re time bound in everything that you do. If you look at daily activities: waking up, going to work, having meals, going to bed – your life is time bound.
Here’s the final most critical point. If you actually want to make your risk management really strong, the trick is not to put emphasis on either one of them according to strength, but to make them sync with each other so that they can then adapt to market conditions. It’s basically a confluence of the types of stop losses that can help you to generate the rules which can adapt to market conditions. For example, when you start out if you put in your initial stop loss in a technical place and as time then moves by then you would then get more aggressive with your stop loss and as it’s nearing towards exit, if you’ve reached a certain profit potential as the market price is still hovering around, losing momentum, then you would then start to go into money stop. Money stop is especially useful if you’re in swing trading. For example, when we took the DOW Jones trade and we took that 2,000 point move on a mismatched strategy when it had already done 80% of the move we used a money stop because we don’t want to give back all that profit back to the market. So that’s when we start to us a money stop and a combination of time stop, initially starting with a technical. So that’s how you do it.
Do have a good think about this because this is so critical Traders. If there’s only one thing you have total control of, it’s your stop loss, it’s your risk management. So contemplate this, revisit your strategy rules and see how you can optimise that for maximum performance of your strategy.
I believe that you have really enjoyed this topic and have some amazing value from this. Until the next time, as we always say, stay disciplined, follow your trading plan and keep trading like a master .

Target Reached! AUDJPY ReviewPrice reversed nicely from the 96.84 level we forecasted and dropped all the way down to the support target.
How did we manage to forecast this setup? Join Desmond as he breaks down the move.
Please be advised that the information presented on TradingView is provided to FXCM (‘Company’, ‘we’) by a third-party provider (‘Name of third party provider). Please be reminded that you are solely responsible for the trading decisions on your account. There is a very high degree of risk involved in trading. Any information and/or content is intended entirely for research, educational and informational purposes only and does not constitute investment or consultation advice or investment strategy. The information is not tailored to the investment needs of any specific person and therefore does not involve a consideration of any of the investment objectives, financial situation or needs of any viewer that may receive it. Kindly also note that past performance is not a reliable indicator of future results. Actual results may differ materially from those anticipated in forward-looking or past performance statements. We assume no liability as to the accuracy or completeness of any of the information and/or content provided herein and the Company cannot be held responsible for any omission, mistake nor for any loss or damage including without limitation to any loss of profit which may arise from reliance on any information supplied by Name of third party provider.
The speaker(s) is neither an employee, agent nor representative of FXCM and is therefore acting independently. The opinions given are their own, constitute general market commentary, and do not constitute the opinion or advice of FXCM or any form of personal or investment advice. FXCM neither endorses nor guarantees offerings of third party speakers, nor is FXCM responsible for the content, veracity or opinions of third-party speakers, presenters or participants.
High Risk Investment Warning
Trading Forex/CFDs on margin carries a high level of risk and may not be suitable for all investors. Leverage can work against you.
Forex Capital Markets Limited (www.fxcm.com):
CFDs are complex instruments and come with a high risk of losing money rapidly due to leverage. 71% of retail investor accounts lose money when trading CFDs with this provider. You should consider whether you understand how CFDs work and whether you can afford to take the high risk of losing your money.
FXCM EU LTD (www.fxcm.com):
CFDs are complex instruments and come with a high risk of losing money rapidly due to leverage. 75% of retail investor accounts lose money when trading CFDs with this provider. You should consider whether you understand how CFDs work and whether you can afford to take the high risk of losing your money.
FXCM Australia Pty. Limited (www.fxcm.com): **
Trading FX/CFDs carries significant risks. FXCM AU (AFSL 309763), please read the Financial Services Guide, Product Disclosure Statement, Target Market Determination and Terms of Business at www.fxcm.com
FXCM Markets LLC (www.fxcm.com):
Losses can exceed deposits.
