A better alternative to Fibonacci grid🙏🏻 Fibonacci based grid is a great inspiration from the Universe, but imo ain’t the final product, and here it is:
For traders
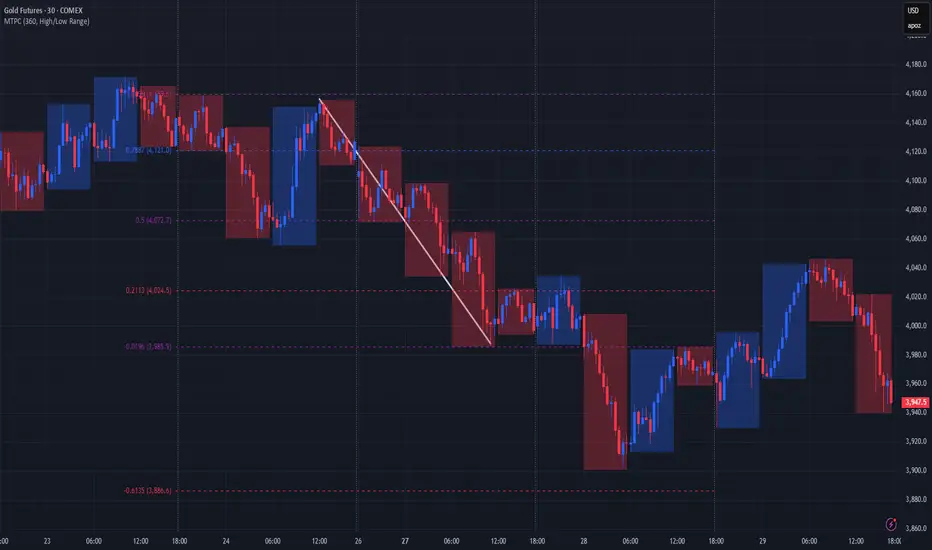
Use these values above and put em into grid tool here, and you’ll end up with uniform distribution based grid:
1.6134612334371357
1.0196152422706632
0.7886751345948129
0.5
0.21132486540518708
-0.019615242270663247
-0.6134612334371357
Then about how to apply it, you can divide trading activity by analytical units, these are in turn are based on:
^^ by price
^^ by time
^^ by signed volume waves/volume delta
Explanation
If you’ve followed my latest work you know I’ve identified a way to combine higher order moments to construct natural data driven estimates of data’s extremums and “ever possible” values (I still got no idea how no1 Ever posted it anywhere over the last centuries).
Now imagine you got only 2 input values: actual max and min (just like in Fibo grid, it ain’t knows nothing else). Given only these 2 values we can model stuff with uniform distribution that has precisely known values of standardized moments, so we end up with (and remember that uniform distro is symmetric around its mid, so all odd moments are zero):
dev = 1 / math.sqrt(12) //standard deviation
kurt = 1.8 //kurtosis (not excess ofc, the raw one)
hkurt = 27 / 7 //hyperkurtosis, 6th moment, raw af as well
0.5 + dev * hkurt
0.5 + dev * kurt
0.5 + dev
0.5
0.5 - dev
0.5 - dev * kurt
0.5 - dev * hkurt
And the resulting output of it u seen at the beginning of the post, notice how the edges *almost* match your lovely golden ratio.
For wanderers:
Now for the wanderers, creators etc etc etc
We might have a new math constant in our hands.
This can’t be a coincidence that limit levels (the ones at the edges) almost match the golden ratio . What if we find some kind of ‘almost’ uniform distro, where the limit levels would ‘exactly’ match the golden ratio? No problem - Beta distribution with parameters alpha = beta = (smth just a bit greater than 1).
I solved it numerically in python with mpmath library (necessary for high precision stuff, default packages are gonna truncate too much and we work with gamma functions there, high powers, huge numbers).
The following constant used as both parameters for Beta distribution provides us an almost uniform beautiful distro, with a minimal necessary deviation from uniform distro if u pls, just with a lil bit gently smoothed corners, and all connected to fibonacci sequence and golden ratio:
1.013156499304251804283836146883597463164059088989506487984660881392552993230097518061037104047261922219476043198153474114525730243848097530913517155085537693517359999905511951459927003624291626547046737804828112785002512650…
… and it goes on and on. I called it Sagitta constant, because visually it creates that beautiful almost flat shape, the minimal natural curvature. And now if we put this as c in Beta(c, c) following the same levels construction method from before we get these levels:
std = 0.28741741
K = 1.80628205
Hk = 3.88993123
0.5 + std * hk = 1.61803398
0.5 + std * k = 1.01915692
0.5 + std = 0.78741741
0.5 = 0.5
0.5 - std = 0.21258258
0.5 - std * k = -0.01915692
0.5 - std * hk = -0.61803398
Visuals, plots, graphics
^^ here you can see how our resulting distro & derivatives look like, kinda cute aye?
Beta(c, c), where c is our constant Sagitta, actually might be a natural prior for Bayesian stuff, almost a boxcar windowing function for DSP so u gonna tame that famous spectral leakage, or a kernel for KDE, like u name it, every case when u need a uniform shape yet with slightly relaxed endpoints, you can use it in design and architecture.
Go for it bros, test it in your R&D. Maybe some1 gonna use it to prove Riemann assumption conjecture , if u get dat milli send me 25% ima find a good use for it.
∞
Goldenratio
Pulse of an Asset via Fibonacci: TSLA at ATH Impulse Redux"Impulse" is a surge that creates "Ripples", like a pebble into water.
"Impulse Redux" is returning of wave to the original source of energy.
"Impulse Core" is the zone of maximum energy, in the Golden Pocket.
Are the sellers still there? Enough to absorb the buying power?
Reaction at Impulse is worth observing closely to gauge energy.
Rejection is expected on at least first approach if not several.
Part of my ongoing series to collect examples of my Methodology: (click links below)
Chapter 1: Introduction and numerous Examples
Chapter 2: Detailed views and Wave Analysis
Chapter 3: The Dreaded 9.618: Murderer of Moves
Chapter 4: Impulse Redux: Return to Birth place <= Current Example
Chapter 5: Golden Growth: Parabolic Expansions
Chapter 6: Give me a ping Vasili: one Ping only
.
.
Ordered Chaos
every Wave is born from Impulse,
like a Pebble into Water.
every Pebble bears its own Ripples,
gilded of Ratio Golden.
every Ripple behaves as its forerunner,
setting the Pulse.
each line Gains its Gravity.
each line Tried and Tested.
each line Poised to Reflect.
every Asset Class behaves this way.
every Time Frame displays its ripples.
every Brain Chord rings these rhythms.
He who Understands will be Humble.
He who Grasps will observe the Order.
He who Ignores will behold only Chaos.
Ordered Chaos
.
.
.
want to Learn a little More?
can you Spend a few Moments?
click the Links under Related.

Pulse of an Asset via Fibonacci: DAL Golden Genesis double top? This Concept is part of my study of Fibonacci Ratios applied to Assets.
This Chart captures the life of Delta Airlines ruled by the Golden Ratio.
This Post is to alert of possible double top and a reason for the last top.
The growth of anything in nature is choreographed by the Golden Ratio.
The growth of value or popularity of an asset is regulated by the same.
Imagine: "Each person that bought this, told on average 1.618 others".
The human collective as a whole must abide by the Golden Ratio.
The previous top was the top only because of the Golden Multiple.
The entire world is now very aware of this level, even the fib-blind.
.
Part of my Idea series collecting samples of my Methodology: (click links)
Chapter 1: Introduction and numerous Examples
Chapter 2: Detailed views and Wave Analysis
Chapter 3: The Dreaded 9.618: Murderer of Moves
Chapter 4: Impulse Redux: Return to Birth place
Chapter 5: Golden Growth: Parabolic Expansions <= Current Example
.
.
Ordered Chaos
every Wave is born from Impulse,
like a Pebble into Water.
every Pebble bears its own Ripples,
gilded of Ratio Golden.
every Ripple behaves as its forerunner,
setting the Pulse.
each line Gains its Gravity.
each line Tried and Tested.
each line Poised to Reflect.
every Asset Class behaves this way.
every Time Frame displays its ripples.
every Brain Chord rings these rhythms.
He who Understands will be Humble.
He who Grasps will observe the Order.
He who Ignores will behold only Chaos.
Ordered Chaos
.
.
.
want to Learn a little More?
can you Spend a few Moments?
click the Links under Related.

Pulse of an Asset via Fibonacci: NDX at ATH Impulse Redux"Impulse" is a surge that creates "Ripples", like a pebble into water.
"Impulse Redux" is returning of wave to the original source of energy.
"Impulse Core" is the zone of maximum energy, in the Golden Pocket.
Are the sellers still there? Enough to absorb the buying power?
Reaction at Impulse is worth observing closely to gauge energy.
Rejection is expected on at least first approach if not several.
Part of my ongoing series to collect examples of my Methodology: (click links below)
Chapter 1: Introduction and numerous Examples
Chapter 2: Detailed views and Wave Analysis
Chapter 3: The Dreaded 9.618: Murderer of Moves
Chapter 4: Impulse Redux: Return to Birth place <= Current Example
Chapter 5: Golden Growth: Parabolic Expansions
Chapter 6: Give me a ping Vasili: one Ping only
.
.
Ordered Chaos
every Wave is born from Impulse,
like a Pebble into Water.
every Pebble bears its own Ripples,
gilded of Ratio Golden.
every Ripple behaves as its forerunner,
setting the Pulse.
each line Gains its Gravity.
each line Tried and Tested.
each line Poised to Reflect.
every Asset Class behaves this way.
every Time Frame displays its ripples.
every Brain Chord rings these rhythms.
He who Understands will be Humble.
He who Grasps will observe the Order.
He who Ignores will behold only Chaos.
Ordered Chaos
.
.
.
want to Learn a little More?
can you Spend a few Moments?
click the Links under Related.
.

Pulse of an Asset ala Fibonacci: ETH at a key Impulse Redux"Impulse" is a surge that creates "Ripples", like a pebble into water.
"Impulse Redux" is returning of wave to the original source of energy.
"Impulse Core" is the zone of maximum energy, in the Golden Pocket.
Are the sellers still there? Enough to absorb the buying power?
Reaction at Impulse is worth observing closely to gauge energy.
Rejection is expected on at least first approach if not several.
Part of my ongoing series to collect examples of my Methodology: (click links below)
Chapter 1: Introduction and numerous Examples
Chapter 2: Detailed views and Wave Analysis
Chapter 3: The Dreaded 9.618: Murderer of Moves
Chapter 4: Impulse Redux: Return to Birth place <= Current Example
Chapter 5: Golden Growth: Parabolic Expansions
Chapter 6: Give me a ping Vasili: one Ping only
.
.
Ordered Chaos
every Wave is born from Impulse,
like a Pebble into Water.
every Pebble bears its own Ripples,
gilded of Ratio Golden.
every Ripple behaves as its forerunner,
setting the Pulse.
each line Gains its Gravity.
each line Tried and Tested.
each line Poised to Reflect.
every Asset Class behaves this way.
every Time Frame displays its ripples.
every Brain Chord rings these rhythms.
He who Understands will be Humble.
He who Grasps will observe the Order.
He who Ignores will behold only Chaos.
Ordered Chaos
.
.
.
want to Learn a little More?
can you Spend a few Moments?
click the Links under Related.

GOLDEN ZONE - FibonacciHello guys! Take a look at how smoothly the market respects the Golden Zone on Fibonacci retracement levels. The Golden Zone or Golden Ratio is the area between 50% and 61.8% on retracement levels, which acts as a strong support zone. After an impulse, on the correction the price usually gets rejected by this zone and it continues its previous trend. However, if it is broken, there is a high change of a trend reversal, as we can see in this chart.

FibonacciHello, Let us talk about 'Fibonacci.'
On this chart: You will read about where it came from? Why do we use it, and where does it help us.
Before we dive in to talk about Fibonacci Retracement levels and their use in trading, Let us talk about the origin of Fibonacci :
It all started with rabbits.
Yes, Rabbits!
Fibonacci became interested in a strange issue in 1202. He wanted to know the outcome if he had a pair of male and female rabbits and defined behavior for their offspring. The assumptions were as follows:
We have a pair of male and female rabbits that have just been born.
Rabbits mature after one month.
The gestation period of rabbits is one month.
When a female rabbit reaches puberty, she must become pregnant.
At each pregnancy, the female rabbit gives birth to one male rabbit and one female rabbit.
Rabbits never die.
Calculate how many pairs of this type of rabbit we will have after n months?
In mathematics, the Fibonacci sequence or series is the following infinite sequence of natural numbers:
0,1,1,2,3,5,8,13,21,34,55,89,144,233,377,610,987,1597,...
Take a look at this GIF, to get an idea of this infinite sequence:
drive.google.com
The Fibonacci spiral: an estimate of the golden spiral generated by drawing circular arcs attaching the facing corners of the squares adjusted to the values of the sequence; by successively attaching squares of side 0, 1, 1, 2, 3, 5, 8, 13, 21 and 34.
The sequence begins with the numbers 0 and 1; "each term is the total of the past two" is the recurrence relation that defines it.
The elements of this sequence are called Fibonacci children. Leonardo de Pisa described this sequence in Europe, a 13th-century Italian mathematician also known as Fibonacci. It has numerous applications in computer science, mathematics, and game theory. It also appears in biological configurations, such as in the branches of trees, in the arrangement of leaves on the stem, in the flowers of artichokes and sunflowers, in the inflorescences of Romanesco broccoli, in the configuration of coniferous conifers. In the reproduction of rabbits and in how DNA encodes the growth of complex organic forms. Similarly, it is found in the spiral structure of the shell of some mollusks, such as the nautilus.
Leonardo Pisano, Leonardo de Pisa, or Leonardo Bigollo, also known as Fibonacci, was born in 1170 and died in 1240. Long before being known in the West, the Fibonacci sequence was already described in mathematics in India in connection with the Sanskrit prosody.
Susantha Goonatilake notes that the development of the Fibonacci sequence "is attributed in part to Pingala (year 200), later associated with Virahanka (about 700), Gopāla (about 1135) and Hemachandra (about 1150)". Parmanand Singh cites Pingala (around 450) as a forerunner in the discovery of the sequence.
Now let us talk about Fibonacci in the finance world. You might use it too, as Fibonacci Retracement Levels. (As you see on the chart)
The second law of technical analysis indicates that values move in trends, bullish or bearish. Once a trend has given sufficient signs of termination, either by breaking its trend line, confirmation of a trend reversal figure or any other valid factor according to technical analysis theory, the analyst contemplates the possibility of a setback. A pullback represents, in simple terms, a move in the opposite direction to the past trend. It can take the form of a crash in price after a bullish move or a rebound in price after a downtrend. Although the first could properly be called a retracement and the second rebound or rally, technically, the term retracement includes both.
Within technical analysis, Fibonacci retracements refer to the possibility that the price of a financial asset will retrace a considerable portion of the original movement and find support or resistance levels at the levels set by the Fibonacci numbers before continuing. The above address. These levels are constructed by drawing a trend line between the extreme points of the movement in question and applying the critical percentages of 23%, 38.2%, 61.8%, 76.8%, and 100% to the vertical distance.
Fibonacci retracements are used to confirm suspicions of a market movement. Levels of support and resistance can indicate possible bullish or bearish market trends and indicate to people when is the best time to open long or short positions. This means that Fibonacci retracements can be highly fulfilling for people who know when to use them correctly.
Upon confirmation of rejection in the price, we will try to calculate the probable magnitude of the movement. In order to achieve this, specific percentages collected from the Fibonacci series are applied to the total magnitude of the previous trend. The percentages used are as follows:
61.8%: Also recognized as the Golden Ratio, or golden number, it is the limit of the result obtained from the division of an element of the Fibonacci series by the following number, as the series tends to infinity.
38.2%: It is obtained by subtracting 61.8% from the unit (1.000 - 0.618)
100.%: Equivalent to the total magnitude of the primary trend.
Reversal percentages should be calculated after the end of a trend has been confirmed, never while the trend continues.
Considering that trends are always part of a longer-term trend and, in turn, are made up of shorter-term trends, the question on which of these trends should be calculated as setbacks? There might not be a simple answer. We must calculate the setbacks on that trend that has given clear signs of termination in general terms.
A weak trend may have a 31.8% retracement, while a powerful trend may have a 61.8% retracement before returning to its original direction.
Some sources mention a critical zone of 33 to 38.2% and 61.8 to 67% instead of specific levels.
Fibonacci retracements form an essential part of the Elliott Wave Theory.
The most scathing criticisms against Fibonacci retracements are based on the random walk theory, arguing that there is no justification for assuming that price action has any reason to respect predetermined retracement levels.
However, it is not suitable to use Fibonacci retracement all the time. There are a few downsides too:
Fibonacci retracement shows only static price levels. It is unlikely to say that a specific cryptocurrency price will not pass or stay below predicted levels.
Many external factors determine the price of a coin. They have to be taken into account when determining trading decisions.
Fibonacci retracement levels are close to each other, so it is challenging for a professional trader to determine the accuracy from which to predict the value of a particular coin in the future.
Suppose you're interested in using this great indicator. In that case, you can simply go on your TradingView chart and the dashboard, click on 'Indicators & Strategies' and search for Fibonacci and find the best one suited for you.
Have you ever used this indicator? What do you think the pros and cons are?
Let me know your ideas.
Good luck.

Pulse of an asset via Fibonacci: SPX true 4.236 correction done?"Impulse" is a surge that creates "Ripples", like a pebble into water.
Each of the Ripples has precise bounds defined by the "Golden Ratio".
Until a new Impulse occurs, the Price oscillates within "Energy Bands".
The Golden Ratio is the underlying building block of the entire Universe.
From the Arms of a Spiral Galaxy, to the Bones of Your Fingers, it's in there.
If there IS a God, then we will surely find Him/Her/It thru the Golden Ratio.
Shown here is the SP500 Index, and the correction started by a Covid variant.
500 large companies, each with hundreds of variables, worth trillions of dollars.
Yet, the "Answer" to that ridiculously complicated equation is "The Golden Ratio".
4.236 is the most common wave endpoint, so the correction may well be done.
The numerous "Pings" along the wave front confirm the validity of the fib series.
The "Impulse Core" (the golden pocket) will be the strongest resistance in this area.
.
My TV collection of ideas detailing the Concepts:
Chapter 1: Introduction and numerous Examples
Chapter 2: Detailed views and Wave Analysis
Chapter 3: The Dreaded 9.618: Murderer of Moves
Chapter 4: Impulse Redux: Return to Birth place
Chapter 5: Golden Growth: Parabolic Expansions
Chapter 6: Give me a ping Vasili: 'one' Ping only
.

Fibonacci Retracement and Extensions Imagine a Box that's being fired everytime market makes a swing.
Multiples of boxes of bear/bull. That is what fib is 0 to 1.
Many people say "So its going to go up or So its going to go down?" well answer to that is BOTH.
They are always fighting and more often than naught one will break and other one will move on to its multiplier.
Pretty simple and powerful stuff.

Grow Fast 100 000$, Grow Slower 300 000$Golden Ratio shows us that those targets are possible.
If Bitcoin grows not too fast that gives opportunity for the target lines to go up. Therefore I welcome the price corrections on the way. Price corrections allow for an higher all time high.

Trend Trading Techniques and Strategy!!! In a strong trending market, it is important to find entries at the high probability zones i.e. Fib Retracements. Ideally within the .382 - .618 zones. It may be tempting to enter the market during a period of strong momentum, but itmust be known that every strong trend contains correction phases, this is where you capitalise on the trend momentum. Entering the market mid-impulse can work occasionally and can be misleading to the beginner trader, over a long period of time this just wont work(All profitablilty and success of a trader comes from a long period of trades/ time trading, one trade does not determine success). Once price has corrected to the ideal Fib zone, you can now look for an entry setup to capitalise on the potential momentum shift and continuation of impulse.

Bitcoin : The beauty of Golden ratioHello fellas, welcome to the another day of the uncertainty and flatness for bitcoin. As a mother of all cryptocurrency, it's very tense that the price is moving with a lot of uncertainty and doubt. Now, I want to acknowledge you all with my current bitcoin bias which is very important.
First of all, I want to explain about the golden pocket. The golden pocket is the area between the .618 -.65 on fibonacci retracement. And the .618 itself is also called golden ratio, It appears many times in geometry, art, architecture and other areas including trading. Whenever the price is touching this golden ratio zone, you must respect it as a major support or resistance because that's how trading work. You can't go against this golden ratio otherwise you'll keep losing.
On the chart attached, we can see that on current down trend moves, there are 3 impulses moves and 3 corrective moves. On every impulse moves, I give the series of swing high and swing low, This labeled point is where I connect the fibonacci retracement to measure the corrective wave target. And on the 1st and the 2nd corrective waves, the top of corrective waves end up with a wick at these golden pocket range! is that a coincident? very interesting!
Now, I want to show you at the 3rd series of impulse and corrective waves, It's where we are right now. The golden pocket zone is above the white resistance trend line. But, current price action shows us there are a lot of uncertainty and fear which make the bulls losing momentum slowly. The corrective waves 3 is trending slightly below 0.5 fibonacci retracement level. But, there is still opportunity for the price to have a spike to golden pocket zone although relatively small.
The consequence if the price fails to break this 0.5 fib levels as resistance, we might see a horrific down trend moves and potential lower low. This is simply because we see the bear are in complete control over the market with the momentum of correction wave is diminishing from .618 to .5 fibonacci level.
I just can say, stay away from bitcoin right now. Longing at resistance is not a good idea, but shorting without the confirmation of lower L and lower H clearly is not wise. Although I'm on bearish sight, I'm still lack of confidence to open any position right now.

A peek into the pastMATICBTC neatly moved in a Fibonacci Channel and fell down to 100% bottom of that channel.
Two detectors predicted the top
Golden Ratio Top Detector (UO_GRFM)
Mayer Multiple
Golden Ratio Top Detector also showed the potential bottom correctly.
Future? As long as it coasts above SMA350/6h, I will consider it a bullish opportunity and keep collecting.
Also note that is about to jump to an upper Fibonacci channel(78.60%) from 100% channel-- very bullish if this happens

Golden Fibonacci Sum - 2.618Golden ratio (Phi is an important number). Phi (1.618) has interesting properties that are commonly found in markets. Today we will have a closer look at the golden sum, it's lesser known (don't find too much about it) and can be calculated by taking sum and multiply it again with 0.618, in this way the golden sum will grow to it's limit of 2.618 as the extensions become smaller and smaller from the initial 1 length.
Mathematically the sum can be calculated with the following additions:
initial length = 1
0.618*1 = 0.618
0.618*0.618 = 0.382
0.618*0.382 = 0.236
0.618*0.236 = 0.1458
0.618*0.1458 = 0.090
... to infinity ...
___________________+
2.618
Hopefully you will find more meaning in the number 2.618 after this explanation and find it more significant in your trades.
-TheTrex
