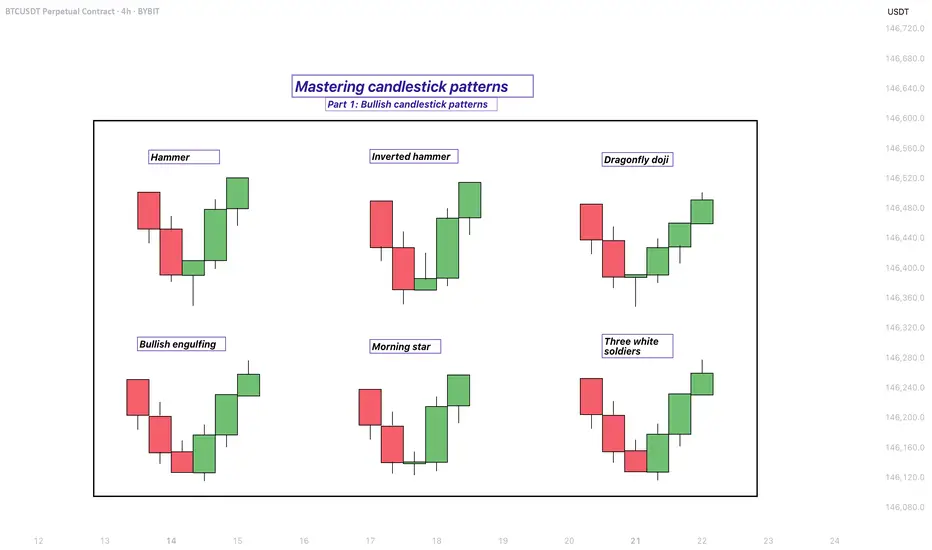
Mastering bullish candlestick patterns - How to use it!In this guide, we will explore some of the most important bullish candlestick patterns used in technical analysis. These patterns are essential tools for traders and investors who want to better understand market sentiment and identify potential reversal points where prices may start moving upward.
What will be explained:
- What are bullish candlestick patterns?
- What is the hammer?
- What is the inverted hammer?
- What is the dragonfly doji?
- What is the bullish engulfing?
- What is the morning star?
- What is the three white soldiers?
- How to use bullish candlestick patterns in trading?
What are bullish candlestick patterns?
Bullish candlestick patterns are specific formations on a candlestick chart that signal a potential reversal from a downtrend to an uptrend. These patterns are used by traders and investors to identify moments when the market sentiment may be shifting from bearish to bullish. Recognizing these patterns can help traders time their entries and make more informed decisions based on price action and market psychology. While no single pattern guarantees success, they can provide valuable clues when combined with other forms of analysis such as support and resistance, trendlines, and volume.
What is the Hammer?
The Hammer is a single-candle bullish reversal pattern that typically appears at the bottom of a downtrend. It has a small real body located at the upper end of the trading range, with a long lower shadow and little to no upper shadow. The long lower wick indicates that sellers drove the price lower during the session, but buyers stepped in strongly and pushed the price back up near the opening level by the close. This shift in momentum suggests that the downtrend could be coming to an end, and a bullish move might follow.
What is the Inverted Hammer?
The Inverted Hammer is another single-candle bullish pattern that also appears after a downtrend. It has a small body near the lower end of the candle, a long upper shadow, and little to no lower shadow. This pattern shows that buyers attempted to push the price higher, but sellers managed to bring it back down before the close. Despite the failure to hold higher levels, the buying pressure indicates a possible reversal in momentum. Traders usually look for confirmation in the next candle, such as a strong bullish candle, before acting on the signal.
What is the Dragonfly Doji?
The Dragonfly Doji is a special type of candlestick that often indicates a potential bullish reversal when it appears at the bottom of a downtrend. It forms when the open, high, and close prices are all roughly the same, and there is a long lower shadow. This pattern shows that sellers dominated early in the session, pushing prices significantly lower, but buyers regained control and drove the price back up by the end of the session. The strong recovery within a single period suggests that the selling pressure may be exhausted and a bullish reversal could be imminent.
What is the Bullish Engulfing?
The Bullish Engulfing pattern consists of two candles and is a strong indication of a reversal. The first candle is bearish, and the second is a larger bullish candle that completely engulfs the body of the first one. This pattern appears after a downtrend and reflects a shift in control from sellers to buyers. The bullish candle’s large body shows strong buying interest that overpowers the previous session’s selling. A Bullish Engulfing pattern is even more significant if it occurs near a key support level, and it often signals the beginning of a potential upward move.
What is the Morning Star?
The Morning Star is a three-candle bullish reversal pattern that occurs after a downtrend. The first candle is a long bearish one, followed by a small-bodied candle (which can be bullish, bearish, or a doji), indicating indecision in the market. The third candle is a strong bullish candle that closes well into the body of the first candle. This formation shows a transition from selling pressure to buying interest. The Morning Star is a reliable signal of a shift in momentum, especially when confirmed by high volume or a breakout from a resistance level.
What is the Three White Soldiers?
The Three White Soldiers pattern is a powerful bullish reversal signal made up of three consecutive long-bodied bullish candles. Each candle opens within the previous candle’s real body and closes near or at its high, showing consistent buying pressure. This pattern often appears after a prolonged downtrend or a period of consolidation and reflects strong and sustained buying interest. The Three White Soldiers suggest that buyers are firmly in control, and the market may continue moving upward in the near term.
How to use bullish candlestick patterns in trading?
To effectively use bullish candlestick patterns in trading, it’s important not to rely on them in isolation. While these patterns can signal potential reversals, they work best when combined with other technical tools such as support and resistance levels, moving averages, trendlines, and volume analysis. Traders should also wait for confirmation after the pattern forms, such as a strong follow-through candle or a break above a resistance level, before entering a trade. Risk management is crucial—always use stop-loss orders to protect against false signals, and consider the broader market trend to increase the probability of success. By integrating candlestick analysis into a comprehensive trading strategy, traders can improve their timing and increase their chances of making profitable decisions.
Thanks for your support. If you enjoyed this analysis, make sure to follow me so you don't miss the next one. And if you found it helpful, feel free to drop a like 👍 and leave a comment 💬, I’d love to hear your thoughts!
Hammer
What Is the Hanging Man Candlestick Pattern: Meaning & Trading?What Is the Hanging Man Candlestick Pattern, and How Can You Trade It?
In the world of technical analysis, candlestick patterns play a vital role in helping traders decipher market trends and potential reversals. Among the many setups, the hanging man holds particular significance. This distinctive formation captures traders' attention as it often serves as a warning sign of a possible trend reversal. This article will go through the technical analysis of the hanging man formation and explain how traders can trade with it.
What Is a Hanging Man Pattern?
The hanging man candlestick pattern is characterised by a small body near the top of the candlestick, a long lower shadow, and little to no upper shadow. It resembles a figure hanging from its head, hence the name "Hanging Man."
Psychology Behind the Hanging Man
The psychology behind the hanging man candlestick pattern reflects a shift in market sentiment. After a sustained uptrend, the appearance of this pattern indicates that buyers are losing momentum. The long lower shadow shows that sellers were able to push prices down significantly during the trading session. Although buyers managed to drive prices back up, the close near the open price suggests weakening bullish sentiment. This pattern signals that selling pressure is increasing, potentially leading to a bearish reversal as confidence among buyers diminishes.
The hanging man is a versatile formation that can be applied across a wide range of financial instruments, including stocks, cryptocurrencies*, ETFs, indices, and forex, on different timeframes.
Identifying a Hanging Man Candlestick on Trading Charts
To spot a hanging man pattern in stocks and other financial instruments, you may follow these key steps:
Look for an existing uptrend: Start by identifying a prevailing upward price movement on the chart.
Locate a candlestick with specific characteristics: Search for a candlestick with a small body near the top, a long lower shadow, and little to no upper shadow. This formation resembles a figure hanging from its head. The colour of the candle doesn’t matter, but if it’s bearish, the signal is stronger.
Consider supporting indicators: Utilise other technical indicators or oscillators to further validate the potential reversal. These can include trendlines, moving averages, or momentum indicators that align with the bearish interpretation.
Note that there is no such thing as an inverted hanging man candlestick or a bullish hanging man candlestick pattern.
Trading the Hanging Man Pattern
Those trading the hanging man reversal pattern need to apply a systematic approach in order to increase the likelihood of successful trades. Here are a few steps traders usually follow to trade this pattern:
- Identification: Identify the setup by using the steps mentioned above.
- Look for confirmation signals: The setup alone is not sufficient for making trading decisions. Seek additional confirmation through subsequent candlestick patterns or technical indicators. This can include bearish candlestick patterns (e.g. bearish engulfing or shooting star), a breach of support levels, or the convergence of other indicators signalling a potential reversal.
- Define your entry point: An entry point can be either when the next candlestick confirms the bearish sentiment or when the price breaches a significant support level.
- Consider risk management: Assess the risk-reward ratio of the trade and ensure it aligns with your risk tolerance. For efficient risk management, you may adjust your position size accordingly. Risk management tools like position sizing, setting stop-loss orders, and diversification may help protect your capital. You may set a stop-loss order above the hanging man pattern to limit potential losses if the trade goes against you.
- Identify profit targets: The candlestick itself doesn't provide specific targets. Traders can identify profit targets by looking at previous support levels, Fibonacci retracement levels, or other technical analysis tools like moving averages or pivot points.
- Monitor the trade: Keep a close eye on your position as it progresses. Pay attention to any changes in market conditions or additional signals that may invalidate the trade.
- Learn from outcomes: Regardless of the outcome of the trade, analyse it afterwards to identify areas for improvement. Assess whether the setup provided accurate signals and identify any factors that may have affected its success. This analysis will help refine your trading strategy over time.
Live Market Example
Consider the example of a hanging man on the forex USDJPY pair. An entry is placed on the next bearish candlestick with a stop loss just above the hanging man. The take profit order is at the next level of support marked by the orange line.
Limitations of the Hanging Man Candlestick
The hanging man candlestick pattern, while useful, has certain limitations that traders need to consider:
- False Signals: The hanging man can produce false signals, especially in volatile markets where price movements are erratic.
- Market Context: The effectiveness of the pattern varies depending on the broader market context and prevailing trends.
- Timeframe Sensitivity: Its reliability can differ across various timeframes; what works on a daily chart may not be as effective on an intraday chart.
- Not Standalone: It should not be used in isolation but as part of a comprehensive trading strategy that includes other indicators and risk management tools.
Comparing the Hanging Man to Similar Candles
Understanding how the hanging man pattern differs from similar candlestick patterns helps in accurate technical analysis. Here's a brief comparison of the hanging man with related patterns.
What Is the Difference Between a Hanging Man and a Hammer?
Both have the same candle structure. However, the hanging man candlestick occurs in an uptrend and signals a potential bearish reversal, while the hammer occurs in a downtrend, indicating a potential bullish reversal. Interestingly, it is possible to see a hanging man candlestick in a downtrend, often as part of a bullish retracement. Both candles require confirmation from subsequent price movements. They should be analysed within the context of the overall market trend and other technical indicators.
What Is the Difference Between a Pin Bar and a Hanging Man?
A pin bar and a hanging man are both single-candlestick patterns with small bodies and long shadows, but they serve different purposes in technical analysis. The pin bar has a small body and a long tail, indicating a reversal, but it can appear in any market condition. Its long tail shows a strong rejection of a certain price level, with the body pointing in the direction of the anticipated reversal.
The hanging man, however, specifically occurs after an uptrend and signals a potential bearish reversal, characterised by a small body at the top and a long lower shadow, indicating selling pressure.
What Is the Difference Between a Shooting Star and a Hanging Man Candlestick?
The shooting star and the hanging man are both bearish reversal patterns, but they differ in their appearance and context. A shooting star occurs after an uptrend and features a small body at the bottom with a long upper shadow, indicating that the price was pushed up significantly but fell back down, showing strong selling pressure.
The hanging man also appears after an uptrend but has a small body at the top with a long lower shadow, suggesting that sellers dominated the session despite an initial push by buyers. Both require confirmation from subsequent candlesticks to validate the reversal.
Final Thoughts
While the hanging man alone is insufficient for making trading decisions, it serves as a warning signal that buyers may be losing control and that selling pressure could increase. Traders seek additional confirmation through subsequent candlestick patterns, support and resistance levels, and other technical indicators to validate the potential reversal.
By understanding the implications of the setup within the broader market context and employing proper risk management strategies, traders can enhance their decision-making process and improve their chances of identifying different trading opportunities.
FAQ
What Does the Hanging Man Pattern Indicate?
The hanging man trading pattern in technical analysis typically indicates a potential trend reversal in an uptrend. It suggests that the buyers, who have been driving the market higher, are losing control, and the selling pressure may increase.
The hanging man is represented by a small body near the top of the candlestick, a long lower shadow, and little to no upper shadow. It resembles a figure hanging by the neck. This visual representation conveys the potential bearish sentiment.
Can a Hanging Man Candle Be Bullish?
No, there is no such thing as a bullish hanging man candlestick pattern. The bearish hanging man pattern indicates a potential trend reversal from an uptrend to a downtrend.
Is the Hanging Man Pattern Reliable?
The reliability of the formation, like any candlestick pattern, can vary depending on several factors. While the setup is widely recognised and considered a potential bearish reversal signal, it should not be relied upon as the sole basis for trading decisions. It is crucial to consider other factors and confirmation signals to increase its reliability.
What Is the Confirmation Candle for the Hanging Man?
A confirmation candle for the hanging man is a bearish candlestick that follows the pattern, confirming the reversal. This can include a bearish engulfing candle or a candlestick closing well below the hanging man's body, indicating increased selling pressure.
Is the Hanging Man Pattern Bearish?
Yes, it is generally considered a bearish pattern in technical analysis. It is formed when the price’s open or close is near or at its high, there is a significant decline during the trading session, and it closes not far from the opening price. The pattern resembles a hanging man with his legs dangling.
*Important: At FXOpen UK, Cryptocurrency trading via CFDs is only available to our Professional clients. They are not available for trading by Retail clients. To find out more information about how this may affect you, please get in touch with our team.
This article represents the opinion of the Companies operating under the FXOpen brand only. It is not to be construed as an offer, solicitation, or recommendation with respect to products and services provided by the Companies operating under the FXOpen brand, nor is it to be considered financial advice.

Mastering Candlestick Patterns - How to use them in trading!Introduction
Candlesticks are one of the most popular and widely used tools in technical analysis. They offer a visual representation of price movements within a specific time period, providing valuable insights into market trends, sentiment, and potential future price movements.
Understanding candlestick patterns is crucial for traders, as these formations can indicate whether a market is bullish or bearish, and can even signal potential reversals or continuations in price. While candlesticks can be powerful on their own, trading purely based on candlestick patterns can be challenging and risky.
-----------------------------------------------------------------------------------------------
What are we going to discuss:
1. What are candlesticks?
2. What are bullish candlestick patterns?
3. What are bearish candlestick patterns?
4. How to use candlestick patterns in trading?
-----------------------------------------------------------------------------------------------
1. What are candlesticks?
A candlestick in trading is a visual representation of price movement in a specific time period on a chart. It is a fundamental element used in technical analysis to study market trends, determine price levels, and predict potential future price movements. A single candlestick consists of four main components: the open, close, high, and low prices for that time period.
Here’s how a candlestick works:
- The Body: The rectangular area between the open and close prices. If the close is higher than the open, the body is green, indicating a bullish (upward) movement. If the close is lower than the open, the body is red, signaling a bearish (downward) movement.
- The Wick (high and low of the candle): The thin lines extending above and below the body. These represent the highest and lowest prices reached during the period. The upper wick shows the highest price, while the lower wick shows the lowest price.
- The Open Price: The price at which the asset began trading in that time period (for example, the start of a day, hour, or minute depending on the chart timeframe).
- The Close Price: The price at which the asset finished trading at the end of the period.
-----------------------------------------------------------------------------------------------
2. What are bullish candlestick patterns?
What is a Hammer Candlestick Pattern?
A hammer candlestick pattern has a small body near the top of the candle and a long lower wick, typically two to three times the length of the body. There is little to no upper wick. This formation shows that during the trading session, sellers managed to push the price significantly lower, continuing the downward momentum. However, buyers eventually stepped in with strong demand and drove the price back up near the opening level by the close.
What is an Inverted Hammer?
An inverted hammer has a small body near the bottom of the candle with a long upper wick, usually at least two to three times the size of the body, and little to no lower wick. This unique shape resembles an upside-down hammer, hence the name.
What is a Dragonfly Doji?
A dragonfly doji has a unique shape where the open, close, and high prices are all at or very close to the same level, forming a flat top with a long lower wick and little to no upper wick. This gives the candle the appearance of a "T," resembling a dragonfly.
What is a Bullish Engulfing?
A bullish engulfing candlestick consists of two candles. The first candle is bearish, indicating that sellers are still in control. The second candle is a large bullish candle that completely engulfs the body of the first one, meaning it opens below the previous close and closes above the previous open. This pattern reflects a clear shift in market sentiment. During the second candle, buyers step in with significant strength, overpowering the previous selling pressure and reversing the momentum. The fact that the bullish candle completely engulfs the previous bearish candle indicates that demand has taken over, signaling a potential trend reversal.
What is a Morning Star?
The morning star consists of three candles. The first is a long bearish candle, indicating that the downtrend is in full force, with strong selling pressure. The second candle is a small-bodied candle, which can be either bullish or bearish, representing indecision or a pause in the downtrend. Often, the second candle gaps down from the first, indicating that the selling pressure is subsiding but not yet fully reversed. The third candle is a long bullish candle that closes well above the midpoint of the first candle, confirming that buyers have taken control and signaling the potential start of an uptrend.
-----------------------------------------------------------------------------------------------
3. What are bearish candlestick patterns?
What is a Shooting Star?
A shooting star has a smal body near the low of the candle and a long upper wick, usually at least twice the size of the body, with little to no lower wick. This shape shows that buyers initially pushed the price higher during the session, continuing the upward momentum. However, by the close, sellers stepped in and drove the price back down near the opening level.
What is a Hanging Man?
A hanging man has a distinct shape, with a small body positioned near the top of the candle and a long lower wick, usually at least twice the length of the body. There is little to no upper wick. The appearance of this candle suggests that although there was strong selling pressure during the session, buyers managed to bring the price back up near the opening level by the close. Despite the recovery, the long lower wick shows that sellers were able to push the price down significantly at one point. This introduces uncertainty into the uptrend and can indicate that bullish momentum is weakening.
What is a Gravestone Doji?
A gravestone doji has a distinctive shape where the open, low, and close prices are all at or near the same level, forming a flat base. The upper wick is long and stretches upward. This shape resembles a gravestone, which is where the pattern gets its name.
What is a Bearish Engulfing?
A bearish engulfing candlestick pattern is a two-candle reversal pattern that typically appears at the end of an uptrend and signals a potential shift from bullish to bearish sentiment. The first candle is a smaller bullish candle, reflecting continued upward momentum. The second candle is a larger bearish candle that completely engulfs the body of the first one, meaning it opens higher than the previous close and closes lower than the previous open. This indicates that bears have taken control, overpowering the buyers, and suggests a potential downside movement.
What is an Evening Star?
An evening star is a bearish candlestick pattern that typically signals a potential reversal at the top of an uptrend. It consists of three candles and reflects a shift in momentum from buyers to sellers. The pattern starts with a strong bullish candle, showing continued buying pressure and confidence in the upward move. This is followed by a smaller-bodied candle, which can be bullish or bearish, and represents indecision or a slowdown in the uptrend. The middle candle often gaps up from the first candle, showing that buyers are still trying to push higher, but the momentum is starting to weaken. The third candle is a strong bearish candle that closes well into the body of the first bullish candle. This candle confirms that sellers have taken control and that a trend reversal could be underway. The more this third candle erases the gains of the first, the stronger the reversal signal becomes.
-----------------------------------------------------------------------------------------------
4. How to use candlestick patterns in trading?
Candlestick patterns are most useful when they appear at key levels, such as support, resistance, or significant trendlines. For instance, if a bullish reversal pattern like a hammer or bullish engulfing forms at a support level, it may indicate that the downtrend is losing momentum, and a reversal could be coming.
Trading based on candlestick patterns alone can be risky. To improve your chances of success, always seek additional confirmation from other technical analysis tools. Here are some common ones:
- Support and Resistance Levels: Look for candlestick patterns that form near key support or resistance levels. For instance, if the price reaches a support zone and a bullish reversal candlestick pattern forms, this may suggest a potential upward reversal.
- Fibonacci Retracement: Use Fibonacci levels to identify potential reversal zones. If a candlestick pattern appears near a key Fibonacci level (such as the Golden Pocket), it adds confirmation to the idea that the price may reverse.
- Liquidity Zones: These are areas where there is a high concentration of buy or sell orders. Candlestick patterns forming in high liquidity zones can indicate a stronger potential for a reversal or continuation.
- Indicators and Oscillators: Incorporating indicators like the Relative Strength Index (RSI), Moving Averages, MACD, or Stochastic RSI can help confirm the momentum of the price. For example, if a candlestick pattern forms and the RSI shows an oversold condition (below 30), this could indicate a potential reversal to the upside.
It’s crucial to wait for confirmation before entering a trade. After a candlestick pattern forms, it’s important to wait for the next candle or price action to confirm the signal. For example, if you spot a bullish reversal candlestick like a hammer at support, wait for the next candle to close above the hammer’s high to confirm that buyers are in control and a reversal is likely.
-----------------------------------------------------------------------------------------------
Thanks for your support.
- Make sure to follow me so you don't miss out on the next analysis!
- Drop a like and leave a comment!

Mastering Candlestick Patterns: Visual Guide for Traders
🔵 Introduction
Candlestick charts are among the most popular tools used by traders to analyze price movements. Each candlestick represents price action over a specific time period and provides valuable insights into market sentiment. By recognizing and understanding candlestick patterns, traders can anticipate potential price reversals or continuations, improving their trading decisions. This article explains the most common candlestick patterns with visual examples and practical Pine Script code for detection.
🔵 Anatomy of a Candlestick
Before diving into patterns, it's essential to understand the components of a candlestick:
Body: The area between the open and close prices.
Upper Wick (Shadow): The line above the body showing the highest price.
Lower Wick (Shadow): The line below the body showing the lowest price.
Color: Indicates whether the price closed higher (bullish) or lower (bearish) than it opened.
An illustrative image showing the anatomy of a candlestick.
🔵 Types of Candlestick Patterns
1. Reversal Patterns
Hammer and Hanging Man: These single-candle patterns signal potential reversals. A Hammer appears at the bottom of a downtrend, while a Hanging Man appears at the top of an uptrend.
Engulfing Patterns:
- Bullish Engulfing: A small bearish candle followed by a larger bullish candle engulfing the previous one.
- Bearish Engulfing: A small bullish candle followed by a larger bearish candle engulfing it.
Morning Star and Evening Star: These are three-candle reversal patterns that signal a shift in market direction.
Morning Star: Occurs at the bottom of a downtrend, indicating a potential bullish reversal. It consists of:
- A long bearish (red) candlestick showing strong selling pressure.
- A small-bodied candlestick (bullish or bearish) indicating indecision or a pause in selling. This candle often gaps down from the previous close.
- A long bullish (green) candlestick that closes well into the body of the first candle, confirming the reversal.
Evening Star: Appears at the top of an uptrend, signaling a potential bearish reversal. It consists of:
- A long bullish (green) candlestick showing strong buying pressure.
- A small-bodied candlestick (bullish or bearish) indicating indecision, often gapping up from the previous candle.
- A long bearish (red) candlestick that closes well into the body of the first candle, confirming the reversal.
2. Continuation Patterns
Doji Patterns: Candles with very small bodies, indicating market indecision. Variations include Long-Legged Doji, Dragonfly Doji, and Gravestone Doji.
Rising and Falling Three Methods: These are five-candle continuation patterns indicating the resumption of the prevailing trend after a brief consolidation.
Rising Three Methods: Occurs during an uptrend, signaling a continuation of bullish momentum. It consists of:
- A long bullish (green) candlestick showing strong buying pressure.
- Three (or more) small-bodied bearish (red) candlesticks that stay within the range of the first bullish candle, indicating a temporary pullback without breaking the overall uptrend.
- A final long bullish (green) candlestick that closes above the high of the first candle, confirming the continuation of the uptrend.
Falling Three Methods: Appears during a downtrend, indicating a continuation of bearish momentum. It consists of:
- A long bearish (red) candlestick showing strong selling pressure.
- Three (or more) small-bodied bullish (green) candlesticks contained within the range of the first bearish candle, reflecting a weak upward retracement.
- A final long bearish (red) candlestick that closes below the low of the first candle, confirming the continuation of the downtrend.
🔵 Coding Candlestick Pattern Detection in Pine Script
Detecting patterns programmatically can improve trading strategies. Below are Pine Script examples for detecting common patterns.
Hammer Detection Code
//@version=6
indicator("Hammer Pattern Detector", overlay=true)
body = abs(close - open)
upper_wick = high - math.max(close, open)
lower_wick = math.min(close, open) - low
is_hammer = lower_wick > 2 * body and upper_wick < body
plotshape(is_hammer, title="Hammer", style=shape.triangleup, location=location.belowbar, color=color.green, size=size.small)
Bullish Engulfing Detection Code
//@version=6
indicator("Bullish Engulfing Detector", overlay=true)
bullish_engulfing = close < open and close > open and close > open and open < close
plotshape(bullish_engulfing, title="Bullish Engulfing", style=shape.arrowup, location=location.belowbar, color=color.blue, size=size.small)
🔵 Practical Applications
Trend Reversal Identification: Use reversal patterns to anticipate changes in market direction.
Confirmation Signals: Combine candlestick patterns with indicators like RSI or Moving Averages for stronger signals.
Risk Management: Employ patterns to set stop-loss and take-profit levels.
🔵 Conclusion
Candlestick patterns are powerful tools that provide insights into market sentiment and potential price movements. By combining visual recognition with automated detection using Pine Script, traders can enhance their decision-making process. Practice spotting these patterns in real-time charts and backtest their effectiveness to build confidence in your trading strategy.

Top 3 Must-Know Candlestick Patterns for BeginnersGet your cup of coffee or tea ready we are doing a crash course on Candlesticks today
I’m walking you through three candlestick patterns every beginner trader should know—Doji, Engulfing Candles, and Hammers (including the Inverted Hammer). These patterns are super helpful when you’re trying to spot market reversals or continuations. I’ll show you how to easily recognize them and use them in your own trades. Let’s keep it simple and effective.
Key Takeaways:
Doji: Indicates indecision, potential reversals.
Engulfing Candles: Bullish or bearish reversal signals.
Hammer & Inverted Hammer: Bullish reversal after a downtrend.
Trade what you see and let’s get started!
Mindbloome Trader

The Art of Candlestick Trading: How to Spot Market Turns EarlyBuckle up, TradingViewers! It's time to unravel the ancient secrets of candlestick patterns. Originating from an 18th-century Japanese rice trader, these patterns aren't simply red and green elements on your trading charts—they are the Rosetta Stone of market sentiment, offering insights into the highs and lows and the middle ground of buyers and sellers’ dealmaking.
If you’re ready to crack the code of the market from a technical standpoint and go inside the minds of bulls and bears, let’s light this candle!
Understanding the Basics: The Candlestick Construction
First things first, let’s get the basics hammered out. A candlestick (or Candle in your TradingView Supercharts panel) displays four key pieces of information: the open, close, high, and low prices for a particular trading period. It might be 1 minute, 4 hours, a day or a week — candlesticks are available on every time frame. Here’s the breakdown:
The Body : This is the chunky part of the candle. If the close is above the open, the body is usually colored in white or green, representing a bullish session. If the close is below the open, the color is usually black or red, indicating a bearish session.
The Wicks (or Shadows) : These are the thin lines poking out of the body, showing the high and low prices during the session. They tell tales of price extremes and rejections.
Understanding the interplay between the body and the wicks will give you insight into market dynamics. It’s like watching a mini-drama play out over the trading day.
Key Candlestick Patterns and What They Mean
Now onto the fun part — candlestick formations and patterns may help you spot market turns (or continuations) early in the cycle.
The Doji : This little guy is like the market’s way of throwing up its hands and declaring a truce between buyers and sellers. The open and close are virtually the same, painting a cross or plus sign shape. It signals indecision, which could mean a reversal or a continuation, depending on the context. See a Doji after a long uptrend? Might be time to brace for a downturn.
The Hammer and the Hanging Man : These candles have small bodies, little to no upper wick, and long lower wicks. A Hammer usually forms during a downtrend, suggesting a potential reversal to the upside. The Hanging Man, its evil twin, appears during an uptrend and warns of a potential drop.
Bullish and Bearish Engulfing: These are the bullies of candlestick patterns. A Bullish Engulfing pattern happens when a small bearish candle is followed by a large bullish candle that completely engulfs the prior candle's body — suggesting a strong turn to the bulls. Bearish Engulfing is the opposite, with a small bullish candle followed by a big bearish one, hinting that bears might be taking control of the wheel.
The Morning Star and the Evening Star : These are three-candle patterns signaling major shifts. The Morning Star — a bullish reversal pattern — consists of a bearish candle, a small-bodied middle candle, and a long bullish candle. Think the dawn of new bullish momentum. The Evening Star, the bearish counterpart, indicates the onset of bearish momentum, as if the sun is setting on bullish prices.
The Shooting Star and the Inverted Hammer : Last but not least, these candles indicate rejection of higher prices (Shooting Star) or lower prices (Inverted Hammer). Both feature small bodies, long upper wicks, and little to no lower wick. They flag price exhaustion and potential reversals.
Trading Candlestick Patterns: Tips for Profitable Entries
Context is King : Always interpret candlestick patterns within the larger market context. A Bullish Engulfing pattern at a key support level is more likely to pan out than one in no-man’s-land.
Volume Validates : A candlestick pattern with high trading volume gives a stronger signal. It’s like the market shouting, “Hey, I really mean this move!”
Confirm with Other Indicators : Don’t rely solely on candlesticks, though. Use them in conjunction with other technical tools like RSI, MACD, or moving averages to confirm signals.
Wrapping It Up
Candlestick patterns give you a sense for the market’s pulse and offer insights into its moment-to-moment sentiment — is it overreacting or staying too tight-lipped. Mastering candlesticks can elevate your trading by helping you spot trend reversals and continuations. These patterns aren’t foolproof — they are powerful tools in your trading toolkit but require additional work, knowledge and context to give them a higher probability of confirmation.
It’s time to light up those charts and let the candlesticks illuminate your trading path to some good profits!

Hammer of Trend ChangeThe Hammer and Inverted Hammer candlestick patterns, two powerful tools adept traders employ for reversals.
If you appreciate our charts, give us a quick 💜💜
Here’s what you need to know:
1. Understanding the Essence:
Hammer: This pattern typically emerges at the culmination of a downtrend, indicating a potential bullish surge. Its small body and extended lower wick signify the bears' struggle to maintain lower prices.
Inverted Hammer: Contrarily, this pattern usually appears at the end of an uptrend, foreshadowing a possible bearish move down. Its small body and prolonged upper shadow denote the weakening grip of the bulls.
2. Decoding the Signals:
While Hammers don’t provide direct trading signals, they suggest a shift in momentum. Traders often see them as a sign of potential upward movement after a downtrend.
Inverted Hammers, appearing after an uptrend, hint at a potential reversal. The failed attempt by the bulls to sustain higher prices signifies a looming bearish sentiment.
3. Crafting Your Strategy:
When dealing with Hammers, traders might enter immediately after its formation or wait for confirmation with a bullish candle. Setting a stop-loss just below the recent low and targeting a significant resistance level is a common strategy.
For Inverted Hammers, a similar approach can be employed, focusing on prior support-turned-resistance levels. Vigilance and additional technical analysis are crucial for accurate predictions.
4. A Word of Caution:
While these patterns are robust, they should never be sole trading indicators. Combining them with other technical tools enhances accuracy and confidence in your trades.
5. Practice and Precision:
Prior to real trades, practice these strategies on demo accounts or paper trading. Platforms like TradingView, Vestinda and others like MetaTrader offer a conducive environment for refining your skills.
Incorporating Hammer and Inverted Hammer patterns into your trading toolkit empowers you to detect potential trend shifts. Remember, in trading, nuanced insights can translate into significant profits. Happy trading!

6 Reliable Bullish Candlestick PatternHello dear traders,
Here are some educational chart patterns that you must know in 2022 and 2023.
I hope you find this information educational and informative.
We are new here so we ask you to support our views with your likes and comments,
Feel free to ask any questions in the comments, and we'll try to answer them all, folks.
6 Reliable Bullish Candlestick Pattern
1) The Hammer
2) Bullish Engulfing Crack
3) Bearish Engulfing Sandwich
4) Morning Star
5) Tweezer Bottom
6) Piercing Line
1. The Hammer:-
Hammer is a bullish candlestick reversal candle.
Which is formed within the next few candles. As the price declines sharply, we anticipate a final bounce.
But how can we estimate without falling into overselling?
That's where Hammer comes into play. This gives us evidence that the selling pressure is subsiding or being absorbed. Furthermore, if the volume signature associated with the hammer candle is significant, it adds even more confidence to our thesis.
We are looking to cash in on shorts who are taking profits and covering, as well as dip buyers who are taking chances here on oversold positions. Expectation? an assembly.
Ideally, you identify a hammer candle, take a long position on a break on the upside of the candle, and set risk on the low or in the body of the hammer.
Bullish Hammer Example;-
Let’s look at a real-life example with BTC. Right off the open, BTC retests the lows from the pre-market. Once it reaches those levels, volume increases slightly as it reverses on the 5-minute chart seen here.
Visibly, there is a “shelf” forming near the low of the hammer candle’s body. The bar to the left and right is also closed and open in that price “shelf” area.
The second 5-minute chart opens with a bit of weakness, then rallies strongly above the Hammer candle.
This is your signal to go long. The break of the Hammer candle body.
Set the stop below the close of this bullish 5-minute candle.
2. Bullish Engulfing Crack:-
You can imagine that shorts will start covering given the rising price of the stock. This adds fuel to the already existing buying pressure.
The result is a bullish candlestick pattern that swallows up the bears' efforts. For the long-biased trader, the opportunity is perfect.
As is the case with any setup, we are looking for evidence to sway our confidence in either direction. The fact that the bears completely got away in this single bar is proof enough for us.
You go long on the break of the previous bar and set the stop on the low.
Bullish Engulfing Examples:-
Here's a snapshot of BTC, which provided us with a beautiful opening range breakout (ORB) opportunity right out of the gate on this particular day:
After the selloff, buyers come in and remove the selling pressure from the pre-market, engulfing the bears before moving up.
To be safe, you enter long when the red candle breaks, setting your risk at the low level or body of the first green candle.
There are some advanced traders who are more aggressive and may take their positions early if they feel a reversal is imminent.
3. Bearish Engulfing Sandwich:-
do not be confused. Just because the name says "bearish" doesn't mean it's a bearish pattern. Far from it, actually. It is often referred to as a stick sandwich.
The name is derived from the sandwiching of a "bearish engulfing" candle by two bullish candles. Thus, it is a bullish candlestick pattern in this context.
Similar to the above example of a Bullish Engulfing Crack, this pattern takes a bit longer to "move through" so to speak. Essentially an extra bar.
The perception is that the trend has reversed and we are now going down. After all, the bearish engulfing candle gives us that confidence,
If you're on the smaller side, there's hope. However, stocks don't always do what we want them to. We have to react to what the market gives us, not what we think should happen.
In this case, the Bearish Engulfing Crack is used by two bullish candles that move upwards. If you are short, hopefully, you have respected your stop loss. If you are a long-time bias, here is a good opportunity for you.
Bearish Engulfing Sandwich Example:-
After opening with a 5-minute candle chart, BTC gives a great view of it in real-time.
In this case, the right side of the sandwich acts similarly to the Bullish Engulfing Crack candlestick pattern. For all intents and purposes, you should treat your entries and risk according to the same pattern.
4. The Morning Star:-
Morning Star should gap down. It's difficult to find on an intraday basis. For this reason, we are good enough for a solid Doji candle reversal pattern.
The opening candle should be long-bodied and bearish. The middle candle is the one with the smaller body. A reversal candle is another bullish candle with a long body (usually gaping up). The close of this bullish long-bodied candle should be above the midpoint of the first candle.
Without much selling pressure, the candlestick climbs to higher prices as sellers cover and buyers take advantage of discounted stock pricing.
Morning stars can also appear as morning Doji stars. They look almost identical except for the body of the middle candle. The story of buyers and sellers remains the same.
Bullish Morning Star Example:-
You can see this in action with the BTC example below. A long-body bearish candle, followed by a narrow-body indecision candle. The bulls take control of the next candle and the rest is history.
It is worthwhile to note the volume of the first candle. We cannot assume that this is a complete recession. As you can see, there is buying pressure at lower levels. When a Doji candle is formed, it gives us confidence.
As a result, as soon as the price moves away from the lower level of the green candle; It does this in small amounts.
How can we explain that?
It took less effort to increase the price. Therefore, we can assume that the reverse is "ease of movement". This should give us confidence in our long position.
5. Tweezer Bottom:-
The Tweezer Bottom Bullish candlestick pattern consists of two candles – usually with small bodies. The first should be a red/bearish candle, and the second a green/bullish candle.
Theoretically, the Tweezer Bottom alerts the chart reader to the fact that an attempt is being made to push the price down, but to no avail. Two smaller-sized candles represent the presence of demand in the market.
Supply is being absorbed keeping candles short in the presence of selling pressure, so the volume sign will appear higher.
Entry should be taken as soon as the price breaks through the second candle. Stops can be set on the lows.
Bullish Tweezer Bottom Example:-
BTC is displaying a beautiful tweezer bottom candlestick pattern for us on the 5-minute chart. Note the narrow bodies of the two candlesticks, their symmetry, and the close range from red to green.
The volume of this first red Doji is particularly interesting. Note how high it is here. Given the context, we can interpret this as an absorption of supply.
The second candlestick (green) then rapidly decreases in volume. Thus, our thesis is confirmed that sales are absorbed and eliminated.
6. Piercing Line:-
The piercing line may look similar to a bullish engulfing pattern. The exception is that the piercing line does not completely encircle the previous candle.
It is still considered a bullish candlestick pattern as it overcame the downward momentum to close at least midway in the body of the previous candle.
It pierces the bottom line but inevitably retraces.
Bullish Piercing Line Example:-
Piercing lines may present a greater risk to reward at lower levels of support. They can also act as a spring in the trading range.
This 5-minute chart of BTC shows the combination of an opening range breakout (ORB) with a piercing line. Together, it's a combination that can really add confidence to our entryways.
As with any setup, the more evidence we have to confirm our bias and plan, the better. For this reason, it is always good to ask yourself:
Are the trends in my favor?
Is it time for a change?
Does the volume confirm my thesis?
Is the stock in an area of support or resistance?
Are the multiple timeframes in line with my view?
Trade with care.
If you like our content, please feel free to support our page with a like, comment
Hit the like button if you like it and share your charts in the comments section.
Thank you

Tug of War Among Central BanksThere is a tug of war situation among the central banks to hike interest rates. What is the bad and the good that will come out from this?
i. Last week of October, European Central Bank officials announced another massive 75 basis point hike, increasing interest rates at the fastest pace in the history of the euro currency.
ii. This week, the Federal Reserve is expected to increase rates by 75 basis points for the fourth time in a row.
iii. The Bank of England could join the club on Thursday.
Content:
. The Interest Rate race has just started, why?
. The impact on different currencies
. It may not be all bad news, why?
With higher interest rates, it attracts investors to buy its currency, in this case the USD.
Currency is always a pair, when USD strengthens, the other side weakens.
When a currency gets weaker, it is very bad news for inflation because they will have to pay more on their imports.
Therefore in order to counter inflation, one of the best measures is to hike rate
Expect more volatility in the currencies market, meaning currencies will take its turn to move.
And if you are a trader, you should welcome volatility. Because with volatility, there are opportunities.
GBP Futures
0.0001 = $6.25
0.001 = $62.50
0.01 = $625
0.1 = $6,250
1.1000 to 1.2000 = $6,250
Disclaimer:
• What presented here is not a recommendation, please consult your licensed broker.
• Our mission is to create lateral thinking skills for every investor and trader, knowing when to take a calculated risk with market uncertainty and a bolder risk when opportunity arises.
CME Real-time Market Data help identify trading set-ups in real-time and express my market views. If you have futures in your trading portfolio, you can check out on CME Group data plans available that suit your trading needs www.tradingview.com

2 Steps in Drawing a Downtrend Channel A buying strategy in a downtrend.
How to identify buying opportunity in a downtrend?
Not my preference to buy in a downtrend, but that does not mean we should avoid it when buying opportunity arises.
Recognizing it is a downtrend, we keep our buy position short-term; as we are going against the trend.
Discussion: Rules in constructing a downtrend parallel trendline
Rule 1 – First the downtrend line
Rule 2 – Then, its parallel
Disclaimer:
• What presented here is not a recommendation, please consult your licensed broker.
• Our mission is to create lateral thinking skills for every investor and trader, knowing when to take a calculated risk with market uncertainty and a bolder risk when opportunity arises.

Replaying Trade Setups - Market Open Price Reactions When markets open (Tokyo/Hong Kong/London/New York/Sydney) they can have different reactions to price movement.
One of these reactions can be a quick move up to induce traders to go long and then reverse.
This can sometimes be seen as a hammer candle.
This particular trade was placed at the hammer candle close. 1% Stoploss above and 1% take profits increments below.
Stoploss was then moved into profit.

Candlestick patterns every beginners should know . ( part 1 ) Hi friends ,
today i'll share with you the most famous
candlestick pattern everyone should know.
the hammer and inverted hammer appear in the downtrend , It indicates the possibility of a price reversal from bottom to top .
hanging man and shooting star appear in the uptrend , It indicates the possibility of a price drop
Note: The color of the candle is not important

The Best & Most Reliable Candlestick Patterns To UseIn this video I explain my favourite candlestick patterns and how to use them in your own trading.
Here we describe:
Engulfing Candles
Doji Candles
Hammer Candles
And I explain how to use them with confluence & context of where on the chart they occur.

How to use Candlestick Patterns ..Hello Traders , Have a nice weekend.
it's good to learn something even if you knew it before,Seriously some of you know all these patterns but don't know how to use them.
First we have to draw our support and resistance area in higher time frames , then we switch to lower time frames to see a candlestick pattern and now you can enter the trade after a little price rest to have a better RR ratio guys.
Good Luck on that , As easy as you see

How to be careful from misleading Indicators | XRPUSD reversalAny feedback and suggestions would help in further improving the analysis! If you find the analysis useful, please like and share our ideas with the community. Keep supporting :)
Quick glance: In our previous analysis on XRPUSD , we discussed about Ripple losing a massive market cap. Right now, XRPUSD had a massive reversal. It has taken support from the lower Bollinger bands.
Market in the last 24hrs
The last 24 hours were quite a roller coaster. All major cryptos witnessed a huge selloff including ETH, BTC, DOT and others. Trading volumes also spiked up tremendously.
Today’s Trend analysis
XRPUSD seems to be having a massive reversal. At the end of the downtrend on the 4H chart, there appeared to be a 'Hammer' formation. However, the patter could not be confirmed as the 2 following candles were red, thereby negating the reversal after the 'Hammer'. Stop losses would have been triggered for traders taking long positions after the hammer. Therefore, it is always crucial to wait for the confirmation candle, even if it eats into some of the potential gains. It hedges against fake-outs!
The reversal happened after XRP took support from the lower band of the Bollinger Bands. The volume profile shows the demand zone at $0.8688, which is 40% higher than current levels.
Price volatility remained extremely high at approximately 24.53%, with the day's range between $0.5231 — $.6514.
Price at the time of publishing: $0.6315
XRP's market cap: $29.04 Billion
Out of 11 Oscillator indicators, 9 are neutral,1 is bearish, and 1 is bullish.
Out of 15 Moving average indicators, 11 are bearish , 3 are bullish and 1 is neutral .
Indicator summary is bearish for XRPUSD in the shorter timeframe.
Volumes have spiked up tremendously in the past 24 hours.
----------------------------------------------------------------------------------------
The analysis is based on signals from 26 technical indicators, out of which 15 are moving averages and the remaining 11 are oscillators. These indicator values are calculated using 4Hr candles.
Note: Above analysis would hold true if we do not encounter a sudden jump in trade volume .
----------------------------------------------------------------------------------------
Any feedback and suggestions would help in further improving the analysis! If you find the analysis useful, please like and share our ideas with the community. Keep supporting :)

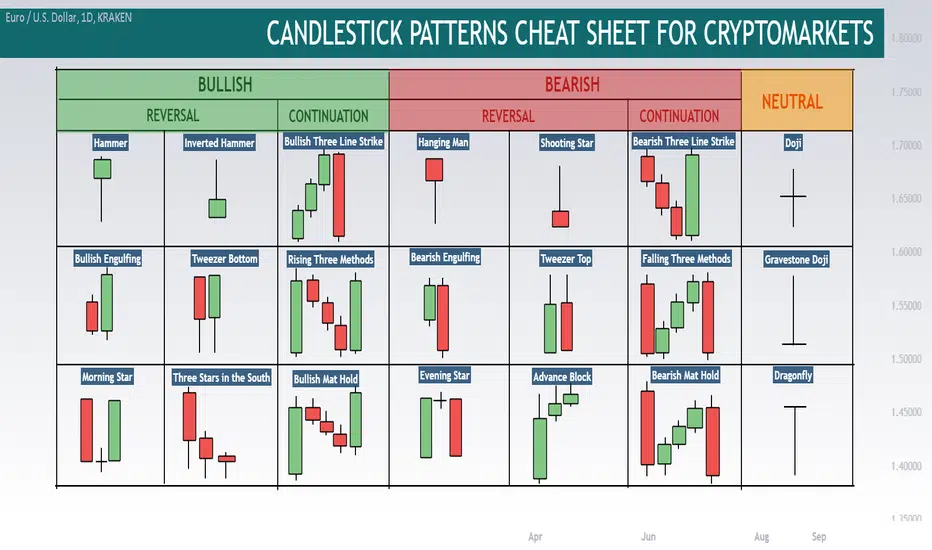
Ultimate Candlestick Cheat Sheet For CryptoHello, traders!
Here is the cheat sheet for the candlestick patterns. They are divided into five groups:
-Bullish Reversal
-Bullish Trend Continuation
-Bearish Reversal
-Bearish Trend Continuation
-Neutral
All these common formations you can see on the chart but first of all you should understand what has happened on the market. When you are looking at the candle a lot of useful information can be received.
For example if the candle have the long wick to the downside and short body (hammer), it means a huge bullish pressure and this is a reversal to the uptrend sign.
When you have three stars in the South formation it is can be noticed that the wicks to the downside are long and bodies became shorter. It means the weakness of the downtrend and also the sign of the potential reverse.
If the candle have a very small body (doji) this indicates that the market is in indefinite situation. Bulls and bears war did not lead to price changes and future price direction is unknown.
Do you use the candlestick patterns? Please write your comment and give us a support with like if you like such cheat sheets!
DISCLAMER: Information is provided only for educational purposes. Do your own study before taking any actions or decisions.
#Lesson #4 Hammer Price Action Candle -- Bullish / BuyHello Trader's ♥
We Have Today Hammer Price Action Candle -- Bullish / BUY
---------------------------------------------------------------------------
It's Come To Convert The Direction From Down To Up
After We See This Candle We Can BUY Direct ----
Best Frame :1 Hour - 4 Hour's - Daily - Weekly
Best Pairs : All Markets And All Pairs
Win Rate Arrive To 100% Some Times But Average Win Rate 70 - 85 %
And You Can Add Hammer Candle Free Script To Your Chart Just Open Indicator Library And Choose Candles Price Action Patterns And Choose Hammer Bullish ----
For Any Questions Ask Us On Comments And Wait For New Education Lessons

📖 Japanese candlestick charts. Part 1We are beginning a new theme “Trading strategy’s most important technical analysis tools”.
Today we are going to tell you about the most important things in trading, candlesticks!
📌Japanese candlestick charts were developed in the 17th-18th centuries by the Japanese rice traders. They were introduced to trading by Steve Nison in the 20th century. It's a simple, but very important tool for technical analysis, as these candlesticks contain different information about the market. I guess that everyone in this channel already knows how to read candlesticks, so we are going to talk about their usage.
⚡️First — its form, this shows market participants’ state and mood. It could show their doubts/balance (doji) or trend exhaustion (graph looks like a hammer or a falling star). There are only a few main models, and we are going to talk about them in the future. However, you can start learning about them yourself by saving the screenshot below.
⚡️Candlesticks show reversals and it is what we need in trading. By trading reversals you are catching the trend, it could be short or long. However, you will be able to understand when the trend is exhausting and you will be able to leave trade when there is a reversal. In addition to the presence of the reversal pattern itself, the preceding trend is important, you have to have at least 3 candles. If there isn’t a clear trend, then there is no trade. Additionally, we are looking at the candlesticks’ volumes and how trading continues after the last reversal pattern. We are entering position not on the reversal candlesticks, but on the following ones after the trade (or candlestick above/below fixation, depending on a situation)! Reversal setup is a needed factor, but it's not enough to enter a trade.
📌 And these are not all of the necessary conditions for implementation! You have to understand that you are getting rid of risky positions that not only will give you headache but could also result in losses. You should only trade in situations where you are confident in, the confidence is achieved by fulfilling very certain conditions, of which only few people in the market know about. Continued in part 2.

📖 Japanese candlestick charts. Part 2Hello, we continue to study candlesticks.
⚡️ Maximal/minimal
🔶 For this it is desirable for reversal candlestick to have its own high/low. In addition to the convenience of placing stop-loss on them, its own minimum/maximum also increases the chances for a long term trend after such reversal. The reason for this is in the market reflectivity, all the patterns don’t just work on their own, but they also contain market’s psychology and the methodology of huge amounts of smart money. When there is a decrease in demand and supply, smart money form the least resistant trend, and they trade!
🔶 You have probably noticed a few times that the figure’s/pattern’s price could move into the opposite direction that you expected. There are reasons for that, patterns have the necessary to complete conditions, simply of which not many know about. Even if all the necessary conditions are complete while forming a pattern, there is always a chance that the price will go opposite direction due to a number of reasons, of which we are going to talk about later. Now, you should note that its important to analyse candlesticks, as they help you to minimize risk while trading patterns.
🔶 Even though candlesticks look simple, they are a solid foundation for successful trading. They help you to find the optimal points to enter and exit trading in any patterns or whether you are trading using levels, or even if you are witnessing “third Elliott wave”... This is just a small bit of information about such a simple tool called Japanese candlesticks.
📌 Hint: if a trend is moving into a higher timeframe, you should also move to the same timeframe and start searching for reversal candlestick models at a long distance. This gives you the opportunity to trade for the entire trend duration.
⚡️ Harami
🔶 "Uptake", "Hammer" and "Cloud Silver Lining" models are common reversal patterns. There are many more forms in candlestick analysis that indicate an forthcoming reversal. One of them is the "Harami" pattern: the first candlestick is large, and the second one is small, it may be a "Spinning Top" or a "Doji", but in any case, the figure of the second candlestick is inside the first one's figure. They appear both at the top of the market and at the bottom.
🔶 The peculiarity of the "Harami" model is the uncertainty of the market at the time of its appearance. Therefore, it is recommended to wait for confirmation.
📌 The following candlestick of the corresponding color can act as confirmation: green for a bullish reversal, and red for a bearish one.

Monday Was a Classic ‘False Breakdown’ in the S&P 500False breakdowns and false breakouts can be some of the most powerful reversal patterns in the market.
We saw the start of one last Friday, when the S&P 500 closed below the key 2347 low from December 2018. Many traders had been watching that line in the sand as key support since the selloff began weeks ago.
The bears managed to score some early victories with a big limit down on Sunday night. But then the Fed unloaded a bazooka full of cash and the sellers couldn’t push prices any lower. Unlike other limit-down moves, this time the regular session had no follow-through below the overnight price action. That was the first sign things were different.
The second sign – and real signal – came first thing the next morning when SPX ripped above 2347 and never looked back. That erased the significance of the breakdown and confirmed the key support line. The candle’s long tail also created another potentially bullish reversal pattern: a hammer candlestick.
In conclusion, support and resistance lines are always important but the stage of the move can matter more. The initial breakdown under 3200 on February 25 was a big deal because it confirmed the beginning of a trend. But after four weeks of vicious downside, SPX’s failed violation of 2347 could mark the end of its current decline.

Price Action Lesson 5: Weak Hammer (Example)Weak Hammer (Example):
The chart shows the price of Bitcoin vs. US Dollar. In 02/02/2018, as it says, buyers couldn't raise the price above the day open price, the D1 candle seems a Hammer with bearish body. So the final result wasn't clear and the next day, sellers could pullback the price. (Consider the red thick arrow)

Price Action Lesson 4: Weak hammerWeak hammer:
For having successful and steady transactions, Simple detection of market patterns is not enough. But with a deeper look, we should calculate the success possibility of each pattern. One of the determining power Parameters of hammer stick is about Descending or ascending that the body can be. Thus, if the body of hammer is ascending, Possibility of starting an ascendant wave is very high.
The opening price of the day, is very important. This price - is the previous day's closing price, in fact it is the price that they had a war at in previous day where buyers and sellers come to equilibrium. So on the day that the Hammer is forming. If buyers can raise prices to the point of closing price of yesterday, and by the end of the day, they keep the price at the top of it, they will be the winners of the war. If we can raise the price above yesterday's closing price, they are not conclusive winners of today’s war, and this war will continue for the next few days.
Thus, if the body of hammer is ascending, Possibility of the beginning Ascending wave is very high. But if the body of hammer is Descending, Possibility of the beginning Ascending wave is less. In this case, it is said a weak hammer has made.
- The picture shows a hammer candlestick with descending body.
. As what can be seen, candle’s height is tall, but it has very short body height. Also Lower Shadow is long, and the upper shadow is very short.
. As regards the Closing Price of market is under its Opening Price, therefore the body of this hammer is Descending, and the power is very low. Possibility of the beginning ascending wave is less.

Price Action Lesson 3: Hammer, The first sign of beginning ...Hammer, The first sign of the beginning Ascending wave:
Hammer shows that the war between buyers and sellers, at the beginning of the day sellers could create significant reduction in price, with their high investments. But when the price had come to the lowest extent of it, many of buyers have entered with more investments than sellers. And again they could increase the price close to what it was at the beginning of the day or may even more. And at the war that was between buyers and sellers, the buyers have been the winners of the day, and the market is largely in control of them. Thus, the possibility of further price increases in the coming days is enormous.
example: picture Shows, currency pair of EUR/USD -0.31% in a 30 minutes time frame.
At the beginning, by increasing investments of sellers, the price became to 1.16886 But in this range with the arrival of large buyers to the market and overcome to turnover of shopping on sales transactions, the price increased again. Sellers could increase the selling price due to the amount of demand from buyers. The starting price is may be at 1.17495 but it increased by the end of the day to 1.17578.
As what can be seen, after forming Hammer , an Ascending wave started and the Price have increased more.
