AVGO - 26 Jan 2026 (Head and Shoulder Breakdown)This analysis is purely for education purposes. This is not a Buy or Sell Tip. Please consult your Financial advisor before taking any trades.
- Currently, AVGO has broken the Head and Shoulder neckline.
- Stock could also take Support at the lower end of the Gap and bounce back. In this case, there could be an opportunity for a Long Trade.
- Price action over the next few days will have to be observed.
Head and Shoulders

Classic Underestimated Head and Shoulders Strategy2. A+ Setup
Traditional Head & Shoulders (Underestimated
The Head & Shoulders pattern is a classic reversal setup that often goes underestimated by traders, creating high-probability trading opportunities when identified correctly. This strategy focuses on spotting traditional H&S formations on higher timeframes and combining them with proper execution and risk management.
1 — Identify the Pattern
• Look for a left shoulder → head → right shoulder structure.
• Ensure the neckline is clearly defined, connecting the lows (for a bearish H&S) or highs (for a bullish inverse H&S).
• Verify that the pattern occurs after a significant trend, as H&S is a trend reversal pattern.
2 — Point of Interest (POI) & Entry
• After the pattern completes, wait for price to approach the neckline.
• The retest of the neckline serves as the Point of Interest (POI) and provides the execution entry.
• For additional confirmation, check for candlestick patterns at the POI (Doji, Engulfing, Hammer, Shooting Star, Morning/Evening Star) to improve your success rate.
Stop-Loss Options
1. Conservative Stop Loss
• Place SL beyond the opposite shoulder of the pattern.
• Protects against false breakouts and ensures alignment with structure.
2. Aggressive Stop Loss
• Place SL just beyond the POI/retest candle.
• Offers tighter risk but may be stopped out more frequently, especially on lower timeframes.
Take-Profit Methods •
TP: Measure the distance from the head to the neckline and project it from the breakout point.
For extended trends, consider trailing stop methods using:
• 21 SMA
• SuperTrend
• Or trailing below micro consolidation zones for optimal trend-following profits.
Use of the Pattern Zone • Extend the neckline and shoulders zone to the right.
• These areas often act as future support or resistance, providing additional trade opportunities and helping anticipate market behavior.
Realistic Performance
• Following all rules — proper H&S structure, retest entry, disciplined SL, and TP — the realistic win rate for this setup is around 50–65%, with positive expectancy due to favorable risk-to-reward ratios.
⸻
This Head & Shoulders Setup is my 2nd A+ setup. There are many more high-probability strategies I will be sharing soon.

Head and Shoulders PatternHead & Shoulders Patterns
Classic Reversal Structures Every Trader Should Know
1. Head & Shoulders (Bearish Reversal)
The Head & Shoulders pattern is a bearish reversal formation that typically appears after an established uptrend. It signals a possible shift from bullish to bearish market conditions.
This structure consists of three swing highs:
• Left Shoulder – first peak
• Head – highest peak
• Right Shoulder – final peak, similar in height to the left shoulder
Identification Rules
• Left Shoulder < Head > Right Shoulder
• Left Shoulder ≈ Right Shoulder (symmetry improves reliability)
Volume ideally declines as the pattern forms, showing weakening buying pressure.
Between the peaks are two pullbacks (swing lows). Connecting these lows forms the neckline. A confirmed break below the neckline completes the pattern and signals bearish continuation.
2. Inverse Head & Shoulders (Bullish Reversal)
The Inverse Head & Shoulders is the bullish counterpart and typically forms after a downtrend. Instead of peaks, the pattern is made of three troughs:
• Left Shoulder – first low
• Head – lowest point
• Right Shoulder – higher low, similar to the left shoulder
Identification Rules
• Left Shoulder > Head < Right Shoulder
• Left Shoulder ≈ Right Shoulder (symmetry improves reliability)
Volume often contracts during formation and may expand on the neckline breakout.
The highs between the troughs form the neckline. A break above the neckline confirms the bullish reversal.
3. Complex Head & Shoulders Variations
Complex variations follow the same logic as standard H&S patterns but include:
• Multiple shoulders on one or both sides
• More than one head
Despite the added structure, these patterns still rely on:
• Symmetry
• Clear neckline definition
• Breakout confirmation
Traders should treat them the same way as standard formations, but with extra patience.
4. Measurement Rule (Profit Targets)
Standard Head & Shoulders (Bearish)
• Measure the vertical distance from the head to the neckline
• Subtract that distance from the neckline breakout level
• This projects a downside target
Inverse Head & Shoulders (Bullish)
This is very simple. It’s exactly the same as the above Standard Head & Shoulders (Bearish), but inverted. Same concept. Just upside down.
** Tip **
When multiple heads exist, use the most extreme head (highest for bearish, lowest for bullish) for measurement.
Final Notes for Traders
Head & Shoulders patterns remain effective because they visually represent trend exhaustion and shifting market psychology.
When trading these patterns, always emphasize:
• Structure first
• Confirmation second
• Risk management always

XAUUSDDon't get annoyed by what you see on youtube. Just follow your system. BTW, a system should not be difficult, but it only should consider market law's. cause and effect, effort vs result, supply and demand. That's all.

From Congestion to Collapse: Understanding Distribution and H&S A Simple Lesson: How to Identify Congestion Zones in the Market — Schabacker’s Approach and the Head and Shoulders Pattern
⸻
👤 Who Was Schabacker?
🔹 Richard Schabacker was one of the pioneers who authored seminal works on technical analysis.
🔹 He lived over 90 years ago and served as Editor-in-Chief of Financial World magazine.
🔹 His most notable book is:
Technical Analysis and Stock Market Profits
🔹 Published around 1932 in the United States.
🔹 Schabacker is often considered the “grandfather” of technical analysis, and much of the methodology traders use today can be traced back to his insights.
⸻
🟢 What Did He Teach?
🔹 Schabacker introduced a critical concept:
✅ The Congestion Zone
🌟 What Does It Mean?
When the market makes a strong move—either a sharp rally or a steep decline—price often becomes trapped in a range:
• Buyers at higher levels wait for further gains.
• Sellers at lower levels expect more downside.
But in reality, retail traders aren’t moving the market. Large institutions and funds—the so-called smart money—are in control.
👈 When these big players want to exit positions, they avoid selling everything at once to prevent a sudden collapse in price and to avoid revealing their hand.
✅ Their Playbook:
• Keep price contained within a narrow band between support and resistance.
• Gradually increase volume over time.
• Attract new buyers who believe the trend is still intact.
• Quietly distribute their holdings without alarming the market.
🌟 Why Do They Do This?
If they were to dump all at once:
• Price would drop rapidly.
• Everyone would realize a large seller was active.
• Institutions would get stuck, unable to exit at favorable prices.
🔻 So They Create Congestion and Distribution:
1️⃣ Sell discreetly over time.
2️⃣ Maintain the illusion that the trend is healthy.
3️⃣ Trap latecomers who buy into the range.
⸻
🟢 How Do You Recognize This on a Chart?
🎯 A Simple Example:
• Price climbs steadily from 3,000 to 3,300.
• Suddenly, it surges to 3,450.
✅ Most traders think the rally will continue.
🌟 What happens next:
• Price stalls between 3,380 and 3,450.
• Numerous candles form in this area.
• Volume remains elevated.
🔥 Inside this range:
1️⃣ Institutions sell into every upward move.
2️⃣ Early buyers remain committed, hoping for new highs.
3️⃣ New participants enter, unaware of the distribution.
🔻 What Do You See?
• Repeated candles oscillating within the same band.
• Failed breakouts above resistance.
• Sustained high volume.
✅ This is the classic Congestion Zone.
⸻
💡 How Can You Tell If It’s Distribution, Not Accumulation?
• Persistent high volume indicates steady selling.
• Price struggles to make fresh highs.
• Long upper wicks signal selling pressure.
• A Head and Shoulders pattern may start forming.
⸻
🎯 What Happens After Congestion?
• Institutions complete their distribution.
✅ Price breaks sharply below the range.
✅ The market drops quickly.
✅ Late buyers are forced to sell at losses.
⸻
🟢 Practical Illustration:
Visualize the range like this:
| |
| The Range |
| |
3380 ————> Resistance
| Multiple Candles |
| Multiple Candles |
| Multiple Candles |
3300 ————> Support and Neckline
✅ If price breaks below 3,300 on heavy volume:
• The distribution is complete.
• Price declines rapidly.
⸻
📌 Key Takeaway:
After any strong move, expect congestion as large players exit. Once they’re done, the trend often reverses.
⸻
🎯 Quick Tips:
✅ Never rush to buy inside congestion after a big rally.
✅ Watch volume—if it’s high, it’s likely distribution.
✅ Wait for a clear breakdown before shorting.
✅ Your target should at least match the size of the preceding move.
⸻
🔥 Let’s Cover the Head and Shoulders Pattern:
✅ What Is It?
A reversal pattern appearing after a strong uptrend, signaling the end of bullish momentum.
⸻
✅ Pattern Components:
1️⃣ Left Shoulder:
• Price makes a high.
• Pulls back.
2️⃣ Head:
• Rallies to a higher high.
• Declines again.
3️⃣ Right Shoulder:
• Attempts to rise but fails to exceed the head’s high.
4️⃣ Neckline:
• Connects the lows between the shoulders and the head.
🔻 When the Neckline Breaks Down:
It’s a strong sell signal. The market often drops decisively.
⸻
💡 Example in Numbers:
• Price moves from 3,200:
1️⃣ Up to 3,350 (Left Shoulder)
2️⃣ Down to 3,300
3️⃣ Up to 3,400 (Head)
4️⃣ Down to 3,300
5️⃣ Up to 3,350 (Right Shoulder)
6️⃣ Down to 3,300
✅ If price closes below 3,300 on strong volume, the pattern is confirmed.
🎯 Target Calculation:
• Head = 3,400
• Neckline = 3,300
• Distance = 100 points
• Target = 3,200
⸻
🟢 How To Trade It:
1️⃣ Don’t preemptively sell during the right shoulder.
2️⃣ Wait for a confirmed breakdown.
3️⃣ Enter a short position targeting 3,200.
4️⃣ Set your stop loss above the right shoulder.
⸻
🟢 Final Advice:
✅ The Head and Shoulders is powerful if confirmed by volume.
✅ Always wait for the neckline break—otherwise, it could be a false signal.
✅ Keep monitoring volume for confirmation.
⸻
🔥 Be disciplined in your analysis and decisive in your execution.
🔥 As Warren Buffett said:
“The stock market is a device for transferring money from the impatient to the patient.”
⸻
If you found this valuable, let me know—I’d be glad to prepare more lessons. 🌟

Circle’s IPO and the Crypto Listing Wave: The Market EntersOn June 14, 2025, the U.S. stock market witnessed a pivotal moment for the crypto industry. Circle, issuer of the USDC stablecoin and a major player in the sector, successfully went public. Shares opened at $31 and soared to over $134 by the end of the first trading day—an explosive 330% gain.
This isn’t just a one-off success. It marks the beginning of a new chapter: the public crypto era, where leading crypto companies are stepping into the spotlight of traditional finance.
Why It Matters
Circle’s IPO signals the maturation of the crypto market. Just three years ago, crypto companies were seen as high-risk, unregulated tech startups. Now, they’re structured fintech firms with clear business models, institutional backing, and regulatory compliance.
Who’s Next in Line
Following Circle, a wave of major crypto firms is preparing for their own IPOs:
eToro – the social trading platform with crypto features has finalized its SPAC merger and is set to debut on NASDAQ.
Gemini – the exchange founded by the Winklevoss twins filed for an IPO in mid-May.
Galaxy Digital and Ripple – both confirmed listing plans for the second half of 2025.
Kraken is exploring a listing in Europe, where requirements are more flexible than in the U.S.
These companies are waiting for the right moment—regulatory clarity, growing interest in crypto ETFs, and progress in U.S. Congress (with the CLARITY and GENIUS bills gaining momentum).
What It Means for the Industry
Increased Investor Trust – Public companies must disclose financials, pass audits, and comply with regulations. This builds confidence in the broader crypto sector.
Institutional Capital Inflow – IPOs unlock access to capital from pension funds, hedge funds, and asset managers that cannot invest in private crypto startups.
Marketing Power – Going public draws media attention and boosts brand awareness. Every IPO is a PR win for the entire industry.
Risks and Challenges
Regulatory Uncertainty – Despite progress, the SEC could change direction, especially with potential political shifts.
Overvaluation Concerns – Circle’s stock is already raising eyebrows, with a P/E ratio over 200 and trading volume growing faster than revenue.
Crypto Market Dependency – If crypto prices crash, the valuations of these companies could quickly collapse.
What’s Next
Expect up to 10 more crypto IPOs over the next 6–12 months, including players in DeFi, blockchain infrastructure, and Web3. This is the next stage in crypto’s journey toward mainstream legitimacy.
What was once the domain of tech rebels and early adopters is now becoming a business—with a stock ticker and quarterly earnings. And that changes everything.

How to Use Drawing Tools on TradingViewThis tutorial video discusses why and how traders use different types of trading tools, how to access the trading tools in Tradingview, and a few examples of how and why you might apply them.
Learn more about using Tradingview to trade futures with Optimus Futures:
optimusfutures.com
Disclaimer: There is a substantial risk of loss in futures trading. Past performance is not indicative of future results. Please trade only with risk capital. We are not responsible for any third-party links, comments, or content shared on TradingView. Any opinions, links, or messages posted by users on TradingView do not represent our views or recommendations. Please exercise your own judgment and due diligence when engaging with any external content or user commentary.

Title: How to Spot Potential Price Reversals: Part 2A subject within technical analysis that many find difficult to apply to their day-to-day trading is the ability to spot reversals in price.
Yesterday we posted part 1 of this 2 part educational series, where we used GBPUSD as an example of how you could identify and trade a Head and Shoulders/Reversed Head and Shoulders pattern.
In today’s post we discuss a Double Top/Double Bottom, using a recent US 100 example.
Our intention is to help you understand why price activity is reversing and highlight how knowledge of this may be applied within your own individual trading strategies.
The Double Top Reversal:
The Double Top, is formed by 2 distinct price highs.
This pattern highlights the potential,
• reversal of a previous uptrend in price, into a phase of price weakness
• reversal of a previous downtrend in price into a more prolonged period of price strength.
In this example, we are going to talk about a bearish reversal in price called a Double Top.
Points to Note: A Double Top
• An uptrend in price must be in place for the pattern to form.
• A Double Top pattern is made up of 2 clear highs and one low, forming a letter ‘M’ shape on a price chart.
• This pattern reflects an inability of buyers to push price activity above a previous peak in price, potentially highlighting a negative shift in sentiment and sellers gaining the upper hand. This is regarded as a ‘weak test’ of a previous price failure high and leaves 2 price peaks at, or very close to each other.
• A horizontal trendline is drawn at the low between the 2 peaks, which highlights the neckline of the pattern. If this is broken on a closing basis, the pattern is completed, reflecting a negative sentiment shift and the potential of further price weakness.
Point to Note: To understand a bullish reversal, known as a ‘Double Bottom’ please simply follow the opposite analysis of what is highlighted above.
US 100 Example:
In the chart below, we look at the US 100 index and the formation of a Double Top pattern from earlier in 2025.
As with any bearish reversal in price, a clear uptrend and extended price advance must have been seen for the reversal pattern to be valid. On the chart above, this was reflected by the advance from the August 5th 2024 low up into the December 16th price high.
The Double Top pattern is made up of 2 price highs close or at the same level as each other, with a low trade in the middle, which forms a letter ‘M’ on the chart (see below).
In this example above, the highs are marked by 22142, the December 16th and 22226, the February 18th highs, with the 20477 level posted on January 13th represents the low traded in the middle, which helps to form the ‘M’.
The Neckline of the pattern is drawn using a horizontal line at the 20477 January 13th low, with the Double Top pattern completed on closes below this level. Potential then turns towards a more extended phase of price weakness to reverse the previous uptrend, even opening the possibility a new downtrend in price being formed.
Does the Double Top Pattern Suggest a Potential Price Objective?
Yes, it does. This can be done by measuring the height of the 2nd peak in price down to the Neckline level at that time, this distance is projected lower from the point the neckline was broken, suggesting a possible minimum objective for any future price decline.
In the example above, the 2nd high was at 22226, posted on February 18th 2025, with the Neckline at 20477, meaning the height of the pattern was 1749 (points). On February 27th the Neckline of the pattern was broken on a closing basis.
This means… 20477 – 1749 = 18728 as a minimum potential price objective for the Double Top pattern.
Of course, as with any technical pattern, completion is not a guarantee of a significant phase of price movement, with much still dependent on future sentiment and price trends.
Therefore, if initiating a trade based on a Double Top pattern, you must ALWAYS place a stop loss to protect against any unforeseen event or price movement.
This stop loss should initially be placed just above the level of the 2nd price high, as any break negates the pattern, meaning we were wrong to class the pattern as we did.
Hopefully, as prices fall after completion of the pattern, you can consider moving your stop loss lower, keeping it just above lower resistance levels to protect your position and lock in potential gains.
While both the Head and Shoulders and Double Top/Bottom patterns can take a prolonged period to form and we must be patient to wait for completion, they reflect important signals indicating potential changes in price sentiment and direction.
By understanding how and why these patterns form can offer an important insight to potential price activity that can help to support day to day decision making when deciding on trading strategies.
The material provided here has not been prepared in accordance with legal requirements designed to promote the independence of investment research and as such is considered to be a marketing communication. Whilst it is not subject to any prohibition on dealing ahead of the dissemination of investment research, we will not seek to take any advantage before providing it to our clients.
Pepperstone doesn’t represent that the material provided here is accurate, current or complete, and therefore shouldn’t be relied upon as such. The information, whether from a third party or not, isn’t to be considered as a recommendation; or an offer to buy or sell; or the solicitation of an offer to buy or sell any security, financial product or instrument; or to participate in any particular trading strategy. It does not take into account readers’ financial situation or investment objectives. We advise any readers of this content to seek their own advice. Without the approval of Pepperstone, reproduction or redistribution of this information isn’t permitted.

How to Spot Potential Price Reversals - Part 1: GBPUSD ExampleA subject within technical analysis that many traders find difficult to apply to their day-to-day trading is the ability to spot reversals in price.
The misreading of price activity when a reversal is materialising can often lead to incorrect decisions, such as entering a trade too early, which can result in being stopped out of a potentially successful trade before price activity moves in the intended direction.
In this piece today, and part 2 tomorrow, we want to look at 2 types of reversal in price – the Head and Shoulders/Reversed Head and Shoulders and the Double Top/Double Bottom.
The intention is to help you understand why price activity is reversing and highlight how knowledge of this may be applied within your own individual trading strategies.
The Head and Shoulders Pattern
This pattern highlights the potential,
• reversal of a previous downtrend in price into a more prolonged period of upside strength
• reversal of a previous uptrend in price into a phase of weakness
In this example, we are going to outline in more detail a bullish reversal in price, which is called a ‘Reversed Head and Shoulders’.
Points to Note: Reversed Head and Shoulders
• A downtrend in price must have been in place.
• A Reversed Head and Shoulders is made up of 3 clear troughs on a price chart.
• The middle trough (called the Head) is lower than the 2 outer price troughs (called the
Left Hand Shoulder and the Right Hand Shoulder).
• The 3rd low in price (Right Hand Shoulder) being higher than the Head, reflects the
inability of sellers to be able to break under a previous low in price. This is regarded as a
‘weak test’ of a previous price extreme, suggesting buyers may be gaining the upper hand,
readying for a potential positive sentiment shift and price strength.
• A trendline connecting highs in price that mark the upper extremes of the Head is drawn.
This highlights the Neckline of the pattern, which if broken on a closing basis, completes
the reversal, to represent a positive shift in sentiment and the potential of further price strength.
Point to Note: To understand a bearish reversal, known as a ‘Head and Shoulders Top’ please simply follow the opposite analysis of what is highlighted above.
GBPUSD Example:
In the chart below, we look at the recent activity of GBPUSD, which formed a bullish Reversed Head and Shoulders Pattern between December 20th 2024 and February 13th 2025, when the pattern was completed.
As with any bullish reversal in price, a clear downtrend and extended price decline must have been seen previously, for the reversal pattern to be valid. On the chart above, this was reflected by the decline from the September 20th 2024 high at 1.3434, into the January 13th price low at 1.2100.
The Head and Shoulders pattern is made up of 3 troughs in price and in this example, these are marked by the period between December 30th 2024 to January 7th 2025 which forms the Left Hand Shoulder , between January 7th to February 5th 2025 which was the Head developing , and between February 5th to February 13th 2025, which then formed the Right Hand Shoulder .
The Neckline of the pattern is drawn connecting the December 30th 2024 high and the February 5th 2025 highs, which was broken on a closing basis on February 13th 2025. It was on this day, the Reversed Head and Shoulders Pattern was completed with potential then turning towards a more extended phase of price strength.
Does the Head and Shoulders offer an Insight into a Potential Price Objective?
Yes, it does, by measuring the height from the bottom of the Head to the level of the Neckline at the time that low was posted, we can project this distance higher from the point the neckline was broken. This suggests a possible minimum objective for any future price strength.
In the example above, a low of 1.2100 was registered on January 13th 2025, at which time the Neckline stood at 1.2576. This means the height of the Head was 0.0476 (476 pips). On February 13th when the Neckline was broken on a closing basis, the Neckline stood at 1.2529.
As such…
1.2529 + 0.0476 = 1.3005, which would be the minimum potential price objective for the Reversed Head and Shoulders. This level was in fact achieved on March 18th 2025.
Of course, while the Head and Shoulders pattern is regarded as one of the most reliable patterns within technical analysis, it is not a guarantee of a significant price movement, as much will still depend on future sentiment and price trends.
Therefore, if initiating a trade based on a Reversed Head and Shoulders pattern, you must ALWAYS place a stop loss to protect against any unforeseen event or price movement.
The stop loss should initially be placed just under the level of the Right Hand Shoulder, as any break of this point negates the pattern, meaning we were wrong to class the pattern as we did.
However, if prices rise after completion of the pattern, you can consider moving a stop loss higher, keeping it just under higher support levels to protect your position.
We highlighted the formation of the potential GBPUSD reversed Head and Shoulders pattern on February 13th 2025, so please take a look at our timeline for further details.
Remember to watch out for tomorrow’s Part 2 post
The material provided here has not been prepared in accordance with legal requirements designed to promote the independence of investment research and as such is considered to be a marketing communication. Whilst it is not subject to any prohibition on dealing ahead of the dissemination of investment research, we will not seek to take any advantage before providing it to our clients.
Pepperstone doesn’t represent that the material provided here is accurate, current or complete, and therefore shouldn’t be relied upon as such. The information, whether from a third party or not, isn’t to be considered as a recommendation; or an offer to buy or sell; or the solicitation of an offer to buy or sell any security, financial product or instrument; or to participate in any particular trading strategy. It does not take into account readers’ financial situation or investment objectives. We advise any readers of this content to seek their own advice. Without the approval of Pepperstone, reproduction or redistribution of this information isn’t permitted.

What is Double Top or Double Bottom and how it works?Hello in this educational content we are talking about one of the major reversal pattern in market or maybe even the most important reversal pattern which is exist.
Double Top: Like the pattern mentioned on the chart now double Top is made by two reject from resistance but it is complete when the support or neckline of this two top break and then the pattern is complete and we can say this is a valid double Top and market now can get correction and get bearish.
here is chart & example take a look at Two kinds of Double Top available in my View:
As we can see sometimes price even made fake breakout to the upside or downside of the pattern and in these kinds of situation we can expect more fall if we had Advance Double Top because the liquidity was more at the beginning of second phase rejection.
We also have other Strong Reversal patterns like Head & shoulders and ... which you can mention them in comments or we may have another live post for them in next Educational posts.
most of You know about Regular Double top or Double Bottom and in this Educational post we mention some data about Advance form of it too and also so many know this form as regular form and consider this fake breakout a sign of good double Top and ....
Double Bottom is the same like the Double Top but reverse(This time support can not break two times and price after breaking neckline or resistance start to pump and bear market turn to bullish with Double Bottom).
DISCLAIMER: ((Always trade based on your own decision))-----this post is not signal content or analysis and just Try to talk about an important Reversal pattern with Example which happened also on Bitcoin in previous days in my Opinion.
<<press like👍 if you enjoy💚

Inverse Head & Shoulder Tutorial An inverse head and shoulders pattern is the opposite of the head and shoulders pattern and signals a potential bullish reversal from a downtrend to an uptrend. Here's a breakdown of its key components:
Left Shoulder: The price falls to a trough and then rises back to a resistance level.
Head: The price falls again to a lower trough and then rises back to the same resistance level.
Right Shoulder: The price falls again but only to the level of the first trough, then rises once more.
The pattern gets its name because it resembles an upside-down head with shoulders on either side. The neckline is the resistance level connecting the highest points of each peak.
Types of Inverse Head and Shoulders Patterns
Inverse Head and Shoulders Bottom: This pattern signals a potential reversal from a bearish trend to a bullish trend.
How to Trade It
Breakout Confirmation: The pattern is confirmed when the price breaks above the neckline in an inverse head and shoulders bottom.
Entry Point: Traders often enter a long position when the neckline is broken in an inverse head and shoulders bottom.

SMART MONEY TOOLHELLO everyone❤... this is for educational purpose, the previous idea i published , you can see that "sellside liquidity"($ NYSE:L ) was not swept , you must compare assets that are closely correlated "ALWAYS"...Identify Key Times: Look for SMT divergence during significant trading times, such as the London and New York market openings, as these periods often see increased volatility and institutional activity...

The "Head and Shoulders": Real success rates.Inverted Head and Shoulders: WATCH volumes when the neckline breaks!!
Here is what we can say about the success rate of the inverted head and shoulders pattern in trading:
-The inverted head and shoulders pattern is considered one of the most reliable chart patterns to anticipate a bullish reversal.
-According to some sources, the success rate of this pattern would be very high, with around 98% of cases resulting in a bullish exit.
-More precisely, in 63% of cases, the price would reach the price target calculated from the pattern when the neckline is broken.
-A pull-back (return to the neckline after the break) would occur in 45% of cases.
-However, it should be noted that these very optimistic figures must be qualified. Other sources indicate more modest success rates, around 60%.
-The reliability of the pattern depends on several factors such as respect for proportions, neckline breakout, volumes, etc. A rigorous analysis is necessary.
-It is recommended to use this pattern in addition to other indicators and analyses, rather than relying on it blindly.
In conclusion, although the inverse head and shoulders pattern is considered a very reliable pattern, its actual success rate is probably closer to 60-70% than the 98% sometimes claimed. It remains a useful tool but must be used with caution and in addition to other analyses.
__________________________________________________________________
Head and Shoulders:
Here is what we can say about the success rate of the head and shoulders pattern in trading:
-The head and shoulders pattern is considered one of the most reliable chart patterns, but its exact success rate is debated among technical analysts. Here are the key takeaways:
- Some sources claim very high success rates, up to 93% or 96%. However, these figures are likely exaggerated and do not reflect the reality of trading.
- In reality, the success rate is likely more modest. One cited study indicates that the price target is reached in about 60% of cases for a classic head and shoulders pattern.
- It is important to note that the head and shoulders pattern is not an infallible pattern. Its presence alone is not enough to guarantee a trend reversal.
- The reliability of the pattern depends on several factors such as respect for proportions, the breakout of the neckline, volumes, etc. Rigorous analysis is necessary.
- Many experienced traders recommend using this pattern in addition to other indicators and analyses, rather than relying on it blindly.
In conclusion, while the head and shoulders pattern is considered a reliable pattern, its actual success rate is probably closer to 60% than the 90%+ sometimes claimed. It remains a useful tool but should be used with caution and in conjunction with other analyses.
_____________________________________________________________________________
NB: In comparison, the classic (bearish) head and shoulders pattern would have a slightly lower success rate, with around 60% of cases where the price target is reached.

All About the Head & Shoulders Pattern(Beginner-Friendly) Part.2Hello, everyone.
Today, I’m excited to share the second part of my educational series on chart patterns.
In this post, we’ll be focusing on the 'Head and Shoulders' and 'Inverse Head and Shoulders' patterns.
For those who missed the first part, you can catch up here:
↓↓↓
As always, I’ve kept the explanations simple and beginner-friendly. I hope this guide provides you with valuable insights!
Here’s today’s outline:
————
✔️ Outline
1. What is the Head and Shoulders pattern?
Definition
Key components
Characteristics
2. Head and Shoulders
Basic features
Examples
3. Inverse Head and Shoulders
Basic features
Examples
————
1. What is the "Head and Shoulders" pattern?
1) Definition
The Head and Shoulders pattern is a well-established reversal formation that appears after an uptrend and signals the potential start of a downtrend. It indicates that buying pressure is weakening and selling pressure is gaining momentum.
2) Key components
Left Shoulder: The initial peak, where the price rises and then pulls back.
Head : The highest peak, situated between the two shoulders, representing the final bullish push.
Right Shoulder: The third peak, which is typically lower than the head but similar to the left shoulder, signaling diminishing buying interest.
Neckline: A key support line drawn across the lows of the left and right shoulders. A decisive break below this neckline confirms the reversal and the beginning of a downtrend.
3) Characteristics
Reversal signal: The Head and Shoulders pattern marks a transition from an uptrend to a downtrend.
Easy identification: The structure is visually distinctive, with three clear peaks.
Neckline significance: A break below the neckline serves as a confirmation signal for the downtrend.
Volume dynamics: Volume typically rises during the formation of the left shoulder and head, decreases during the right shoulder, and surges again when the neckline is breached.
————
2. Head and Shoulders (Reversal from uptrend to downtrend)
1) Basic features
End of an uptrend: The Head and Shoulders pattern forms at the end of a bullish phase, signaling a weakening in buying strength.
Distinct peak heights: The head is always higher than the shoulders, which are generally symmetrical, though the right shoulder may sometimes be slightly lower, enhancing the pattern’s reliability.
Neckline as a trigger: The neckline acts as a critical support level. A break below it confirms the pattern and signals the onset of a bearish trend.
Volume confirmation: Volume increases during the left shoulder and head formations, weakens during the right shoulder, and spikes when the neckline is broken, confirming a potential sell-off.
Price target: After the pattern completes, the expected price drop is typically equal to the distance between the head and the neckline, providing traders with a target.
2-1) Example 1
In this example, we see a fakeout at the right shoulder, followed by a sharp decline.
After a brief retest of the neckline, the price broke through and continued its downtrend.
2-2) Example 2
In this chart, a fakeout occurred when the price dropped from the head and formed the neckline, misleading many market participants. After forming the right shoulder, the price successfully declined. There were two retests, which confirmed the reliability of the pattern.
————
3. Reverse Head and Shoulders (Trend reversal from downtrend to uptrend)
1) Basic features
End of a downtrend: The Inverse Head and Shoulders pattern typically forms at the end of a downtrend, signaling a potential reversal to the upside.
Formation of lows: Like the standard Head and Shoulders, this pattern consists of three lows—left shoulder, head, and right shoulder—with the head being the lowest point.
Neckline significance: The neckline is drawn across the highs of the left and right shoulders. A break above this line confirms the reversal and acts as a strong buy signal.
Volume pattern: Volume tends to decrease during the formation of the pattern but surges when the neckline is broken, signaling strong buying momentum.
Target setting: After the pattern is confirmed, the expected price rise is often equal to the distance from the head to the neckline, which helps traders set profit targets.
2-1) Example 1
After the Head and Shoulders pattern formed, the price broke above the neckline, successfully reversing the downtrend into an uptrend. A buy strategy would have yielded profits at the breakout point.
2-2) Example 2
In this example, a smaller Reverse Head and Shoulders pattern formed within the head of a larger pattern (see Example 3). After two successful retests, the price reversed into a strong uptrend.
2-3) Example 3
This example showcases the smaller Reverse Head and Shoulders pattern mentioned in Example 2, located within the head. After two successful retests, a buy strategy could have led to profits as the price reversed into an uptrend.
————
✔️ Conclusion
"Charts are the maps of the market."
The Head and Shoulders and Reverse Head and Shoulders patterns we’ve covered in this post are key signals that frequently appear in the market. Charts aren’t random—they are visual representations of market psychology and investor behavior. As traders, our role is to interpret these maps, navigate the market, and make informed decisions.
Investing is more than just buying and selling. Sometimes the market may move contrary to our expectations, while other times we seize opportunities and achieve success. Each experience is a chance to learn and grow. The more experience you gain, the more paths you’ll recognize on the chart.
Success in this market requires persistence, patience, and continuous learning. Understanding and analyzing chart patterns like the ones discussed here is just the beginning. I hope this post has helped you gain a deeper understanding of the market and make more informed decisions.
The market is always evolving, but within that evolution lies opportunity. The key is developing the ability to spot those opportunities. With knowledge, experience, and confidence, you’ll find greater success.
Stay prepared, and always listen to what the market is telling you.

Amateur vs. Professional GapsWhen analyzing gaps on a chart, the key question to ask yourself is this:
Did this gap result from amateur traders reacting emotionally, either buying or selling?
Or was it the professional traders, who base their decisions on logic rather than emotion?
To determine this, there's a crucial concept you need to grasp first...
Professional traders buy after a wave of selling and sell after a wave of buying.
Amateur traders, on the other hand, do the opposite! They see a stock rising and, driven by fear of missing out, rush to buy – right when the pros are preparing to sell.

4 entry-strategies with head & shouldersContrary to popular belief, which considers the head and shoulders pattern to be a reversal pattern, this pattern can also be a powerful continuation pattern!!did you know??
1-reversal role: in this case, when the neck-line of the head and shoulder breaks, sell and buy signals are issued (see the 2 items on the left in the picture)
And an BULLISH trend turns into a BEARISH trend or vice versa!!
2-continuation role: In this case, you should draw a line parallel to the neck-line, on the left shoulder. The break of this line is equivalent to buy or sell signal. In this case, we move in the direction of the trend before the formation of the pattern(see the 2 items on the right in the picture)
Important points of the head and shoulders pattern:
1- Before the pattern, an BULLISH or BEARISH trend should be seen. Just extend the neck-line to the left, if it passes through the body of the candles, then there is a PRE-trend.
2- Pay attention to the head and shoulder time-frame. You should consider a time-frame where the distance of the left shoulder from the head in this pattern is 15 to 55 candles!!
If you want to learn more, support me on this page!
Regarding training, I give examples on analytical posts. Be sure to follow.

Inverted Head and Shoulders: A Comprehensive GuideThe Inverted Head and Shoulders pattern is a popular and reliable reversal pattern that signals a potential shift from a downtrend to an uptrend. Understanding and identifying this pattern can provide traders with profitable trading opportunities.
Anatomy of the Inverted Head and Shoulders Pattern.
Left Shoulder: The price declines to a trough and subsequently rises.
Head: The price falls again, forming a lower trough.
Right Shoulder : The price rises once more before declining to a trough similar to the left shoulder.
Identifying the Pattern
To accurately identify an Inverted Head and Shoulders pattern, look for the following characteristics:
Three Troughs: The head should be the lowest point, with the two shoulders on either side.
Neckline: Draw a trendline connecting the peaks of the two shoulders. This line acts as a resistance level.
Breakout Confirmation
The pattern is confirmed once the price breaks above the neckline with increased volume. This breakout indicates a reversal of the previous downtrend and the start of a new uptrend.
Trading the Inverted Head and Shoulders
Entry Point
Enter a long position when the price closes above the neckline. To reduce false breakouts, consider waiting for a retest of the neckline as support.
Stop-Loss
Place the stop-loss order below the right shoulder to limit potential losses. This level provides a cushion against false breakouts and unexpected market movements.
Target Price
The target price can be estimated by measuring the distance from the head to the neckline and projecting this distance upward from the breakout point.
Example:
Example Reference image of chart ONGC on Daily Time Frame shared below
Distance from Head to Neckline: 62 points
Breakout Point: 280 points
Target Price: 342 points
Practical Example of ONGC chart
The neckline is drawn connecting the two peaks at 280 level. A breakout occurs at 280 level with increased volume and now candle closed bullish at 288 levels with Good intensity of Volumes.
Key Points to Remember
Volume: Volume should increase during the formation of the pattern, especially at the breakout point.
Timeframe: The pattern can form over various timeframes, but it is more reliable over longer periods.
Market Context: Always consider the broader market context and other technical indicators to confirm the pattern.
Conclusion
The Inverted Head and Shoulders pattern is a powerful tool for traders looking to capitalize on trend reversals. By understanding its structure and applying disciplined trading strategies, traders can enhance their ability to identify and profit from these patterns.
I am not Sebi registered analyst.
My studies are for educational purpose only.
Please Consult your financial advisor before trading or investing.
I am not responsible for any kinds of your profits and your losses.
Most investors treat trading as a hobby because they have a full-time job doing something else.
However, If you treat trading like a business, it will pay you like a business.
If you treat like a hobby, hobbies don't pay, they cost you...!
Hope this post is helpful to community
Happy Trading!
RK💕
Disclaimer and Risk Warning.
The analysis and discussion provided on in.tradingview.com is intended for educational purposes only and should not be relied upon for trading decisions. RK_Charts is not an investment adviser and the information provided here should not be taken as professional investment advice. Before buying or selling any investments, securities, or precious metals, it is recommended that you conduct your own due diligence. RK_Charts does not share in your profits and will not take responsibility for any losses you may incur. So Please Consult your financial advisor before trading or investing.

Cancellation of “Head-and-Shoulders” Pattern. Bears trapThe "Head-and-Shoulders" (H&S) pattern is considered a powerful trend reversal indicator. However, it can also become very costly for new traders. Yesterday, the S&P provided a great example of H&S cancellation. Traders who entered short on the break-out of the shoulders line (and Monday's low) incurred losses after the price returned to the previous day's range and rallied all the way up. Such scenarios happen more often than you might think.
To avoid being caught in such traps, it is important to consider two things:
1. Higher Level Context : In this example, the H&S pattern formed on the hourly time frame. But if we zoom out, we'll see that on the weekly chart, the price is in a strong uptrend, currently making new historical highs. This is a very bullish context, with buyers having full control over the price.
2. Price Behavior on the Break-out : Upon confirmation of a reversal pattern, you should expect sellers to jump in and drive the price down as fast as possible. It is "abnormal" to see the price returning to the previous range and gaining acceptance. This is a trigger that something is not right.
Some people will add volume analysis on the break-out, but I’m personally not a fan of it, especially for SPY.

Head and shoulderA very known and famous pattern (The chart is an old one whose target is almost reached Dont mind that) It has to shoulders or more (Small dips) and one head target is the distance between head low and neckline.

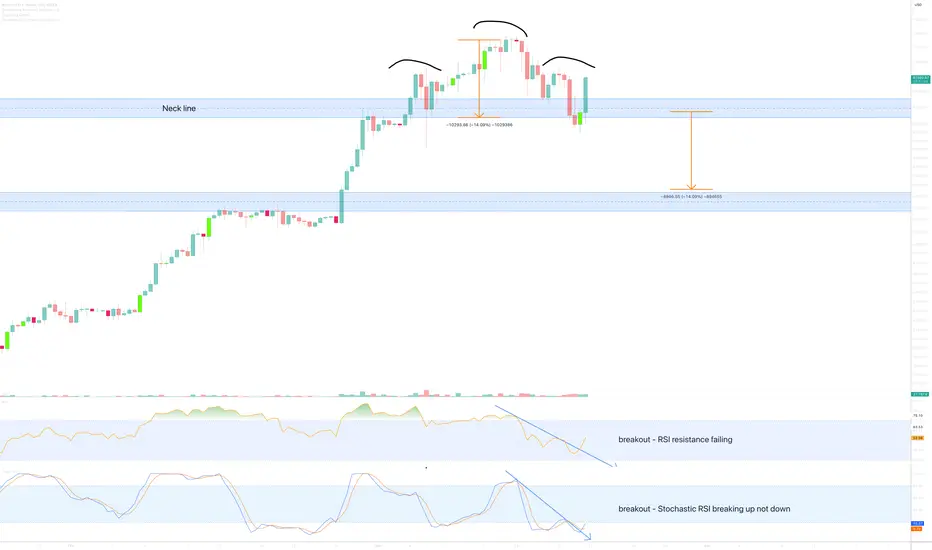
How to tell if a Head & Shoulders pattern is voidThere’s been a number of messages today informing me of the lower time frame head and shoulders pattern.
Traders are sometimes caught out with falsely identified head and shoulders patterns, and then the market runs in the opposite direction of that expected as the error is realised causing a energetic surge in price action as traders closes short positions.
How do you identify valid from void?
The last lower time frame (12hr examples used here) head and shoulders pattern printed in March 2022. There was a couple of leading indications this neckline would confirm as resistance at the time of the breakout:
1) RSI confirmed failed support (black circle)
2) Stochastic RSI is crossing down 80. Very bearish.
12hr head and shoulder March 2022
Now lets look above on the current 12hr chart (main chart)
1) RSI resistance is failing, a breakout is evident.
2) Stochastic RSI is crossing up not down! Very bullish.
There you have it. While many traders identify the price action of a head and shoulders pattern in isolation it is an expensive error to ignore what the oscillators are doing at the time of the print.
In almost all of the ideas published by Without Worries, if you look udder the main chart idea you’ll notice “Oscillators” as one of the selected indicators for use in the study. Now you know why!
Ww
Head and Shoulders Tutorial on Crude Oil ChartI have decided to start a short series of tutorials covering common instruments used in technical analysis.
In today's tutorial, we observe a successfully identified head and shoulders pattern on the 4-hour chart of Crude Oil, resulting in a substantial movement of around 17%.
Here's how to find the instrument: navigate to the left sidebar and select 'Patterns,' where you will find 'Head and Shoulders.'
Analyzing and trading correctly involve the following steps:
1) Both shoulders must form within a rising or falling trend. In the case of that Oil chart, we observe a rising trend, indicating a potential short position.
2) The size of the head becomes our target for take profit (TP), and upon reaching TP, we close 80% of the position.
3) Ideally, volumes at the right shoulder should decrease, and upon breaking, they should increase.
Risk Management Strategy:
1) Limit each trade to no more than 2% of your deposit.
2) Always utilize stop-loss and take-profit orders.
3) Never trade money you are not prepared to lose.
4) Start with small budgets.
It is crucial to emphasize that risk management must be adhered to whenever you engage in trading!
Register and trade stocks and crypto using my link with a discount on commissions: bingx.com/invite/E6RCUFJT

Price Action & Volume - A trick that will help you TODAY!People underestimate volume and what it could tell you about buyers and sellers in the market. This "strategy" or more accurately this way of understanding Volume can be utilized in any time frame and will open you up to understanding more movements and why things happen in "random" areas - when they are truly not random.
Hope this helps and as always,
Happy Trading!

Learn Best Price Action Patterns by Accuracy
Last year, I shared more than 1300 free signals and forecasts for Gold, Forex, Commodities and Indexes.
In my predictions, quite often I relied on classic price action patterns.
In this article, I will reveal the win rate of each pattern, the most accurate and the least accurate formations of the last year.
Please, note that all the predictions and forecasts that I shared this year are available on TradingView and you can back test any of the setup that I identified this year by your own. Just choose a relevant tag on my TradingView page.
Also, some forecasts & signals were based on a combination of multiple patterns.
Here is the list of the patterns that I personally trade:
🔘 Double Top or Bottom with Equal Highs
The pattern is considered to be valid when the highs or lows of the pattern are equal.
The pattern gives a bearish/bullish signal when its neckline is broken.
🔘 Double Top or Bottom with Lower High/Higher Low or Cup & Handle
The pattern is considered to be valid when the second top/bottom of the patterns is lower/higher than the first one.
The pattern gives a bearish/bullish signal when its neckline is broken.
🔘 Head & Shoulders and Inverted Head and Shoulders
The pattern gives a bearish/bullish signal when its neckline is broken.
🔘 Horizontal Range
The pattern is the extension of a classic double top/bottom with at least 3 equal highs/lows.
The pattern gives a bearish/bullish signal when its neckline is broken.
🔘 Bullish/Bearish Flag
The pattern represents a rising/falling parallel channel.
It gives a bullish/bearish signal when its upper/lower boundary is broken.
🔘 Rising/Falling Wedge Pattern
The pattern represents a contracting rising/falling channel.
It gives a bullish/bearish signal when its upper/lower boundary is broken.
🔘 Rising/Falling Expanding Wedge
The pattern represents an expanding rising/falling channel.
It gives a bullish/bearish signal when its upper/lower boundary is broken.
🔘 Descending/Ascending Triangle
The pattern is the extension of a cup & handle pattern with at least 2 lower highs/lows.
The pattern gives a bearish/bullish signal when its neckline is broken.
Please, also note that all the patterns that I identified and traded were formed on key horizontal or vertical structures.
Remember that the accuracy of any pattern drops dramatically if it is formed beyond key levels.
I consider the pattern to be a winning one if after a neckline breakout, it managed to reach the closest horizontal or vertical structure, not invalidating the pattern's highs/lows.
For example, if the price violated the high of the cup and handle pattern after its neckline breakout, such a pattern is losing one.
If it reached the closest structure without violation of the high, it is a winning pattern.
🔍 Double Top or Bottom with Equal Highs
I spotted 85 setups featuring these patterns.
Their accuracy is 62%.
🥉 Double Top or Bottom with Lower High/Higher Low or Cup & Handle
96 setups were spotted.
The performance turned out to be a little bit higher than a classic double top/bottom with 65% of the setups hitting the target.
🔍 Head & Shoulders and Inverted Head and Shoulders
58 formations spotted this year.
Average win rate is 64%
🏆 Horizontal Range
The most accurate pattern of this year.
More than 148 patterns were spotted and 74% among them gave accurate signal.
🔍 Bullish/Bearish Flag
38 setups identified this year.
The accuracy of the pattern is 57%
Rising/Falling Wedge
The pattern turned out to be a little bit more accurate.
Among 62 formations, 59% end up being profitable.
👎 Rising/Falling Expanding Wedge
The worst pattern of this year.
I recognized 24 patterns and their accuracy was just 51%.
🥈 Descending/Ascending Triangle
64 patterns were identified.
The win rate of the pattern is 66%.
The most important conclusion that we can make analyzing the performance of these patterns is that they all have an accuracy above 50%. If you properly combine these patterns with some other technical or fundamental tools, the accuracy of the setup will increase dramatically.
Good luck in your trading!
❤️Please, support my work with like, thank you!❤️
