The F1 Mindset Every Trader Needs!!!Most traders behave like they’re trying to win the race on the first lap.
Full throttle. No patience. And then they wonder why they spin out before the finish line.
🏎 But in Formula 1, especially under the lights of Abu Dhabi, the winners don’t drive the fastest…
They manage the race the smartest.
And trading is no different.
Here are the three F1 lessons every trader should master:
1️⃣You Don’t Win by Being Fast => You Win by Being Controlled
F1 drivers don’t go maximum speed all the time.
They manage tyres, fuel, engine temperature, and track conditions.
In trading, your “tyres” are your capital.
Burn them early with emotional trades, and your race is over.
Consistency beats speed.
Control beats excitement.
2️⃣ Your Strategy Is Your Pit Crew
No F1 driver wins alone, they rely on a team that’s fast, disciplined, and precise.
For traders, your “pit crew” is your:
- trading plan
- risk management
- journaling
- strategy rules
- routines
When your system is aligned, your performance becomes predictable.
When it's sloppy, you get undercut by the market every time.
3️⃣ The Race Is Won on Corners, Not Straights
Every driver can accelerate on the straights.
Champions gain their advantage in the corners — the difficult, technical parts of the track.
In trading, the “corners” are:
- drawdowns
- losing streaks
- choppy markets
- hesitation
- volatility spikes
Anyone can trade a trending market.
True professionals shine in difficult conditions.
🏁 Final Lap Insight
The Abu Dhabi Grand Prix doesn’t reward the loudest driver, it rewards the most disciplined.
Trading is exactly the same.
✔ The market is your circuit.
✔ Your account is your car.
✔ Your rules are your race line.
✔ And your mindset determines whether you finish… or crash out on turn one.
Trade like an F1 driver:
calm, calculated, consistent, and always thinking about the full race, not a single lap.
⚠️ Disclaimer: This is not financial advice. Always do your own research and manage risk properly.
📚 Stick to your trading plan regarding entries, risk, and management.
Good luck! 🍀
All Strategies Are Good; If Managed Properly!
~Richard Nasr
Community ideas

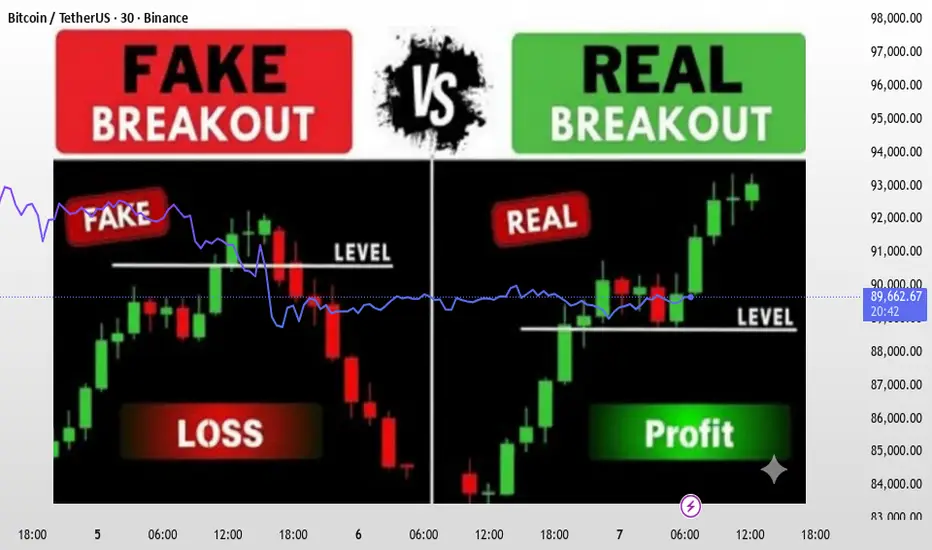
Breakout vs Fakeout – How to Identify the DifferenceBreakout vs Fakeout — The Complete Professional Guide
How Smart Money Creates Traps & How Traders Can Avoid Them
Breakouts and fakeouts are among the most misunderstood events in trading. Many traders enter too early, get trapped, and watch price reverse exactly after their entry. This educational idea explains, in depth, how institutions create fakeouts, how real breakouts are structured, and how you can confirm the difference using pure price action.
---
🔹 Understanding Market Behavior Behind Breakouts
Markets move from accumulation → manipulation → expansion.
The breakout or fakeout usually happens during the manipulation phase.
Smart Money (SMC) concepts play a major role here:
- Market builds liquidity above equal highs & below equal lows.
- Traders place buy stops or sell stops near key zones.
- Institutions trigger these stops to fill large orders.
- Only after trapping liquidity does the real move begin.
So before analysing a breakout, always ask:
👉 Who needs liquidity here — retail or institutions?
---
🔹 What Makes a Breakout Real?
A real breakout is not just a wick or a temporary push. It is a structural shift backed by momentum and confirmation.
✅ 1. Strong Candles With Clear Body Closes
A real breakout has wide-body candles closing decisively above resistance or below support.
Weak candles = weak intention.
✅ 2. Break + Retest + Continuation
The strongest breakouts follow this pattern:
1. Price breaks the level
2. Comes back for a clean retest
3. Holds structure
4. Forms a continuation pattern
This retest phase filters 70–80% of fakeouts.
✅ 3. Market Structure Shift (MSS / BOS)
For a bullish breakout:
- Price creates Higher Highs (HH) and Higher Lows (HL)
For bearish breakout:
- Price creates Lower Lows (LL) and Lower Highs (LH)
A breakout without structure change is not reliable.
✅ 4. Volume & Volatility Expansion
Breakouts must show an increase in:
- Volatility
- Candle size
- Trading activity
If volume remains flat, the breakout may fail.
---
🔹 How to Spot a Fakeout Before It Traps You
Fakeouts are intentional liquidity grabs. Here are the strongest warning signs:
❌ 1. Break Happens With Weak Candles
Small bodies, long wicks, hesitation candles — all indicate uncertainty.
❌ 2. Price Fails to Close Outside the Zone
This is the #1 rule:
If price does not close outside resistance/support, it is most likely a fakeout.
❌ 3. Instant Rejection Back Into the Range
If price breaks the level and immediately returns inside, institutions are hunting stops.
❌ 4. No Retest — Just a Sharp Reverse
Real breakouts retest.
Fakeouts don’t.
They reverse fast because their only purpose was liquidity collection.
❌ 5. Presence of Equal Highs / Equal Lows
When the market forms equal highs/lows, it signals liquidity pools.
Fakeouts usually occur right above/below these areas.
---
🔹 Advanced Confirmation Technique (Institutional Logic)
Here’s a professional-level method used by SMC traders:
1. Identify the liquidity zone (EQ highs/lows)
These serve as targets for traps.
2. Wait for the first breakout
Do not enter here.
3. Look for the rejection candle
A “fakeout candle” usually has:
- Long wick
- Small body
- Closes back inside the structure
4. Wait for BOS (Break of Structure)
Once price reverses and breaks an internal structure, the fakeout is confirmed.
5. Enter on the retest of the trap zone
This is the safest and most profitable entry.
---
🔹 Practical Example (General)
Let’s say Gold is ranging between $2400 - $2420.
- Price spikes above $2420, hits stops, and forms a long-wick candle
- The breakout candle fails to close above resistance
- Price immediately drops back inside the range
- Internal structure breaks → fakeout confirmed
- Retest of $2420 becomes the ideal sell entry
This exact behavior happens in XAUUSD almost daily.
---
🧠 Final Professional Tip
Breakouts are easy to trade once you stop trying to predict them.
Let the market show you:
- Strong close
- Clear retest
- Momentum
- Structural break
And avoid all entries based only on a wick touching resistance or support.
Patience is the difference between a trapped trader and a profitable trader.
Your boosts, comments, and likes motivate me to share more accurate analyses like this.
👉 If you found this helpful, please Boost the idea and leave a comment — it really helps!
— JT_CHARTsMaster
Why Gold Hits Your SL🌟 Why Gold Hits Your SL 😭💛📈
Gold is one of the most aggressive and volatile assets in the market — and if you’ve ever wondered “Why does gold ALWAYS hit my stop-loss before moving in my direction?”, this post explains the real reason.
Let’s break it down clearly 👇
🔶 1. Gold Loves Liquidity — Not Levels 💦💰
Gold doesn’t move based on your support/resistance lines.
It moves based on liquidity, meaning:
Where traders place stop-losses ❌
Where pending orders sit 🎯
Where large institutions want to fill positions 🏦
Your SL is simply sitting where everyone else puts theirs, which makes it prime liquidity.
🔶 2. XAUUSD Spikes Are Designed to Collect Orders ⚡💥
Gold often creates sudden:
Wicks
Fake breakouts
Quick pumps or dumps
Sharp candle spikes
These moves are NOT random — they’re engineered to:
🔸 Trigger stop-losses
🔸 Activate pending buy/sell orders
🔸 Grab liquidity before the real move
This is why your SL gets hit by $1–$3 before price completely reverses.
🔶 3. Gold Moves Session-by-Session 🕒🌍
Gold behaves differently depending on the time of day:
Asia session → Slow, tight range
London session → First big manipulation
New York session → Volatility explosion + real direction
Most SL hunts take place when London opens or when NY session begins ⚠️🔥
🔶 4. Clean Highs & Lows = SL Magnets 🧲📌
Gold LOVES attacking:
Previous day’s high/low
Asian range high/low
London session extremes
Double tops & bottoms
Round numbers (like 4000 / 4050 / 4100)
These areas hold thousands of stop-losses.
So before gold takes a real direction — it sweeps them first. 🏹😈
🔶 5. The Classic Gold Pattern: Trap → Reversal → Expansion 🔁🚀
Most XAUUSD moves follow this sequence:
1️⃣ Sweep liquidity 😭
2️⃣ Fake breakout 😈
3️⃣ Sharp rejection 👋
4️⃣ Real trend begins 🚀
If you’ve ever seen price:
Break a level
Wick hard
Then reverse the entire move
That’s gold performing a liquidity grab.
🔶 6. How To Avoid Getting Stopped Out ✔️
Here’s what actually helps:
🌟 A. Don’t put SL exactly at obvious levels
Move it beyond common liquidity zones.
🌟 B. Wait for the sweep before entering
Let gold perform the trap first.
🌟 C. Trade reaction — not prediction
Look for re-entry after the wick forms.
🌟 D. Use sessions to your advantage
Avoid placing SL right before London/NY opens.
🌟 Final Words
Gold isn’t hunting you —
it’s hunting liquidity.
Your job is simple:
👉 Stop placing stops where everyone else does
👉 Let gold sweep liquidity first
👉 Then catch the real move
Trade smarter, not tighter. 💛⚡

Why Bitcoin Endures While 90% of Altcoins Are Born to… Die Over more than five years of observing the crypto market, one clear pattern stands out: Bitcoin survives every cycle, while most altcoins only last a few storms before vanishing. This is not a subjective impression but a reality that any serious investor must understand. Bitcoin and altcoins differ in origin, value, and market strength, and these differences are what allow BTC to endure while most altcoins fade away early.
Bitcoin was created with the mission of becoming “digital gold.” It has a fixed supply of 21 million, operates in a decentralized manner, is not controlled by any single organization, and is widely accepted as a global asset. In contrast, around 90% of altcoins are launched primarily to raise capital, for marketing purposes, or to chase technological trends. Bitcoin exists because of real value; altcoins exist on temporary expectations. When these expectations fade, altcoins die, while trust in BTC grows, allowing Bitcoin to continue evolving and remain a cornerstone of the market.
Another distinction lies in cycles. Bitcoin follows a four-year halving cycle, moving through stages of accumulation, boom, correction, and re-accumulation. BTC consistently surpasses previous highs thanks to its stable cycle and long-term capital, which ensures enduring vitality. Altcoins, however, often experience a short life cycle: launch, hype, pump, dump, and eventual oblivion. Most altcoins stop at the final stage and never return to previous peaks, while Bitcoin always finds a way to reach new highs, demonstrating superior resilience.
Capital backing is also a decisive factor. Bitcoin is accumulated by ETFs, major banks, financial institutions, certain countries like El Salvador, and large corporations such as MicroStrategy. This represents long-term, sustainable capital capable of withstanding market fluctuations. Altcoins, on the other hand, rely mainly on short-term traders, retail FOMO, or social media marketing, making their prices highly volatile when capital exits. Thanks to stable institutional flows, Bitcoin is continuously accumulated and is rarely at risk of “dying” in any cycle.
Token structure creates another clear difference. Altcoins often undermine their own value through tokenomics: early unlocks, large team allocations, high inflation, and weak real demand. Bitcoin is entirely different: fixed supply, no one can mint more, and halving reduces supply over time. This increasing scarcity acts as a shield for its value, explaining why Bitcoin endures over time.
The biggest distinction also lies in the role of each type of currency. Bitcoin serves as the standard and backbone of the market; altcoins are merely “experimental products.” When BTC rises, altcoins revive; when BTC moves sideways, altcoins pump along with the flow; when BTC drops sharply, altcoins crash the hardest. This is a crucial reason for investors to understand that Bitcoin is a real asset, whereas altcoins are interchangeable products that can fail at any time.
Smart investing starts with understanding this difference. Bitcoin survives because of trust, economic structure, and real value, while altcoins exist on expectations, marketing, and short-term capital. To thrive long-term in the crypto market, you should treat Bitcoin as a foundational, enduring pillar and view altcoins as short-term, high-risk opportunities. Once you grasp this rule, you will avoid being swept into “moonshot” projects or holding altcoins that never return to previous highs, and instead invest with strategic vision rather than emotion.

Top 5 Mindset Mistakes That Kill Your Trades⭐ Top 5 Mindset Mistakes That Kill Your Trades
Your strategy is not the problem — your mindset is.
Most traders lose because emotions control decisions.
Fix these 5 mindset mistakes, and your results change immediately.
1️⃣ Revenge Trading — Trading From Emotion, Not Logic 😡🔥
After a loss, many traders try to “win it back” immediately.
This leads to:
impulsive entries 🎯
oversized positions 💥
chasing price 🏃♂️💨
breaking rules 📉
Revenge trading is the fastest way to destroy your account.
✔️ Fix: Stop trading after a big emotional loss. Reset → Review → Return calm.
2️⃣ Fear & Greed — The Two Emotions That Control the Market 😰💰
Fear makes you exit too early.
Greed makes you hold too long.
They cause:
hesitation ❌
early exits 🏳️
chasing breakouts 🚀
ignoring risk limits ⚠️
Fear and greed create emotional, not technical trades.
✔️ Fix: Set TP/SL BEFORE entering — never adjust emotionally.
3️⃣ Overtrading & No Clear Plan 📊🌀
Trading randomly because “the chart looks good” is gambling.
Overtrading drains your money AND your discipline.
You overtrade when:
you want constant action 🎲
you feel FOMO 😵💫
you jump between setups ⚡
you trade every candle 🕒
✔️ Fix: Build a simple plan:
Entry rules ✏️
Exit rules 🎯
Risk per trade 📐
Trading times ⏰
Follow it with discipline.
4️⃣ Impatience — Forcing Trades Before They’re Ready ⏳⚡
Most losses come from entering too early or too late.
Impatience creates fake setups in your mind.
Signs of impatience:
entering before confirmation 🚦
exiting trades too early 😓
forcing a trade because you’re bored 😴
chasing volatility 💨
✔️ Fix: Wait for your confirmation signals.
Patience pays more than speed in trading.
5️⃣ Emotional Attachment to Losing Trades 💔📉
You hold a losing trade because:
you don’t want to accept the loss 😤
you hope the market “comes back” 🙏
your ego hates being wrong 💭
This mindset destroys accounts faster than anything else.
✔️ Fix: Treat losses as part of the statistical process — not personal failure.
🌟 Final Message
Controlling emotions is more powerful than any indicator.
Master your discipline, patience, and neutral mindset, and your trading results will transform.
Your mind is the real trading system. 🧠✨

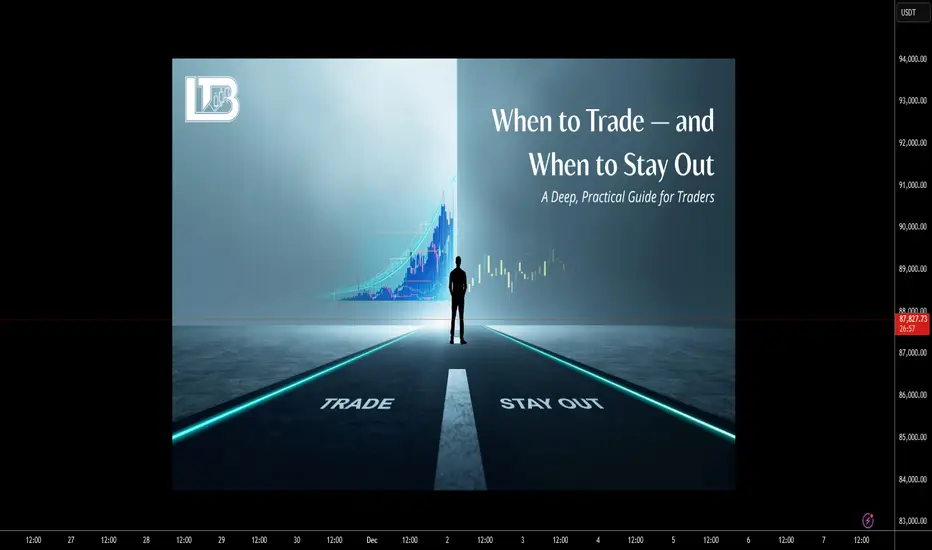
When to Trade — When to Stay OutWhen to Trade — When to Stay Out: A Deep, Practical Guide for Traders
Timing is a core edge. Not every hour, session, or chart condition is trade-worthy. The difference between a profitable trader and an active losing trader is not how many trades they take — it’s which trades they take and when. This article gives you a detailed, systematic framework to decide when to trade and when to stay out, with concrete rules, time windows, checklists and worked examples.
Big-picture logic
Markets are driven by liquidity (where orders sit), volatility (how fast price moves) and participants (who is trading). Good timing aligns these three:
Liquidity concentration (institutions, marketmakers) produces cleaner, higher-probability moves.
Right volatility means enough movement to reach targets but not so much that stop losses are random.
Recognizable market structure (trends, ranges, breaks) allows rules to be applied consistently.
If any of the three is missing, edge declines and risk of random losses rises.
Session windows — when the market is most tradable
Below are standard session definitions in UTC+00:00. Adjust for daylight savings if required (noted where relevant).
Tokyo / Asian Session
⏵ UTC+00:00: 23:00 – 08:00 ( main liquidity often 23:00–02:00 UTC )
⏵ Characteristic: lower liquidity for major FX pairs, choppier price action. Exceptions: JPY crosses, pairs with Asia-led liquidity, and crypto (24/7).
London Session
⏵ UTC+00:00: 07:00 – 16:00 (most active 08:00–11:00 UTC)
⏵ Characteristic: heavy institutional flow, high liquidity. Many clear directional moves begin here.
New York Session
⏵ UTC+00:00: 12:00 – 21:00 (most active 13:00–16:00 UTC)
⏵ Characteristic: continuation or reversal of London moves; major news releases occur here.
Key overlap (best single window)
⏵ London–New York overlap: UTC+00:00 ~12:00–16:00. Highest combined liquidity and volatility; most “clean” trends and reliable breakouts occur here.
Rule of thumb: Prefer intraday trades during the London session and the London–New York overlap. Be selective in Asia unless trading JPY pairs or range-break strategies designed for low liquidity.
Concrete: Best times to trade (prioritized)
Session open impulse — first 60–120 minutes of London or New York sessions.
Overlap window — London + New York overlap (UTC+00:00 ~12:00–16:00).
Post-news verified moves — 10–30 minutes after high-impact macro prints, if market structure becomes clear and isn’t just noise.
Clear breakouts after consolidation during active sessions (volume confirmation, sweep of liquidity, not just a one-bar spike).
When to avoid trading (and why)
Low-volume Asian hours for majors — price tends to chop and give false signals.
Right before major macro releases (NFP, CPI, FOMC) — price can gap or spike unpredictably. Exceptions: defined volatility playbook with strict hedges.
Midday lulls after initial session impulse — often flat ranges and low edge.
On unclear structure / messy price action — wide, overlapping candles, no clear swing highs/lows.
During market holidays or early close days — liquidity is thin; spreads widen.
Pre-trade checklist
Time window OK? (London / NY open or high liquidity event)
Major news? (No significant release within ±30 mins)
Higher timeframe structure clear? (H4 or Daily trend / range)
Trade idea defined (entry, stop, target) — use price levels, not indicators only.
Risk per trade ≤ planned % of account (see position sizing).
Reward : Risk ≥ your minimum (e.g., 1.5–3:1 depending on edge).
Catastrophic stop capability confirmed (can you absorb worst-case slippage?)
Exit rules set (profit-taking scale or full exit)
Trade logged in journal immediately after (reason, setup, time, bias)
Position sizing — exact worked example (step-by-step)
Use a fixed % of equity for risk per trade (commonly 0.5%–2%). Example uses 1% risk.
Assume:
Account size = $10,000.
Risk per trade = 1% of account = $10,000 × 0.01.
We compute digit-by-digit: 10,000 × 0.01 = 100. So maximum $100 risk on this trade.
Generic position-size formula:
Position size (units) = (Account Size × Risk%) ÷ (Stop Distance in price units × Value per price unit per 1 unit)
Always recalc pip/value for cross rates and for instruments (stocks, futures, crypto) — adapt the “value per price unit” accordingly.
Money Management is much more important than a strategy. You should learn Money Management before trying any strategy.
Order types & execution rules
Limit entries at confluence levels (support/resistance + liquidity sweep zone) — better price and less slippage.
Stop orders for breakout entries — use when you want to enter only after momentum confirms.
OCO (One Cancels Other) for scaling / invalidation management — reduces manual errors.
Avoid market entries during major news due to slippage/gap risk, unless your plan accounts for it.
Trade management & exits
Initial target: defined by structure (previous swing, ATR multiples, measured moves).
Scale out: consider taking partial profits at the first reasonable target, let the rest run with a trailing stop.
Stop relocation: only move stop to breakeven after a predefined profit multiple reached (e.g., after +1R or after price clears a new structure). Don’t move stops based on emotion.
If price returns and breaks your entry zone invalidating the setup, exit — the market changed.
Strategy-specific timing tweaks
Trend-following: prefer strong sessions (London/NY) and avoid Asian low-liquidity hours. Enter on retracements that align with higher timeframe trend.
Range / mean-reversion: worst during session opens; best during mid-session lulls, but only if volatility is low and boundaries are clear.
Breakout strategies: require confirmation — e.g., breakout during overlap or accompanied by increased volume / volatility. Avoid breakouts in thin Asian hours.
News scalping: high risk; only for experienced traders with defined entry, strict spread/latency controls, and capital to absorb spikes.
Common mistakes (and how to fix them)
Trading outside your chosen time windows — fix: enforce a trading clock.
Overtrading in chop — fix: increase minimum R:R and wait for clear structure.
Ignoring spreads and liquidity — fix: include spread in stop/target math and avoid thin sessions.
Moving stops prematurely — fix: use rules (e.g., only move after +1R).
Trading news impulsively — fix: have a news plan: either avoid or have a predefined volatility playbook.
Emotional trading (e.g. not closing the position when the price hits stop-loss)
Psychological & routine rules
Trade only when rested and focused.
Limit screen time to your pre-set sessions.
Keep a journal: reason for trade, outcome, lessons. Review weekly.
Daily routine: pre-market scan 30–60 minutes before your active session, post-session journal entry.
FAQ
Q: Can I trade during Asian hours?
A: Yes — but selectively. Prefer JPY pairs, Asia-centric instruments, or strategies built for low volatility.
Q: What if my timeframe and session disagree?
A: Give priority to higher timeframe structure. If H4 / Daily shows trend, trade during active sessions for better fills.
Q: How much should I risk per trade?
A: Conservative traders use 0.5%–1% per trade. More aggressive ones use up to 2%. The key is consistency and drawdown planning.
Focus your trading during high-liquidity windows (London, New York, and their overlap), avoid low-volume and pre-news periods, always validate trades with liquidity + volatility + clear market structure, use strict risk management (e.g., 1% per trade with position sizing), and follow a pre-trade checklist to avoid low-quality setups. Better timing = better edge.
Enjoy!
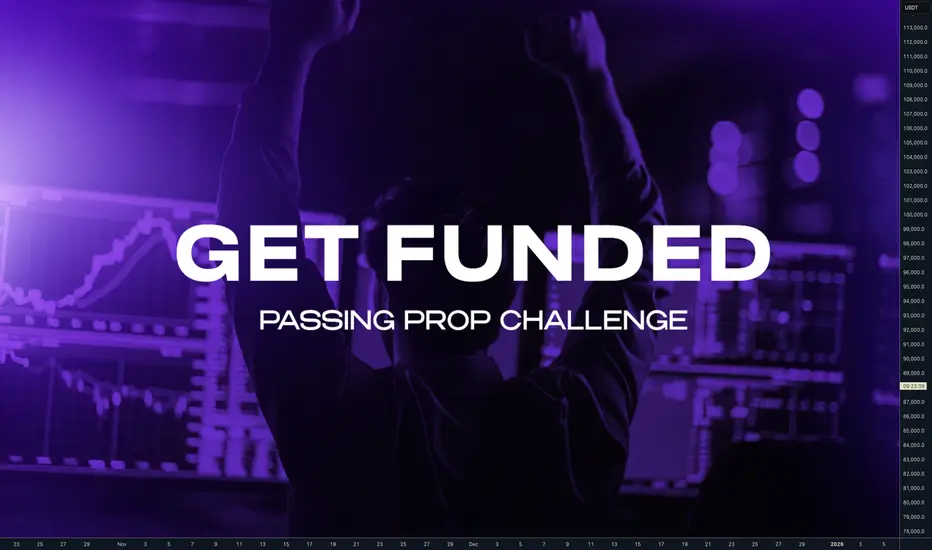
Get Funded and make $20 000 Monthly. Complete plan for 2026.Hey traders let's have a look at prop trading again. It's a great opportunity for the skilled traders who has good strategy, discipline and mastered risk management. Let's start with the numbers which many traders and misunderstood.
📌 Prop firm facts
- $100K account with 10% max drawdown means you got $10K account, not $100K
- Goal of 10% to pass phase 1 while you can risk 10% means 100% gain
- Goal of 5% to pass Phase 2 while you can risk 10% adds another 50% gain.
- You will literally be funded after making 150% not 10% and 5%
⁉️ Does it mean it's impossible to get funded ?
Yes it's possible, next to good strategy you need, discipline and mainly you just need to adjust your risk management. If you make 150% in year as a Hedge fund manager you will be a superstar trader. Yet people still want to pass prop challenge in a less than week or in a few trades which means not sticking to the risk management.
🔗 Click to the picture below to Learn more about Prop Risk management 📌 How to make $20 000 a month ? Magic of 3%
Yes, you actually need to make only a 3% a month. Is it difficult ? No, It's not. You need 3 wins with 1:2 RR while risking 0.5% Risk.
1️⃣Your Ultimate goal - -$100K Funded account - 3% Gain - 80% Profit split = $2400 Payout
2️⃣Let's take it to $20 000 a Month
Don't try to increase your % gains per month, increase your capital under management
- Get another 4 x $ 100K Challenges pass them - You will have $500K AUM:
- $ 500 000 - 3% Gain - 80% Profit split = $12 000
3️⃣Reinvest buy another 3 - 5 challenges aim for $ 1000 000 funded across few solid props firms. 🎯 $ 1000 000 - 3% gain - 80% Profit Split = $24 000 Payout
📌 Have a long term plan
this is not gonna happen in few months. It's a year plan - But you got this... 💪
With approximate cost of $500 - $600 per $100K challenge you will need to spend apron. $5500 to get $1000 000 funding. You will fail some, its unavoidable, so let's count with more might $10K. But still , you can start with first $100K an then reinvest to another challenges. You dont need $10K investment right now. But later this $10K and 3% gain and 80% profit split is $24 000, even more then $20K.
📌 Difficulty is not technical, but in patience
I speak from experiences that my biggest mistakes was trying to pass quickly or when I was in drawdown I started to gamble. Be patient and stick to the rules. If we stick to 3% a month without progressive risk management it would be 4 months to get funded. If you do progressive risk management you can do it faster, and once you are confident you can run multiple challenges at the same time.
📌 Long term plan requires perfect planning
Find 60 minutes just for yourself and this about these questions below, write the answers to to the paper, think about the execution of your project. I know you didn't do it now, but come back to this and do it again. You need to visualize your future successful yourself and remind that visualization every day. I recommend a book - Psycho-cybernetics from Maxwell Maltz it will help you define your self-image of successful trader in the fact this book will change your life.
📌 Essential Rules for Prop Trading
-Its not a straight forward game
-Reduce number of trades - Only A+ Setups
- Grow Your Capital Under management in multiple firms not % gains
- 3% is a golden profit in prop space to live from trading
❌ Dont do this
If you don't trade well on small account, getting prop firm will not change it.
Don't expect it to be a solution to bad financial situation. It's extension. 🧪 Trading is not hard we often overcomplicate it
I believe you already few great trades in a month, but you also have many unnecessary ones, look at your last few month results and check if would be able to make 3% if you excluded those unnecessary trades. I sure you could ant thats what you have to do
Switch from machine gunner to a Sniper.
Write this on a paper and put it somewhere so you see it every day.
🎯 $ 1000 000 - 3% gain - 80% Profit Split = $24 000 Payout
🎯 $ 1000 000 - 3% gain - 80% Profit Split = $24 000 Payout
🎯 $ 1000 000 - 3% gain - 80% Profit Split = $24 000 Payout
$1000 000 Funding !! - Your ultimate goal for 2026 💪
I promised myself I’d become the person I once needed the most as a beginner. Below are links to a powerful lessons I shared on Tradingview. Hope it can help you avoid years of trial and error I went thru.
📊 Sharpen your trading Strategy
⚙️ 100% Mechanical System - Complete Strategy
🔁 Daily Bias – Continuation
🔄 Daily Bias – Reversal
🧱 Key Level – Order Block
📉 How to Buy Lows and Sell Highs
🎯 Dealing Range – Enter on pullbacks
💧 Liquidity – Basics to understand
🕒 Timeframe Alignments
🚫 Market Narratives – Avoid traps
🐢 Turtle Soup Master – High reward method
🧘 How to stop overcomplicating trading
🕰️ Day Trading Cheat Code – Sessions
🇬🇧 London Session Trading
🔍 SMT Divergence – Secret Smart Money signal
📐 Standard Deviations – Predict future targets
🎣 Stop Hunt Trading
🧠 Level Up your Mindset
🛕 Monk Mode – Transition from 9–5 to full-time trading
⚠️ Trading Enemies – Habits that destroy success
🔄 Trader’s Routine – Build discipline daily
🛡️ Risk Management
🏦 Risk Management for Prop Trading
📏 Risk in % or Fixed Position Size
🔐 Risk Per Trade – Keep consistency
Gold Forex Trading During Major Economic Events & News Releases
I guess you already noticed how impulsively the markets may react to economic events and news.
In this article, I will teach you a simple strategy to follow during important news release s and how to trade news.
1. Sort out the economic calendar
There are a lot of news in the economic calendar.
They are not equal in their impact.
Most of the economic calendars indicate the potential significance of each event: while some news have low importance, some have medium importance and some are considered to be extremely important.
For example, above is the list of coming UK fundamental news.
You can see that these news have different degree of importance.
My recommendation to you is to sort out the economic calendar in a way, so it would display only the most important news.
Among the news that we discussed above, only one release has high importance.
2. Know on what trading instruments does the news have an effect
While some of the news in the economic calendar may impact many financial markets and trading instruments, some news may affect very particular instruments.
For example, a FED Interest Rate decision may have a very broad effect on financial markets.
At the same time, Interest Rate Decision in Australia may affect only Australia - related instruments.
3. Don't trade one hour before the news and one hour after the release
Once you see the important fundamental news coming, don't trade the trading instruments that can be affected by the new s 1 hour before and after the release.
For example, in 5 minutes we are expecting important UK news - CPI data.
I stopped trading GBP pairs 1 hour before the release of the news, and will resume trading them one hour after the release.
4. Protect your trading positions 5 minutes ahead of the news
If you have an active trading position and related important news are expected, move your stop loss to entry 5 minutes ahead of the release of the news.
For example, I have a short trade on GBPAUD. I see that in 5 minutes important UK data is coming. I will move stop loss to entry 5 minutes ahead of the news and make a position risk-free.
I always say to my students, that news trading is very complicated. Due to a high volatility, it is very hard to make wise decision during the news releases.
The approach that I suggest will help you to avoid all that and trade the markets when they are calm.
❤️Please, support my work with like, thank you!❤️
I am part of Trade Nation's Influencer program and receive a monthly fee for using their TradingView charts in my analysis.

The Impact of Corporations on Global Trade1. Corporations as Engines of Trade Expansion
Corporations, especially MNCs, are central to the expansion of global trade. These organizations operate in multiple countries, producing and selling goods and services on a scale that often surpasses the capacity of national economies. By establishing subsidiaries and joint ventures in foreign markets, corporations increase trade flows both in imports and exports. For instance, a technology company headquartered in the United States may source components from Japan, manufacture products in China, and sell them across Europe, effectively linking multiple economies through a single corporate network. This activity not only boosts trade volumes but also diversifies market opportunities for smaller businesses that supply inputs to these corporations.
2. Supply Chain Integration and Global Value Chains
A critical way in which corporations impact global trade is through the development of global supply chains and value chains. Modern production processes are fragmented across nations, allowing corporations to optimize costs, access specialized skills, and leverage comparative advantages. For example, automotive companies often design vehicles in Europe, manufacture engines in Germany, assemble components in Mexico, and distribute finished products worldwide. These intricate supply chains have led to the emergence of Global Value Chains (GVCs), where value is added in different stages across multiple countries. This fragmentation increases cross-border trade in intermediate goods and services, significantly expanding global trade volumes.
3. Technology Transfer and Knowledge Dissemination
Corporations are key conduits of technology and knowledge transfer across borders. When a corporation invests in a foreign country, it often brings advanced production techniques, management practices, and innovation capabilities. This transfer of technology boosts the productivity and competitiveness of the host country, indirectly influencing trade by enhancing export potential. For example, foreign direct investment (FDI) by high-tech corporations in developing economies can enable local firms to adopt modern technologies, facilitating the production of export-quality goods and services. Consequently, corporations not only trade goods but also foster skill development and technological upgrading globally.
4. Market Creation and Consumer Demand Expansion
Corporations also shape global trade by creating new markets and stimulating consumer demand. Through strategic marketing, product localization, and brand recognition, corporations expand the reach of their products to international markets. This expansion often encourages other domestic and international suppliers to enter these markets, increasing trade activity. For instance, the entry of multinational consumer goods companies into emerging economies often introduces a range of new products and stimulates imports of raw materials, packaging, and equipment. This effect extends beyond mere consumption—it establishes long-term trade relationships between suppliers and corporate buyers worldwide.
5. Influence on Trade Policy and International Regulations
Large corporations often influence global trade policies and regulations. Through lobbying, strategic partnerships, and participation in international organizations, corporations can affect trade agreements, tariffs, and standards. For example, tech giants may lobby for reduced tariffs on electronic goods or for harmonized digital standards, thereby facilitating smoother cross-border trade. Their influence can also shape regulatory frameworks regarding intellectual property, environmental standards, and labor practices, which in turn affect how trade flows are structured globally. While this can accelerate trade liberalization, it may also create challenges for smaller firms that cannot navigate complex regulatory environments.
6. Economic Impact and Market Competition
Corporations’ impact on global trade extends to economic growth and market competition. By expanding into new markets, corporations generate employment, contribute to tax revenues, and foster industrial development. Increased competition from multinational entrants can encourage local firms to innovate and improve efficiency, raising the overall competitiveness of industries in different countries. However, this dominance can also concentrate market power, leading to monopolistic practices that may distort trade and limit benefits for smaller players. The balance between stimulating trade and maintaining fair competition is a critical aspect of corporate influence on the global economy.
7. Challenges and Criticisms
Despite their positive contributions, corporations’ role in global trade is not without criticism. Critics argue that MNCs can exacerbate economic inequality by extracting resources from developing nations without sufficient local reinvestment. They may exploit labor and environmental regulations to minimize costs, leading to social and ecological consequences. Additionally, the dominance of a few large corporations in key sectors, such as technology or pharmaceuticals, can limit market access for smaller firms and distort trade dynamics. Trade imbalances may also arise if corporations disproportionately favor production in low-cost countries while concentrating profits in high-income regions. Addressing these challenges requires international cooperation, responsible corporate governance, and equitable trade policies.
8. Future Trends and Evolving Corporate Roles
The role of corporations in global trade is evolving in response to technological innovation, geopolitical shifts, and sustainability concerns. The rise of digital platforms and e-commerce enables even small and medium-sized enterprises (SMEs) to engage in cross-border trade, challenging the traditional dominance of large corporations. Sustainability initiatives are pushing corporations to consider environmental and social factors in supply chains, potentially reshaping trade patterns toward greener practices. Moreover, geopolitical tensions, trade wars, and regional trade agreements are influencing corporate decisions on production locations and supply chain management, reflecting a more complex and strategic approach to global trade.
Conclusion
Corporations, particularly multinational ones, are fundamental drivers of global trade. They expand markets, integrate supply chains, transfer technology, and shape consumer demand, all of which amplify international trade flows. At the same time, they wield significant influence over trade policies and economic structures, generating both opportunities and challenges for global markets. While their operations contribute to economic growth and innovation, they also raise concerns regarding inequality, environmental impact, and market concentration. Understanding the multifaceted impact of corporations on global trade is essential for policymakers, businesses, and international organizations seeking to foster equitable, sustainable, and efficient trade systems. As global commerce continues to evolve, the role of corporations will remain central, shaping not only the movement of goods and services but also the broader economic landscape of the 21st century.

Volume EPO – One bar, seven volume stories Volume EPO – One bar, seven volume stories (VAKFN, Borsa Istanbul)
This idea illustrates how different volume-classification methods can produce very different interpretations of the same bar. The Volume EPO overlay is used as a research tool to display seven methods side by side in a compact HUD.
The example is taken from VAKFN on Borsa Istanbul. On this market, TradingView provides extended intrabar volume data (BIST volume data plan), which allows the Intrabar row of the table to be built from lower-timeframe up/down volume and used as a high-precision benchmark.
Price is shown on the daily chart inside an ascending channel. The last daily bar in that structure is analyzed with the Volume EPO table on the right. Total volume on that bar is the same for every row (66.49M), but each method splits it into buy / sell / delta differently:
- Intrabar (Ref) – lower-timeframe up/down volume
≈ 36.66M buy vs 29.83M sell → delta +6.83M (moderate net buying; benchmark “truth layer”).
- BVC (Smart) – probabilistic split via normal CDF on normalized price change
Delta ≈ +7.61M, very close to Intrabar (Diff ≈ 1.1%), confirming a mild buy imbalance.
- Tick Rule – classic uptick/downtick classifier
Because the close is above the previous close, the whole 66.49M is classified as buy volume
→ delta +66.49M (Diff ≈ 90%), an extremely bullish reading.
- Lee-Ready Style – delayed midpoint quote test with Tick fallback
On this bar the close falls on the sell side of the delayed midpoint, so the entire volume is classified as selling
→ delta −66.49M (Diff ≈ 110%), the exact opposite of Tick Rule.
- Wick Imbalance – geometric supply/demand from upper vs lower wicks
A strong upper wick and weak close again lead to a full sell reading
→ delta −66.49M (Diff ≈ 110%).
- ML-Logit – logistic model of normalized return and volume deviation
Shows only a small negative imbalance
→ delta ≈ −1.38M (Diff ≈ 12.1%), close to neutral flow.
- Geometry – legacy CLV-style candle approximation
With the close near the low of the range, more volume is assigned to sellers
→ delta ≈ −33.25M (Diff ≈ 60.1%), strong selling.
On this single daily bar of VAKFN, the conclusions range from “mild net buying” (Intrabar, BVC) to “massive buying” (Tick Rule), “massive selling” (Lee-Ready Style, Wick Imbalance), “almost neutral” (ML-Logit), and “strong selling” (Geometry).
Only the Intrabar row uses actual lower-timeframe up/down volume from TradingView; all other rows are models built on top of OHLCV. Access to deeper intrabar history on small timeframes (such as 1s/5s, depending on data plan and subscription level for BIST) strengthens this benchmark layer and makes it easier to see which methods stay close to the underlying flow and which ones drift away.
This idea is presented as a research and educational example on VAKFN, not as a trade signal or financial advice.

Intermarket Perspective: Gold – Oil – Dollar IndexThree Markets, One Big Picture
If you want to understand where XAUUSD is now — and where it is likely to move next — you cannot look at gold alone.
In today’s market, Intermarket Analysis is essential to reading real money flow.
The three markets you must watch together are:
Gold – Oil – Dollar Index (DXY).
They interact like three gears in the same machine.
Let’s break down how these markets connect — and how professional traders use them to anticipate gold’s next move.
1. Gold – The Safe-Haven and Market Risk Barometer
Gold reflects expectations about:
Interest rates
Inflation
Geopolitical risk
Safe-haven flows
Important Principle:
Lower rates → weaker USD → lower yields → stronger gold.
Gold is extremely sensitive to the DXY and the U.S. 10-year yield.
But looking at USD alone is not enough — that’s where Oil enters the picture.
2. Oil – The Engine of Global Inflation
Oil is not “just a commodity” — it is the foundation of inflation.
When oil rises sharply:
Transportation costs rise
Production costs increase
Inflation spreads across the economy
This forces central banks to maintain or raise interest rates.
→ Higher rate expectations often pressure gold lower
→ And support the Dollar Index
In short:
Oil ↑ → Inflation ↑ → Fed turns hawkish → USD ↑ → Gold ↓
Not always 1:1, but this is the classic money-flow pattern.
3. Dollar Index (DXY) – The Global Money Compass
DXY measures USD strength against major currencies.
When DXY rises, it usually signals:
Higher interest rate expectations
Risk-off sentiment
Growing demand for USD
This typically:
→ Pressures gold downward
→ Impacts oil prices because oil is USD-denominated
Strong DXY = Weak Gold
Weak DXY = Gold has room to rally
4. How These Three Markets Interact
Scenario 1: DXY Up – Oil Up – Gold Down
→ High inflation, hawkish Fed, strong USD
→ Gold faces pressure due to rising yields
→ Oil may rise from supply issues or geopolitical tension
Scenario 2: DXY Down – Gold Up – Oil Flat or Down
→ Rate-cut expectations rise
→ Gold benefits most
→ Oil may lag due to supply-demand dynamics
Scenario 3: Oil Spikes – Gold & DXY Move Mixed
→ Inflation rises
→ DXY may strengthen
→ Gold can rise due to recession fears
This is usually a volatile phase filled with false signals.
5. As a Gold Trader, What Should You Watch?
(1) DXY
If DXY breaks its bullish structure → gold often prepares for a strong move.
(2) Oil
Rising oil pushes inflation up → gold may fall initially but can surge later if economic risks grow.
(3) Macro Data
Fed policy
OPEC decisions
CPI, PCE
Oil inventory data
U.S. employment numbers
These are the lifeblood connecting all three markets.

The Discipline of Doing Nothing“A trader’s strength is not measured by how often they enter…
but by how long they can wait.”
Most traders believe progress happens when they trade.
But in reality, progress often happens in the moments when
you choose not to trade.
Waiting is not passive.
It is an active decision to protect capital.
It is choosing patience over impulse.
It is the discipline that separates a gambler from a trader.
Why Doing Nothing Is Hard
Your brain seeks stimulation, not discipline.
Silence creates discomfort.
Watching price move without you creates doubt.
So you justify a trade:
“It might run…”
“It looks like a breakout…”
“It could work…”
But price doesn’t reward “could.”
Price rewards confirmation and alignment.
What Doing Nothing Actually Means
• You skip trades that don’t fit your plan
• You conserve emotional energy
• You let the market come to your level
• You wait for structure to speak clearly
Every skipped bad trade increases your edge.
Every patient decision sharpens your mindset.
Doing nothing gives you the chance to do something right.
The Invisible Skill
Nobody sees the trades you avoid.
Nobody congratulates you for sitting on your hands.
But those unseen decisions prevent the biggest losses.
The most profitable trades
often start with stillness.
📘 Shared by @ChartIsMirror
Do you respect the moments between setups…
or do you rush to fill them? Comment below.

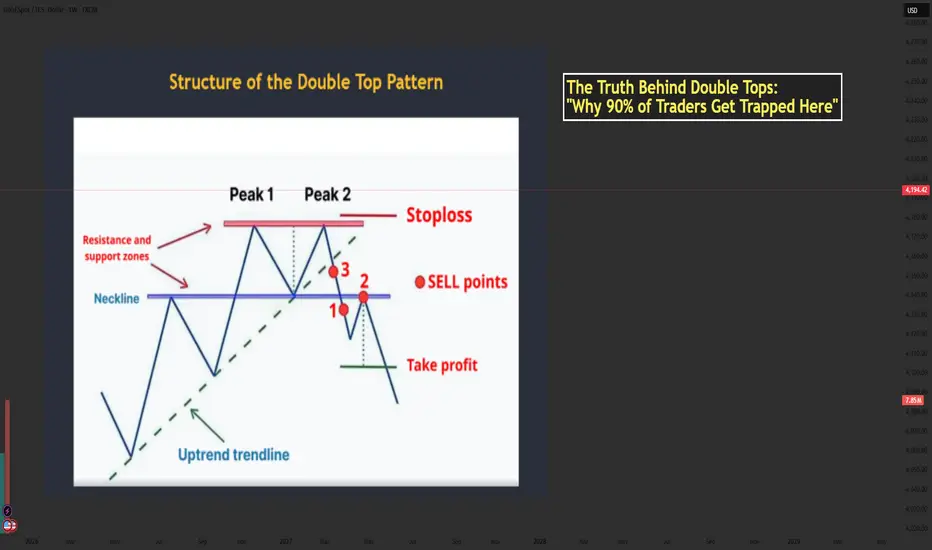
The Truth Behind Double Tops: Why 90% of Traders Get Trapped...📘 Mastering the Double Top Pattern — Structure, Psychology & How Smart Money Uses It
- The Double Top is one of the most powerful reversal patterns in technical analysis. When used correctly, it helps traders catch the transition from bullish momentum → bearish reversal with high accuracy.
- Let’s break down the structure using the chart you provided and enhance it with professional-level insights.
🔶 1. Structure of the Double Top
1️⃣ The First Top
- Price pushes upward strongly during an uptrend.
- Buyers are in full control and create the first peak.
- After reaching resistance, price pulls back → forming the neckline.
This pullback is normal and represents the market taking profits.
2️⃣ The Second Top
- Price rallies again but fails to break above Peak 1.
- This failure is extremely important — it shows bulls are losing strength.
- The second top traps late buyers who expect a breakout.
3️⃣ The Neckline Break
- Once price breaks below the neckline, the structure is officially confirmed.
- This represents sellers overwhelming buyers.
- A break of structure → shift in market control.
📌 Professional traders only consider the pattern valid AFTER the neckline break.
🔶 2. Market Psychology Behind the Double Top
Understanding the pattern’s psychology is what separates beginners from professional traders.
1️⃣ At Peak 1
Bulls believe the trend will continue.
Retail traders buy aggressively.
2️⃣ Pullback to Neckline
A healthy correction occurs; no one expects a reversal yet.
3️⃣ At Peak 2
This is where emotions start to shift:
- Retail buyers expect a breakout.
- Smart Money uses this area as a liquidity zone to trigger buy stops.
- Institutions often sell into this liquidity, creating the foundation for reversal.
4️⃣ Neckline Break
Panic begins:
Buyers trapped at Peak 2 start closing positions.
Sellers enter aggressively.
Momentum shifts — the trend has reversed.
5️⃣ Retest
The retest is a psychological trap:
- Trapped buyers hope for “one more push up.”
- Sellers add positions at better prices.
- When price rejects the neckline → the downtrend accelerates.
💡 This is why the retest is the safest sell entry.
🔶 3. Conditions for a High-Quality Double Top
To avoid fake patterns, check these criteria:
✔️ Must appear after a clear uptrend
✔️ Both tops should be similar in height
✔️ Volume should decrease on the second top
✔️ Neckline breakout must be decisive and clean
✔️ Better if second peak creates a stop-hunt wicking above Peak 1
✔️ Even more powerful when aligned with:
- HTF resistance
- Institutional zones
- Liquidity sweeps
- Overbought RSI
- Divergence
🔶 4. How to Trade the Double Top
1️⃣ Entry (Sell Zone)
Best Entry:
👉 SELL on the neckline retest after the breakout.
This gives:
- Best accuracy
- Best risk–reward
- Confirmation that the market has shifted bearish
2️⃣ Stop Loss Placement
Place SL:
- Above Peak 2
- Or above Peak 1 (more conservative)
🛑 SL must sit outside the structure to avoid fake moves.
3️⃣ Take Profit Target
The classic measurement:
- Distance from Peak → Neckline
- Projected downward
This gives the first TP.
TP2 can be placed at:
Next support zone
- Fib 1.618 extension
- HTF demand area
🔶 5. Real Market Example
Your image shows:
- Two clear peaks forming under a resistance zone
- Neckline support holding price
- A strong break below the neckline
- Sell entries at the ideal points:
+ Point 1 → aggressive breakout trader
+ Point 2 → safest retest entry
+ Point 3 → early anticipation entry (riskier)
The downward projection after the pattern aligns perfectly with the expected target zone.
🔶 6. Trader Psychology: Why People Lose with Double Tops
Most traders get trapped because they:
❌ Sell too early (before neckline break)
❌ Expect the second top to drop immediately
❌ Ignore volume or candle strength
❌ Enter without waiting for retest
❌ Fear missing out and chase price after the big drop
Smart Money uses these emotions:
- Greed → traps buyers at Peak 2
- Fear → forces panic selling at neckline break
- FOMO → attracts late sellers at the worst price
Your job is to stay patient and enter only at the retest, where probability is highest.
🔶 7. Professional Tips to Master the Double Top
✔️ Wait for structure confirmation → neckline break
✔️ Don’t sell inside the range between the two peaks
✔️ Use RSI divergence to strengthen accuracy
✔️ Look for stop-hunt wicks above Peak 2
✔️ Combine with trendline breaks for timing
✔️ Use a top-down approach (H4 + H1 → M15 entry)
✨ Final Message for Traders
The Double Top is not just a pattern it is a reflection of fear, greed, and trapped liquidity.
Master the psychology behind it, and it becomes one of your most reliable reversal tools.
If this helped your trading, drop a comment and share your thoughts!
Let’s grow together. ❤️📈
The illusion of opportunity: quietly killing your capital."🎯 Professional Training on the "Illusion of Opportunity" in Trading
Illusion of Opportunity in Financial Markets
One of the most dangerous mental traps for traders is the illusion of opportunity.
What is the illusion of opportunity?
It is:
"A trader’s mental assumption that if they don’t enter the market right now, they will miss a big, once-in-a-lifetime opportunity… even when there is no logical reason to enter."
This cognitive bias causes traders to act without analysis, without a plan, driven by excitement or fear of missing out.
🧠 Why does the illusion of opportunity happen?
1️⃣ Fear of missing out (FOMO)
When prices move fast, the mind warns:
"If you don’t jump in now, it will be too late!"
While in reality, the market always provides opportunities.
2️⃣ The mind loves sudden moves
A static chart is ignored;
when a large candle forms → the mind perceives it as an "opportunity."
3️⃣ Comparison with others
Seeing others’ profits, stories, posts of big gains, and rapid price action makes us feel behind.
4️⃣ False belief: the market gives only one chance
In reality:
🔸 Opportunities repeat
🔸 The market structure creates opportunities candle by candle
🔸 There’s always the next chance to make money
💣 Consequences of the illusion of opportunity
• Rash entries
• Illogical stop-loss placement
• Entering at market tops
• Emotional exits
• Consecutive losses
• Anger and frustration
• Revenge trading
A trader often thinks:
❌ "If I don’t enter now, it will be too late."
❌ "It’s already moving; it will continue."
❌ "This is the best opportunity."
Then they enter… and the price reverses 🤦♂️
🎯 How to recognize this illusion? (real warning signs)
If you notice these while entering, it’s a clear danger sign:
✔️ Don’t know where the stop-loss is
✔️ Don’t know the target
✔️ Reason for entry is only a momentary price move
✔️ Trading from your phone or on the go
✔️ Not aware of the overall trend
✔️ Feeling rushed
✔️ Making quick decisions
These are all signs of emotional entry.
💡 Practical solutions from trading psychology
✅ The 60-Second Rule
Before entering, pause for 60 seconds and ask:
📌 Why here?
📌 If I don’t enter now, what is the real risk?
In 90% of cases, this eliminates unnecessary entries.
✅ The Entry Checklist Rule
Enter only when all the following are confirmed:
☑️ Clear market direction
☑️ Confirmed entry zone
☑️ Low-risk position
☑️ Clear setup/pattern/signal
☑️ Logical stop-loss
☑️ Minimum risk/reward = 1:2
If any one condition is missing → no entry.
✅ The “Next Opportunity Always Comes” Rule
The market has existed for 100 years and will exist for another 100.
One move is never everything.
📍 Final Conclusion
The illusion of opportunity occurs when the mind sees past price movement as a future opportunity.
Rash entries lead to losses, regret, and revenge trading.
A real opportunity has three factors:
🎯 Defined entry zone
🎯 Measurable stop-loss
🎯 Logical target
Golden Tip:
"Opportunities are created through analysis, not sudden market moves

HOW TO WATCHLIST ADVANCED VIEW PART-1 IN TRADINGVIEWHOW TO WATCHLIST ADVANCED VIEW PART-1 IN TRADINGVIEW
**AND WHAT FEATURES IT PROVIDES**
✅ HOW TO OPEN ADVANCED VIEW IN TRADINGVIEW
Follow these steps:
1️⃣ Open the Watchlist Panel
➣ On the right side of the Trading-View interface, find the Watchlist panel.
➣ If it is hidden, click the small arrow on the right edge to reveal it.
2️⃣ Find the Layout Icons at the Bottom
➣ At the bottom of the watchlist, you will see multiple icons such as:
➣ List View
➣ Table View
➣ Advanced View (usually an expanded grid-style icon)
3️⃣ Click on “Advanced View”
➣ Click the Advanced View icon.
➣ Your watchlist will switch from the simple list to a more detailed, data-rich layout.
➣ That’s it — Advanced View is now active.
✅ FEATURES OF ADVANCED VIEW IN TRADINGVIEW
The Advanced View provides more detailed market information without needing to open charts.
Here are the key features:
1️⃣ Multiple Data Columns
➣ You can view several data points directly in the watchlist, such as:
➣ Last Price
➣ Price Change
➣ Change %
➣ Volume
➣ High / Low
➣ Bid / Ask
➣ Time / Session Data
➣ Fundamentals (if applicable)
This gives a snapshot of key market info in one place.
2️⃣ Add / Remove Columns
You can customize your watchlist:
➣ Click Add Column (+) to insert new data fields
➣ Click the three-dot menu (⋮) → Remove to delete any column
3️⃣ Reorder Columns
➣ Drag and drop column headers
➣ Arrange symbols in the order that works best for you
4️⃣ Sorting by Any Data
Click any column header to sort:
➣ One click → ascending
➣ Second click → descending
Useful for sorting:
➣ Highest volume
➣ Biggest % movers
➣ Highest price
➣ Top gainers / losers
5️⃣ Expandable Rows
(Some advanced layouts allow expanded detail per symbol.)
This helps you see:
➣ Additional stats
➣ Extended session data
➣ More fundamentals
6️⃣ Cleaner Multi-Symbol Comparison
Advanced View is ideal when watching:
➣ Indices
➣ Futures
➣ Forex pairs
➣ Commodities
➣ Multiple stocks at once
It becomes easier to compare signals and market movements.
7️⃣ Switch Back Anytime
To return to normal view:
➣ Click the List View icon at the bottom
➣ Watchlist returns to default layout
🎯 Summary
➣ Advanced View gives you a more powerful, professional watchlist layout
➣ Perfect for comparing multiple symbols quickly
➣ Provides more data in a structured table-style format
➣ Fully customizable with columns, sorting & layout tools

BTC/USD – Band Rejection + Gap Squeeze Play (Textbook Execution)Caught a clean 30m bullish band rejection on BTC/USD, aligned with a textbook gap-up squeeze setup. Price gapped above the lower Bollinger Band after a clear downtrend, forming a strong engulfing candle. Entry triggered on break of the rejection candle high at 89,276.
Trade Highlights:
- Entry: 89,276 (2 lots)
- Target 1: Midline (9 EMA) hit at 89,372 (+0.11%)
- Target 2: Upper Band hit at 89,672 (+0.44%)
- Stop: 89,044 (below rejection low)
- Result: Full 1:1 RR achieved on both lots
Setup Confluence:
- Lower band rejection with hammer
- Gap-up ≥ 1% with strong close
- X/Y band stretch> 1.6 confirms squeeze
- No opposite rejection before midline
Takeaway: A+ setup with high-probability structure and mechanical execution. Kill fast, ride smart.

HOW TO WATCHLIST ADVANCED VIEW IN TRADINGVIEWHOW TO OPEN ADVANCED VIEW IN TRADINGVIEW
**AND WHAT FEATURES IT PROVIDES**
✅ HOW TO OPEN ADVANCED VIEW IN TRADINGVIEW
Follow these steps:
1️⃣ Open the Watchlist Panel
➣ On the right side of the Trading-View interface, find the Watchlist panel.
➣ If it is hidden, click the small arrow on the right edge to reveal it.
2️⃣ Find the Layout Icons at the Bottom
➣ At the bottom of the watchlist, you will see multiple icons such as:
➣ List View
➣ Table View
➣ Advanced View (usually an expanded grid-style icon)
3️⃣ Click on “Advanced View”
➣ Click the Advanced View icon.
➣ Your watchlist will switch from the simple list to a more detailed, data-rich layout.
➣ That’s it — Advanced View is now active.
✅ FEATURES OF ADVANCED VIEW IN TRADINGVIEW
The Advanced View provides more detailed market information without needing to open charts.
Here are the key features:
1️⃣ Multiple Data Columns
➣ You can view several data points directly in the watchlist, such as:
➣ Last Price
➣ Price Change
➣ Change %
➣ Volume
➣ High / Low
➣ Bid / Ask
➣ Time / Session Data
➣ Fundamentals (if applicable)
This gives a snapshot of key market info in one place.
2️⃣ Add / Remove Columns
You can customize your watchlist:
➣ Click Add Column (+) to insert new data fields
➣ Click the three-dot menu (⋮) → Remove to delete any column
3️⃣ Reorder Columns
➣ Drag and drop column headers
➣ Arrange symbols in the order that works best for you
4️⃣ Sorting by Any Data
Click any column header to sort:
➣ One click → ascending
➣ Second click → descending
Useful for sorting:
➣ Highest volume
➣ Biggest % movers
➣ Highest price
➣ Top gainers / losers
5️⃣ Expandable Rows
(Some advanced layouts allow expanded detail per symbol.)
This helps you see:
➣ Additional stats
➣ Extended session data
➣ More fundamentals
6️⃣ Cleaner Multi-Symbol Comparison
Advanced View is ideal when watching:
➣ Indices
➣ Futures
➣ Forex pairs
➣ Commodities
➣ Multiple stocks at once
It becomes easier to compare signals and market movements.
7️⃣ Switch Back Anytime
To return to normal view:
➣ Click the List View icon at the bottom
➣ Watchlist returns to default layout
🎯 Summary
➣ Advanced View gives you a more powerful, professional watchlist layout
➣ Perfect for comparing multiple symbols quickly
➣ Provides more data in a structured table-style format
➣ Fully customizable with columns, sorting & layout tools

The Role of WTO, IMF, and World Bank in the Global Trade Market1. World Trade Organization (WTO)
The WTO is the central global institution responsible for regulating international trade. Established in 1995, it succeeded the General Agreement on Tariffs and Trade (GATT) and currently has 164 member countries. Its primary objective is to ensure that trade flows as smoothly, predictably, and freely as possible.
a. Promoting Trade Liberalization:
The WTO facilitates trade by reducing barriers such as tariffs, quotas, and subsidies that hinder international commerce. Through multilateral negotiations, the organization encourages countries to open their markets and adopt fair trade practices. By providing a platform for dialogue, the WTO helps resolve disputes over trade policies, preventing protectionist measures that could disrupt global commerce.
b. Trade Rules and Agreements:
WTO members agree to a set of binding rules that govern trade in goods, services, and intellectual property. Key agreements include the General Agreement on Tariffs and Trade (GATT), the General Agreement on Trade in Services (GATS), and the Agreement on Trade-Related Aspects of Intellectual Property Rights (TRIPS). These rules create a predictable trade environment, reducing uncertainty for businesses engaged in international trade.
c. Dispute Resolution Mechanism:
One of the WTO’s most significant roles is its dispute settlement system. When countries believe their trade rights are violated, the WTO provides a legal framework for resolving conflicts. This mechanism prevents trade wars and encourages compliance with agreed trade norms.
d. Capacity Building and Technical Assistance:
The WTO supports developing and least-developed countries (LDCs) by offering training and technical assistance to enhance their ability to participate in the global trade system. This fosters inclusivity and helps emerging economies integrate more effectively into international markets.
Impact on Global Trade:
By promoting open and rules-based trade, the WTO reduces transaction costs, fosters competition, and stimulates innovation. Countries that comply with WTO agreements gain access to broader markets, which boosts exports, employment, and economic growth. For example, WTO agreements have played a pivotal role in facilitating the globalization of supply chains, which are essential for sectors like electronics, automobiles, and agriculture.
2. International Monetary Fund (IMF)
The IMF, established in 1944, is primarily a financial institution designed to ensure global monetary stability. While its core mandate is not trade per se, its role is critical in maintaining conditions conducive to international trade.
a. Financial Stability and Crisis Prevention:
The IMF monitors the global economy and provides early warning signals about financial imbalances that could disrupt trade. Countries experiencing balance-of-payments crises—when imports exceed exports and foreign reserves dwindle—can seek assistance from the IMF. By offering short-term financial support, the IMF stabilizes exchange rates, ensuring that trade transactions are not adversely affected by currency volatility.
b. Policy Advice and Economic Surveillance:
The IMF conducts regular assessments of member countries’ macroeconomic policies through its “Article IV consultations.” It advises governments on fiscal, monetary, and exchange rate policies to promote sustainable growth. Sound economic policies foster investor confidence, which is crucial for trade and capital flows.
c. Lending Programs:
IMF lending programs, such as Stand-By Arrangements and the Extended Fund Facility, help countries manage economic shocks. For instance, during the 1997 Asian Financial Crisis, IMF interventions provided liquidity and policy guidance, helping affected countries restore trade and investment flows. Similarly, during the COVID-19 pandemic, the IMF offered emergency financing to stabilize economies and prevent global trade collapse.
d. Technical Assistance and Capacity Development:
The IMF provides training in public finance, monetary management, and financial regulation. These initiatives help member countries maintain stable macroeconomic environments, which are essential for smooth trade operations.
Impact on Global Trade:
By ensuring macroeconomic stability, the IMF indirectly supports global trade. Stable currencies and balanced budgets reduce transaction risks and encourage cross-border investment. Countries that manage economic volatility effectively are more attractive trade partners, thereby strengthening the global trade network.
3. World Bank
The World Bank, formed alongside the IMF in 1944, focuses on long-term economic development and poverty reduction. Its activities complement the trade-facilitating functions of the WTO and the stability-focused interventions of the IMF.
a. Infrastructure Development:
One of the World Bank’s key roles in trade promotion is financing infrastructure projects, such as ports, roads, railways, and logistics hubs. Efficient infrastructure reduces transportation costs, shortens delivery times, and enhances trade competitiveness. For example, improved port facilities in countries like Vietnam and Kenya have significantly boosted export-oriented industries.
b. Development Projects and Industrial Policy Support:
The World Bank provides technical and financial assistance to promote industrialization, agricultural productivity, and trade-related sectors. By enhancing the production capacity of developing nations, it helps them integrate into global supply chains. Programs targeting small and medium-sized enterprises (SMEs) and export-oriented industries have facilitated greater participation in international trade.
c. Poverty Alleviation and Inclusive Growth:
The World Bank’s initiatives in education, health, and social protection indirectly affect trade. A skilled, healthy workforce increases productivity, enabling countries to produce goods efficiently and compete in international markets. Inclusive growth ensures that the benefits of trade are widely shared, reducing social tensions that could disrupt trade relations.
d. Policy and Regulatory Support:
The World Bank advises governments on trade policies, regulatory frameworks, and investment climate reforms. Simplified customs procedures, better trade facilitation, and improved investment regulations help reduce barriers to cross-border commerce.
Impact on Global Trade:
By enhancing infrastructure, productivity, and institutional capacity, the World Bank creates an environment conducive to trade. Countries supported by the World Bank can export more competitively, attract foreign investment, and engage more effectively in global markets.
Interconnected Roles in Global Trade
While each institution has a specific mandate, their functions often intersect in shaping global trade:
The WTO establishes the rules and ensures fair trading practices.
The IMF ensures that economic and financial systems remain stable so countries can trade without disruption.
The World Bank strengthens the structural and institutional capacity of countries to produce and trade goods efficiently.
For example, a developing country may receive World Bank funding to upgrade port infrastructure, IMF advice to stabilize its currency, and WTO support to access global markets under favorable trade agreements. Together, these institutions create a framework where trade can flourish sustainably.
Challenges and Criticisms
Despite their significant contributions, these institutions face challenges. The WTO has struggled with stalled negotiations and criticism from countries feeling disadvantaged by liberalization. The IMF is sometimes criticized for imposing austerity measures that can hurt social welfare. The World Bank faces scrutiny for environmental and social impacts of large projects. Nonetheless, their roles in promoting trade, stability, and development remain indispensable.
Conclusion
The WTO, IMF, and World Bank are pillars of the global trade system. By facilitating trade liberalization, ensuring financial stability, and supporting development, these institutions create an ecosystem where international commerce can thrive. While their mandates differ, their collective impact strengthens economic growth, reduces poverty, and fosters international cooperation. In an increasingly interconnected world, the effectiveness of these organizations is central to sustaining the momentum of global trade, enhancing prosperity, and building resilient economies.

How Trade Shapes Global Currency1. The Basic Mechanism: Supply and Demand in Currency Markets
At its core, currency value is influenced by supply and demand. International trade directly affects this supply-demand dynamic. When a country exports goods and services, foreign buyers need to purchase its currency to pay for these exports. For instance, if the United States exports machinery to Germany, German importers must buy U.S. dollars (USD) to complete the transaction. This demand for USD increases its value relative to the euro (EUR). Conversely, when a country imports goods and services, it needs foreign currency to pay overseas suppliers, which can increase the supply of its own currency in the global market, potentially causing depreciation.
Trade, therefore, is a continuous flow of currency exchange. Countries with strong export-oriented economies often see their currencies strengthen, whereas nations with large import bills may experience downward pressure on their currency unless offset by foreign investment or other capital inflows.
2. Trade Balances: Surplus and Deficit
A critical concept in understanding currency dynamics is the trade balance — the difference between a country’s exports and imports. A trade surplus occurs when exports exceed imports, meaning foreign buyers are consistently demanding more of the country’s currency. This sustained demand strengthens the domestic currency. For example, China has historically maintained trade surpluses, contributing to the upward pressure on the yuan.
Conversely, a trade deficit happens when a country imports more than it exports. This scenario increases the domestic currency supply in the foreign exchange market, potentially weakening it. The United States, which often runs trade deficits, relies on capital inflows and investment from abroad to offset this pressure. Persistent trade deficits can lead to concerns about a currency’s long-term value, influencing both foreign exchange markets and domestic economic policy.
3. Currency and Competitiveness
Trade also affects currencies through competitiveness. A weaker currency makes a country’s exports cheaper and more attractive to foreign buyers, stimulating export growth. Conversely, a stronger currency can make imports cheaper, benefiting consumers but potentially harming domestic exporters. Central banks sometimes intervene in currency markets to maintain trade competitiveness. For instance, Japan has historically intervened to prevent excessive appreciation of the yen, which could harm its export-driven economy.
4. Capital Flows and Trade-Related Investment
Trade flows often create parallel capital flows. Companies engaged in international trade may invest in foreign markets to streamline supply chains, leading to cross-border investments. These capital movements can reinforce currency trends created by trade. For example, if a European company invests heavily in the United States, it must convert euros into dollars, creating additional demand for USD and supporting its value. Therefore, trade indirectly stimulates currency movement through associated foreign direct investment (FDI) and portfolio flows.
5. Global Reserve Currencies
Trade patterns also shape the global status of currencies. The U.S. dollar, euro, and Japanese yen are widely used as reserve currencies, largely due to historical trade dominance and economic stability. Countries conducting significant trade in dollars tend to hold large USD reserves to facilitate international payments. This demand for reserve currencies reinforces their global value and liquidity. The dominance of reserve currencies can influence global trade, as nations often price commodities like oil and metals in major currencies, creating a feedback loop between trade and currency value.
6. Trade Policies and Currency Volatility
Trade policies such as tariffs, quotas, and trade agreements can directly impact currency values. Protectionist measures, like high tariffs on imports, can reduce trade volumes, affecting currency demand. For example, if the U.S. imposes tariffs on Chinese goods, demand for Chinese yuan may decline because fewer U.S. businesses need it to pay for imports. Similarly, trade agreements that boost cross-border commerce can enhance currency stability by creating predictable demand patterns. Investors monitor trade negotiations closely because even rumors can trigger significant currency volatility.
7. Exchange Rates and Global Competitiveness
Currencies are also shaped by the relative strength of trading partners. A country’s trade performance depends not just on domestic policies but also on the economic health and currency strength of its partners. For instance, a slowdown in the European economy can reduce demand for Asian exports, weakening the currencies of export-dependent Asian nations. Moreover, countries sometimes engage in competitive devaluation, deliberately weakening their currency to boost export competitiveness, which can trigger a cycle of trade-related currency adjustments globally.
8. The Role of Speculation
Finally, trade expectations drive currency speculation. Traders in the foreign exchange market closely monitor trade data, such as import/export volumes, trade deficits, and agreements, to anticipate currency movements. If a nation reports a record trade surplus, traders may buy its currency in anticipation of appreciation. Conversely, unexpected trade deficits or disruptions can trigger rapid selling, causing currency depreciation. Speculation based on trade data can amplify currency swings beyond what actual trade flows would dictate, illustrating the psychological dimension of trade-driven currency movements.
9. Long-Term Implications
Over the long term, sustained trade patterns shape economic strategy and currency policy. Export-oriented economies often maintain strong currencies, invest in industrial capacity, and manage reserves to stabilize exchange rates. Import-reliant nations may adopt measures to attract foreign investment to support their currency. Global trade imbalances can also lead to currency realignments, with under- or overvalued currencies influencing global competitiveness and economic growth. For instance, the rise of China as a global exporter has significantly influenced the valuation of the yuan, affecting trade flows worldwide.
Conclusion
In essence, trade shapes global currencies through a complex interplay of supply-demand dynamics, trade balances, competitiveness, capital flows, policy decisions, and market expectations. Exports drive demand for a country’s currency, imports increase its supply, and trade policies and agreements can amplify or moderate these effects. The interconnected nature of the global economy means that a change in trade patterns in one region can reverberate across multiple currencies. As global trade continues to evolve, currencies will remain both indicators and drivers of economic performance, reflecting the intricate relationship between commerce and financial markets. Understanding this relationship is crucial for governments, businesses, and investors seeking to navigate the ever-changing landscape of global trade and currency markets.

The Crucial Role of Global Trade1. Economic Growth and Development
The most immediate and apparent role of global trade is its contribution to economic growth. Trade enables countries to specialize in producing goods and services in which they have a comparative advantage—a concept introduced by economist David Ricardo. Comparative advantage means that countries can produce certain products more efficiently than others. For instance, a country with abundant fertile land may focus on agriculture, while a technologically advanced nation may concentrate on electronics or software development. By exchanging these goods and services, countries can maximize efficiency and output, leading to higher GDPs and improved living standards.
Global trade also promotes industrial diversification. By participating in international markets, nations are incentivized to develop new industries, upgrade technology, and improve infrastructure. Emerging economies, such as China and India, have leveraged trade to transform their economic landscapes, moving from agrarian-based systems to industrial and service-driven economies within decades. Furthermore, trade contributes to employment generation by creating new jobs in export-oriented sectors and associated industries like logistics, finance, and technology.
2. Access to Goods and Services
Global trade allows countries to access products that may be unavailable or too expensive domestically. This enhances consumer choice and ensures that people benefit from goods that would otherwise be out of reach. For example, tropical fruits like bananas or coffee can be enjoyed in regions with cold climates because of trade. Similarly, high-tech gadgets, pharmaceuticals, and machinery are often imported from countries with advanced technological capabilities.
By facilitating access to a broader range of goods and services, global trade also promotes competition. Domestic producers must innovate and improve quality to remain competitive against international competitors, ultimately benefiting consumers through better products and lower prices.
3. Technological Advancement and Innovation
Trade is not only about goods and services; it also facilitates the transfer of knowledge and technology. When countries engage in international trade, they often adopt new production techniques, management practices, and innovations from their trading partners. This exchange fosters technological diffusion, which can accelerate industrialization and modernization.
Multinational corporations (MNCs) play a pivotal role in this process. Through foreign direct investment (FDI), MNCs bring in advanced technology, management expertise, and capital, stimulating local economies and raising productivity. For instance, the entry of foreign automotive companies into emerging markets has often led to the adoption of cutting-edge manufacturing techniques, quality standards, and research and development capabilities in those regions.
4. Enhancing International Relations
Global trade serves as a bridge between nations, fostering interdependence and cooperation. Countries that trade extensively are less likely to engage in conflict because their economies are mutually connected. This concept, often referred to as the "commercial peace theory," suggests that trade creates incentives for diplomatic resolution of disputes rather than resorting to military action.
Trade agreements and regional blocs, such as the European Union (EU), the North American Free Trade Agreement (NAFTA), now replaced by the United States-Mexico-Canada Agreement (USMCA), and the Association of Southeast Asian Nations (ASEAN), exemplify how economic interdependence can strengthen political and strategic relationships. These agreements provide frameworks for conflict resolution, promote political dialogue, and encourage harmonization of regulations and standards.
5. Global Supply Chains and Economic Resilience
In the modern global economy, trade underpins complex supply chains that span multiple continents. These supply chains allow producers to source raw materials from one country, manufacture components in another, and assemble final products elsewhere. Such interconnections increase efficiency, reduce costs, and enable countries to respond flexibly to demand fluctuations.
However, global trade also exposes economies to vulnerabilities, as seen during the COVID-19 pandemic when disruptions in supply chains caused shortages of essential goods worldwide. Despite these challenges, trade networks remain crucial for resilience, as they allow countries to diversify suppliers, maintain reserves, and adapt to changing conditions.
6. Reduction of Poverty and Inequality
Global trade has a significant role in poverty reduction, particularly in developing countries. Export-oriented growth strategies can create jobs, increase wages, and raise living standards. For instance, the export-led manufacturing boom in East Asia lifted millions of people out of poverty over the past few decades. By participating in global markets, developing nations can generate revenue to invest in education, healthcare, and infrastructure, creating a virtuous cycle of growth and development.
Moreover, trade can help reduce income inequality between nations by offering poorer countries opportunities to integrate into the global economy. While domestic inequality may persist, global trade can level the playing field by enabling developing countries to compete internationally and improve their citizens’ economic prospects.
7. Cultural Exchange and Global Understanding
Beyond economics, global trade promotes cultural exchange. The movement of goods, services, and people leads to the diffusion of ideas, lifestyles, and traditions. Products such as fashion, cuisine, music, and art often cross borders alongside commerce, fostering cultural appreciation and understanding. In a world facing global challenges such as climate change and pandemics, mutual understanding and cooperation are essential, and trade acts as a conduit for building these bridges.
8. Challenges and Considerations
While global trade offers immense benefits, it is not without challenges. Trade imbalances, protectionism, unfair competition, and exploitation of labor are pressing concerns. Additionally, overreliance on global markets can expose economies to external shocks, such as financial crises, political instability, or natural disasters in trading partner countries. Sustainable and fair trade practices, along with robust regulatory frameworks, are essential to ensure that trade remains a force for inclusive and long-term development.
Conclusion
Global trade is a fundamental driver of economic prosperity, technological advancement, cultural exchange, and international cooperation. It enables countries to specialize, innovate, and access a wider variety of goods and services. It promotes peace, enhances resilience through interconnected supply chains, and has the potential to reduce poverty and inequality worldwide. However, the benefits of trade must be balanced with policies that mitigate risks, ensure fairness, and promote sustainable development.
In the contemporary era, where globalization defines economic and social landscapes, the crucial role of global trade cannot be overstated. It remains not just an economic mechanism but a vital force shaping the trajectory of human progress, international relations, and global well-being.

Investing Worldwide: A Comprehensive Guide1. Why Invest Globally?
Global investing provides several advantages:
Diversification: Investing across different countries reduces the impact of localized economic downturns. For instance, if the U.S. market declines due to domestic issues, gains in Asian or European markets can offset losses.
Growth Opportunities: Emerging markets often exhibit higher economic growth rates than developed markets, providing potential for significant capital appreciation. Countries such as India, China, and Brazil have rapidly growing middle classes and expanding consumer markets, offering unique investment opportunities.
Currency Exposure: Investing internationally introduces currency diversification. A strengthening foreign currency against the investor’s home currency can amplify returns, although it can also magnify losses.
Access to Global Innovation: Many groundbreaking technologies, sustainable energy solutions, and healthcare advancements originate outside domestic markets. By investing globally, investors can participate in these high-growth sectors.
2. Types of Global Investments
Global investing can take various forms, each with distinct risk-return profiles:
Equities (Stocks):
Direct investment in foreign companies via local exchanges or American Depositary Receipts (ADRs).
Stocks offer growth potential but are susceptible to market volatility, political instability, and currency fluctuations.
Bonds:
Government and corporate bonds from different countries offer fixed income. Developed markets provide safety, while emerging markets often offer higher yields with increased risk.
Currency risk and interest rate differences are important considerations.
Mutual Funds and Exchange-Traded Funds (ETFs):
These pooled investment vehicles provide diversified exposure to international equities and bonds.
Specialized funds can target specific regions, sectors, or themes, such as technology in Asia or renewable energy in Europe.
Real Estate:
International property investments include commercial and residential real estate or Real Estate Investment Trusts (REITs).
Real estate offers income through rent and potential appreciation, but it requires awareness of local regulations and market dynamics.
Commodities and Natural Resources:
Investing in oil, gold, or agricultural commodities allows participation in global supply-demand trends.
Commodities are influenced by geopolitical events, weather conditions, and currency movements.
Alternative Investments:
Private equity, hedge funds, and venture capital provide access to high-risk, high-reward opportunities worldwide.
These typically require larger capital and a higher risk tolerance.
3. Key Factors Influencing Global Investing
Investing internationally requires analyzing factors that impact financial performance beyond domestic borders:
Economic Indicators: GDP growth, inflation, employment rates, and consumer spending patterns indicate a country’s economic health.
Political Stability and Governance: Elections, regulations, trade policies, and geopolitical tensions can significantly affect market confidence and investment returns.
Monetary Policy: Central bank policies on interest rates and liquidity influence investment decisions, particularly for bonds and currency-sensitive assets.
Currency Fluctuations: Currency appreciation or depreciation can enhance or reduce returns. Hedging strategies are often employed to mitigate currency risk.
Market Liquidity and Accessibility: Some markets, especially in emerging economies, may have lower liquidity or restrictions on foreign ownership, affecting entry and exit strategies.
Cultural and Social Factors: Consumer behavior, labor practices, and technological adoption can influence the success of sector-specific investments.
4. Investment Strategies for a Global Portfolio
A global portfolio requires careful allocation and strategic planning:
Geographical Diversification:
Spread investments across developed, emerging, and frontier markets to balance risk and opportunity.
For example, an investor may allocate 50% to developed markets (USA, UK, Japan), 30% to emerging markets (India, China, Brazil), and 20% to frontier markets (Vietnam, Nigeria).
Sector Diversification:
Allocate across industries such as technology, healthcare, energy, and consumer goods to mitigate sector-specific risks.
Currency Hedging:
Use financial instruments like forwards, options, or ETFs to protect against adverse currency movements.
Active vs. Passive Management:
Active management involves selecting individual securities and timing market entry/exit, aiming for superior returns.
Passive strategies, like investing in global index funds, provide broad market exposure with lower costs.
Thematic and ESG Investing:
Investors can focus on global themes such as clean energy, artificial intelligence, or sustainable development.
ESG (Environmental, Social, and Governance) investing is growing worldwide, attracting capital towards responsible companies.
5. Risks Associated with Global Investing
While global investing offers diversification and growth potential, it also introduces unique risks:
Market Volatility: International markets may experience higher volatility due to political events, economic crises, or natural disasters.
Currency Risk: Investments denominated in foreign currencies can fluctuate in value when converted to the investor’s home currency.
Regulatory Risk: Differences in taxation, securities regulations, and legal systems can impact returns and exit strategies.
Liquidity Risk: Some international markets may have limited liquidity, making it challenging to buy or sell assets quickly.
Geopolitical Risk: Trade wars, conflicts, sanctions, and terrorism can affect investment performance.
6. Global Investment Trends
Emerging Market Growth: Asia, Africa, and Latin America continue to attract capital due to high growth potential.
Technology and Innovation: Investments in AI, biotechnology, fintech, and electric vehicles are reshaping global markets.
Sustainable Investing: ESG and impact investing are becoming mainstream, reflecting investor preference for socially responsible strategies.
Digital Assets and Fintech: Cryptocurrencies, blockchain, and online trading platforms have increased access to global investments.
7. Practical Steps for Global Investors
Assess Risk Tolerance: Determine how much exposure to foreign markets aligns with your financial goals and risk appetite.
Research Markets: Analyze economic indicators, political stability, and sector potential.
Diversify: Avoid over-concentration in a single country or asset class.
Consider Costs: Factor in transaction fees, taxes, and currency conversion costs.
Use Professional Help: Global investing can be complex; financial advisors, international brokers, or global fund managers can provide valuable guidance.
Monitor Regularly: Global markets evolve rapidly; continuous monitoring and rebalancing are essential to optimize returns.
Conclusion
Investing worldwide offers immense opportunities for growth, diversification, and participation in global innovation. While the potential rewards are significant, investors must navigate risks associated with currency fluctuations, political instability, regulatory differences, and market volatility. By adopting a well-researched, diversified, and disciplined approach, global investors can enhance portfolio resilience, capture emerging opportunities, and achieve long-term financial goals. As globalization continues to deepen economic interconnections, international investing is no longer a niche strategy—it is increasingly essential for those seeking to maximize returns while managing risk in a complex, interconnected world.

The Impact of Multinational Corporations (MNCs) on Trading1. Driving International Trade Growth
MNCs are major engines of global trade. By establishing operations in multiple countries, they create a demand for goods, services, and capital across borders. Their activities often lead to the creation of intricate global supply chains where raw materials, intermediate goods, and finished products move seamlessly between countries. For example, an automobile company headquartered in Germany may source parts from Japan, assemble vehicles in Mexico, and sell them in the United States. This not only increases the volume of trade but also diversifies trade patterns, creating new economic linkages between nations.
MNCs often promote exports from developing countries by investing in local manufacturing plants. This stimulates local economies, generates employment, and enables these countries to integrate into global markets. Countries like China, Vietnam, and India have benefited significantly from MNC-led trade, seeing their export sectors expand dramatically due to foreign direct investment (FDI) from multinationals.
2. Influence on Market Structure and Competition
MNCs can reshape trading markets by altering competitive dynamics. Their size, access to advanced technology, and global networks give them a competitive advantage over domestic firms. This can create efficiencies in production, logistics, and distribution, often resulting in lower costs for consumers. For instance, multinational retail corporations like Walmart or Amazon leverage economies of scale to offer goods at prices that domestic competitors may struggle to match.
However, MNC dominance can also lead to market concentration, where a few large players control significant shares of certain markets. This has implications for trade policies, as governments may feel pressured to create favorable conditions for MNCs to attract investment, sometimes at the expense of local businesses. Thus, while MNCs enhance efficiency and expand trade, they can also introduce competitive challenges for smaller domestic firms.
3. Shaping Global Supply Chains
The operations of MNCs often dictate global supply chain structures, which have a direct impact on trading patterns. Companies like Apple, Samsung, and Toyota rely on a network of suppliers and manufacturers spread across continents. These supply chains facilitate the cross-border movement of intermediate goods, raw materials, and components, which in turn drives international trade.
Moreover, MNCs play a critical role in setting global standards for quality, production, and logistics. By enforcing uniform standards across their global operations, they encourage trading partners to adopt similar practices, thereby enhancing trade efficiency and reliability. However, dependence on MNC-driven supply chains can also create vulnerabilities. For example, disruptions in one region—like a natural disaster or geopolitical tension—can impact global trade flows significantly, as seen during the COVID-19 pandemic when supply chains were severely affected.
4. Technological Transfer and Innovation in Trade
MNCs are often at the forefront of technological innovation. Through their international operations, they transfer knowledge, skills, and technologies to host countries, impacting trading patterns. For instance, a multinational in the electronics sector may establish a research and development (R&D) center in a developing country, equipping local talent with advanced technological know-how. This technology transfer often enhances local production capabilities, enabling these countries to produce goods for export that meet international standards.
Additionally, MNCs introduce advanced management practices, logistics solutions, and production techniques, which improve efficiency and productivity in trade operations. Over time, these innovations contribute to the growth of trade volumes and the development of competitive export sectors in host countries.
5. Impact on Foreign Exchange and Financial Markets
MNCs’ global operations have a significant influence on currency markets and international finance. Their cross-border transactions in goods, services, and capital flows impact foreign exchange demand and supply. For instance, a U.S.-based multinational importing raw materials from India would need to convert dollars into Indian rupees, thereby affecting currency exchange rates. Large-scale operations of MNCs can thus introduce volatility into foreign exchange markets, influencing trade competitiveness and pricing.
Furthermore, MNCs often participate in international capital markets through foreign direct investment (FDI), portfolio investment, or borrowing in foreign currencies. These activities facilitate global financial integration and enhance liquidity in international trade financing. Their investments can also affect trade balances by increasing exports from host countries or boosting imports to supply their global production networks.
6. Influence on Trade Policies and Agreements
Governments often design trade policies to attract or regulate MNC activity. Many countries offer tax incentives, reduced tariffs, and favorable regulatory environments to encourage MNC investments. Consequently, MNCs influence trade policies and international trade agreements. For example, the presence of MNCs in a country may motivate it to negotiate bilateral or multilateral trade agreements that facilitate smoother export and import flows.
Additionally, MNC lobbying can impact international trade rules, including labor standards, environmental regulations, and intellectual property protections. By shaping the regulatory environment, MNCs indirectly affect the flow of goods and services across borders, promoting trade liberalization in some cases while creating barriers in others.
7. Risks and Challenges Introduced by MNCs
While MNCs boost global trade, they also introduce challenges. Overreliance on multinational corporations can make countries vulnerable to global economic shocks, such as sudden shifts in investment flows or supply chain disruptions. The dominance of MNCs in certain sectors can stifle domestic entrepreneurship, reducing the diversity of trade sources. Additionally, ethical concerns related to labor practices, environmental sustainability, and profit repatriation can complicate trade relations.
Global trade is also affected by political tensions involving MNCs. For instance, disputes between home and host countries over taxation, tariffs, or sanctions can disrupt trade flows, highlighting the complex interplay between multinational operations and international commerce.
8. MNCs and the Future of Global Trade
Looking ahead, MNCs will continue to be central to trading patterns. Emerging technologies like artificial intelligence, blockchain, and automation will enable more efficient global logistics and trade tracking. MNCs will likely invest in sustainable and green supply chains, aligning with international environmental standards, which will influence the type of goods traded and the countries involved.
Moreover, geopolitical shifts, trade wars, and regional economic blocs will affect how MNCs structure their operations, creating new trade corridors while potentially reducing reliance on certain markets. Their strategic decisions will continue to have far-reaching implications for global trade, economic growth, and international financial stability.
Conclusion
Multinational corporations have fundamentally transformed international trade. By driving global supply chains, influencing market structures, transferring technology, and shaping trade policies, MNCs create opportunities and challenges for countries around the world. Their operations stimulate economic growth, expand trade volumes, and integrate emerging markets into global commerce. At the same time, their dominance introduces risks such as market concentration, supply chain vulnerabilities, and ethical concerns. Understanding the nuanced impact of MNCs is critical for policymakers, investors, and businesses seeking to navigate the complexities of global trade.
In essence, MNCs act as both facilitators and influencers of trade. Their strategies and decisions resonate across borders, shaping not only the flow of goods and services but also the broader economic and political environment in which international commerce occurs. As globalization evolves, the role of MNCs in trading will remain a defining factor in the architecture of the global economy.
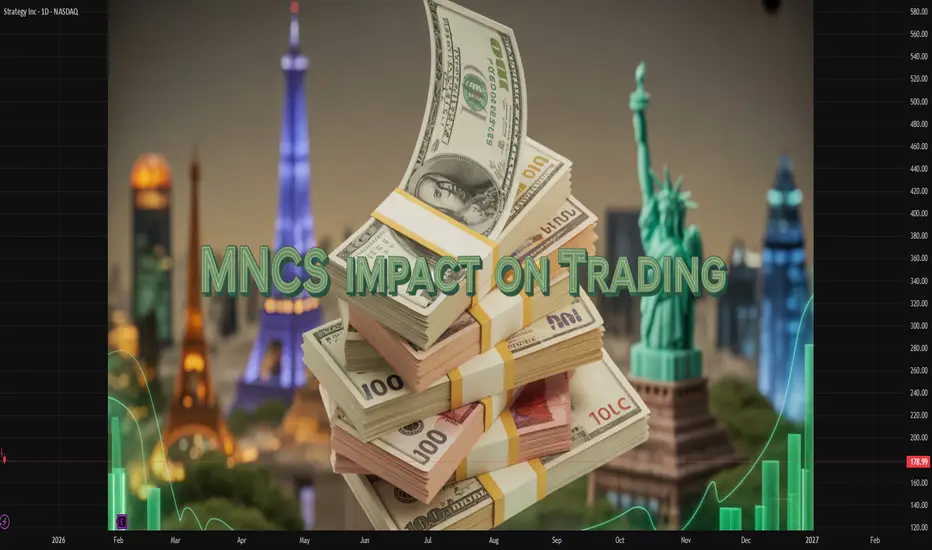
Forex Trading Secrets: Unlocking Success in the Currency Market1. Understanding the Forex Market
The first secret of Forex trading is understanding how the market works. Unlike stock markets, Forex is decentralized, meaning it does not have a central exchange. Currency pairs, such as EUR/USD or GBP/JPY, are traded in over-the-counter (OTC) markets through banks, brokers, and electronic platforms. Prices are influenced by multiple factors, including:
Economic indicators: GDP, inflation, unemployment, and trade balances.
Central bank policies: Interest rates and quantitative easing programs.
Geopolitical events: Elections, wars, and treaties can cause currency volatility.
Market sentiment: Traders’ collective emotions, risk appetite, and speculation.
Understanding these factors allows traders to anticipate market moves rather than react impulsively.
2. The Power of Technical Analysis
While fundamental analysis focuses on economic data, technical analysis is a cornerstone of Forex trading. It involves analyzing historical price charts to predict future movements. Key techniques include:
Support and Resistance: Identifying price levels where the market tends to reverse or consolidate. Trading near these zones increases the probability of success.
Trendlines and Channels: Recognizing the direction of the market (uptrend, downtrend, sideways) helps traders align their positions with the trend.
Candlestick Patterns: Certain formations like Doji, Hammer, or Engulfing patterns can signal potential reversals or continuations.
Indicators: Tools like Moving Averages, RSI (Relative Strength Index), MACD (Moving Average Convergence Divergence), and Bollinger Bands provide insight into momentum, volatility, and trend strength.
Professional traders often combine multiple indicators with price action to increase accuracy and reduce false signals.
3. Fundamental Analysis Secrets
While technical analysis is about patterns, fundamental analysis focuses on economic reality. Understanding the macroeconomic environment can give traders a long-term edge. Key secrets include:
Interest Rate Differentials: Currencies from countries with higher interest rates often strengthen as investors seek higher returns.
Economic Reports: Monitoring scheduled releases like Non-Farm Payrolls (NFP), CPI, and PMI can create predictable short-term volatility.
Political Stability: Elections, reforms, and geopolitical tensions significantly influence currency strength.
Correlation Awareness: Some currencies move in tandem (EUR/USD and GBP/USD), while others move inversely (USD/CHF vs EUR/USD). Knowing these correlations helps manage risk and hedge positions effectively.
By combining technical and fundamental insights, traders can identify high-probability trades.
4. Risk Management: The Hidden Secret
Perhaps the most overlooked “secret” of Forex trading is risk management. Even the most accurate strategies fail without proper risk control. Key rules include:
Never risk more than 1–2% of your trading capital per trade. This protects your account from large losses and allows survival in drawdown periods.
Use Stop-Loss Orders: Predetermine your exit point to limit losses. This prevents emotional decision-making.
Position Sizing: Adjust your lot size based on volatility and account size. Bigger trades do not equal bigger profits if risk is unmanaged.
Avoid Overleveraging: Forex brokers offer leverage, often up to 500:1. While tempting, excessive leverage can wipe out accounts within minutes.
Risk management transforms trading from gambling into a disciplined, professional practice.
5. The Psychological Edge
Trading is more psychological than technical. Many beginners fail due to emotional reactions such as fear, greed, and revenge trading. Secrets to mastering your mind include:
Discipline: Stick to your trading plan regardless of market noise.
Patience: Wait for setups that meet your criteria; avoid impulsive trades.
Emotional Detachment: Treat each trade as a business decision, not a personal victory or loss.
Consistency: Develop routines for analysis, journaling trades, and reviewing performance. Over time, consistent behavior compounds into better results.
Top traders often say that mastering your emotions is harder than mastering charts.
6. Trading Strategies that Work
While there is no single “holy grail” strategy, several proven methods increase winning probabilities:
Trend Following: Enter trades in the direction of the prevailing trend. Use moving averages or trendlines to confirm trends.
Breakout Trading: Trade price breakouts from key support or resistance levels. Confirm with volume or volatility indicators.
Range Trading: When markets are consolidating, buy at support and sell at resistance, using oscillators like RSI to identify overbought/oversold conditions.
Carry Trading: Exploit interest rate differentials by holding a higher-yielding currency against a lower-yielding one.
Each strategy requires discipline, testing, and adaptation to changing market conditions.
7. Secrets of Successful Forex Traders
Professional traders share certain habits that differentiate them from amateurs:
Journaling Trades: Keeping detailed records of every trade, including reasoning, results, and emotions.
Continuous Learning: Markets evolve; successful traders stay updated with news, economic changes, and new strategies.
Backtesting and Demo Trading: Testing strategies on historical data before risking real money is crucial.
Adapting to Market Conditions: Strategies that work in trending markets may fail in sideways markets. Flexibility is key.
These habits, combined with technical, fundamental, and psychological mastery, form the backbone of consistent Forex trading.
8. Advanced Tips and Hidden Secrets
Correlation and Diversification: Don’t concentrate all trades on one currency. Use uncorrelated pairs to reduce risk.
Understanding Market Liquidity: Major pairs (EUR/USD, USD/JPY) are more liquid and predictable than exotic pairs. Liquidity affects slippage and spread costs.
News Trading: Experienced traders exploit scheduled economic releases for short-term volatility. However, this requires speed and risk control.
Algorithmic Trading: Some traders use automated systems to remove emotions from trading, though these require careful design and monitoring.
The real “secret” is that Forex trading is a skill, not luck. Consistency and discipline beat random wins.
Conclusion
Forex trading can be highly profitable, but success comes from understanding the market, mastering technical and fundamental analysis, controlling risk, and cultivating psychological resilience. The true “secrets” are not hidden formulas or magic indicators—they are disciplined habits, strategic planning, and continuous learning. Traders who adopt these practices can transform Forex trading from a gamble into a sustainable career or supplementary income stream.
By combining these insights, one can develop a structured trading approach that maximizes opportunities while minimizing risks—a balance that separates successful traders from the rest.