The Anatomy of a Trap: Why Structure Alone Isn’t EnoughMarkets often look their most convincing right before they become the most deceptive. Clean chart patterns, widely recognized levels, and textbook formations can create a powerful sense of certainty — especially when many traders are seeing the same thing at the same time. Yet, certainty in markets is often where risk quietly concentrates.
The current structure on E-mini Dow Jones futures offers a textbook example of this dynamic. A rising wedge on the daily timeframe, a retracement toward a prior all-time high, and growing bearish conviction all appear neatly aligned. On the surface, the setup looks straightforward. Underneath, however, the market structure tells a more nuanced story — one centered on positioning, order flow, and the risk of traders getting trapped.
This article explores why structure alone is rarely enough, and how technically “correct” ideas can fail when they ignore what sits beneath price.
YM and MYM Futures: Setting the Context
The Dow Jones index futures complex is represented by two primary contracts:
E-mini Dow Jones Futures (YM)
Micro E-mini Dow Jones Futures (MYM)
Both track the same underlying index and reflect the same market structure, with differences primarily in contract size and capital exposure. On the daily timeframe, YM has been trading within a rising wedge — a structure that typically signals slowing upside momentum and an increased risk of a downside resolution.
What makes this moment particularly important is location. The market is not breaking down from a random price zone, but from a region tightly connected to historical reference points and trader memory.
The Rising Wedge: A Structure Everyone Recognizes
Rising wedges are among the most commonly taught chart patterns. They reflect higher highs and higher lows, but with diminishing upside slope — often interpreted as bullish exhaustion.
In this case, price has been retracing within the wedge, drifting toward its lower boundary. From a purely structural standpoint, a break below that lower trendline would appear to confirm the bearish thesis. Many traders anticipate that:
Support failure invites momentum sellers
Stops from late longs are triggered
Short sellers gain directional confirmation
This is where structure becomes compelling — and where risk begins to build.
The Prior All-Time High: A Psychological Fault Line
Just beneath the lower boundary of the rising wedge sits a highly visible reference level: the prior all-time high at 48,528.
Former highs often play a dual role. They act as:
Support for dip buyers expecting continuation
Trigger levels for bearish participation if broken
A decisive trade below such a level tends to shift sentiment quickly. Longs may exit, and short sellers often step in aggressively, expecting downside follow-through. From a traditional technical perspective, this behavior is logical.
But markets are not driven by logic alone — they are driven by positioning.
The Trap: Where Conviction Meets UnFilled Orders
Directly below the wedge and the prior all-time high lies a key element that changes the entire narrative: a notable UFO (UnFilled Order) support zone near 48,004.
UFOs represent areas where significant order flow previously entered the market but was not fully resolved. These zones often act as latent liquidity pockets, capable of absorbing aggressive participation when price revisits them.
Here is where the trap forms.
If price trades below the wedge and below the prior all-time high, it is likely to attract a surge of short sellers acting on:
Pattern breakdown logic
Momentum confirmation
Bearish sentiment reinforcement
However, if that downside move runs directly into unresolved demand from the UFO zone, the market may not continue lower. Instead, selling pressure can be absorbed faster than expected.
At that point, short sellers — confident moments earlier — may find themselves positioned on the wrong side of the market.
Why Structure Alone Isn’t Enough
This is the limitation of standalone technical analysis.
Chart patterns describe shape, not intent. They show where price has been, not how participants are positioned or where liquidity is likely to respond. A structure can break “correctly” and still fail to deliver continuation.
When too many traders act on the same signal at the same location, the market often does the opposite — not out of randomness, but out of mechanics.
In this case:
The rising wedge creates a bearish narrative
The prior high validates that narrative
The UFO support beneath invalidates trader expectations
Understanding this interaction is critical. Structure must always be evaluated alongside order flow context, not independently.
Illustrative Trade Scenario: Understanding Asymmetry
The following is a purely illustrative case study, designed to demonstrate risk logic — not to provide trading instructions.
One hypothetical framework might involve:
Price trading below the wedge and prior all-time high
Short sellers committing aggressively on perceived confirmation
Price interacting with the UFO support zone near 48,004
If selling pressure fails to extend and price stabilizes or reclaims broken structure, short sellers may be forced to cover. That covering process can accelerate upside movement, not because of new bullish conviction, but because trapped positions must be unwound.
In such scenarios:
Risk is defined by invalidation below the support
Reward emerges from forced repositioning
The edge comes from asymmetry, not prediction
The key lesson is not direction, but context.
Risk Management: Traps Cut Both Ways
Traps do not always work. Support and resistance zones based on order flow could fail too, and price can continue lower. This is why risk management remains non-negotiable.
Key principles include:
Predefined risk before engagement
Acceptance of invalidation
Position sizing aligned with volatility
Markets punish certainty. Risk management exists to survive uncertainty.
YM and MYM Contract Specifications
Understanding contract mechanics is essential when applying any analysis.
E-mini Dow Jones Futures (YM)
Contract multiplier: $5 × Dow Jones Index
Minimum tick: 1 index point
Tick value: $5 per contract
Current margin requirement: ~$14,250
Micro E-mini Dow Jones Futures (MYM)
Contract multiplier: $0.50 × Dow Jones Index
Minimum tick: 1 index point
Tick value: $0.50 per contract
Current margin requirement: ~$1,425
Margin requirements vary by broker and market conditions. Micro contracts offer reduced exposure and granularity, while standard contracts provide higher notional exposure. Both reflect identical market structure.
Key Takeaways
This YM case study highlights several enduring market lessons:
Widely recognized structures attract crowded positioning
Breakdowns near major reference levels amplify conviction
UnFilled Orders can absorb participation and reverse expectations
Structure without order flow context is incomplete
Markets don’t move because patterns exist. They move because traders are positioned — and sometimes trapped.
Data Consideration
When charting futures, the data provided could be delayed. Traders working with the ticker symbols discussed in this idea may prefer to use CME Group real-time data plan on TradingView: www.tradingview.com - This consideration is particularly important for shorter-term traders, whereas it may be less critical for those focused on longer-term trading strategies.
General Disclaimer
The trade ideas presented herein are solely for illustrative purposes forming a part of a case study intended to demonstrate key principles in risk management within the context of the specific market scenarios discussed. These ideas are not to be interpreted as investment recommendations or financial advice. They do not endorse or promote any specific trading strategies, financial products, or services. The information provided is based on data believed to be reliable; however, its accuracy or completeness cannot be guaranteed. Trading in financial markets involves risks, including the potential loss of principal. Each individual should conduct their own research and consult with professional financial advisors before making any investment decisions. The author or publisher of this content bears no responsibility for any actions taken based on the information provided or for any resultant financial or other losses.
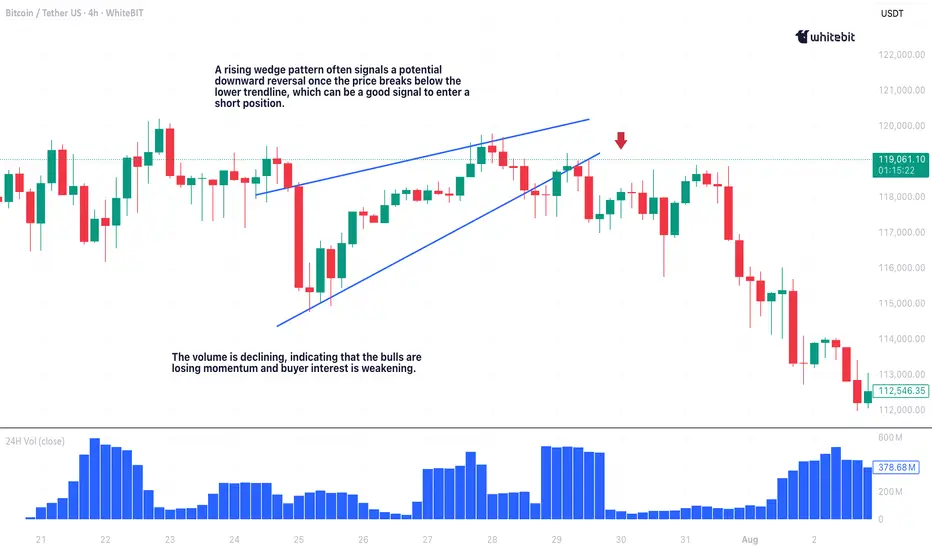
Rising Wedge

What’s a Wedge Pattern?What's up traders! 👋
Wedge patterns are a powerful tool in technical analysis that can give you a heads-up about potential price moves. Whether you’re spotting a falling wedge or a rising wedge, these formations can reveal key signals about market direction.
What’s a Wedge Pattern?
A wedge pattern forms when price moves between two converging trendlines, creating a shape resembling a triangle. These patterns usually appear when the market is slowing down or consolidating before making a bigger move. Wedges can slope upwards or downwards, and the key difference lies in whether the trendlines are converging in an uptrend (rising wedge) or a downtrend (falling wedge).
Falling Wedge Pattern: Bullish Reversal 📈
The falling wedge pattern is a bullish reversal signal. This formation occurs when price moves between two downward-sloping trendlines, creating a series of lower highs and lower lows. The downward momentum weakens as the trendlines converge, indicating that sellers are losing strength, which sets up the potential for a bullish breakout.
How to Trade the Falling Wedge
Entry: Wait for the price to break above the upper trendline. This is your signal to enter long.
Target: Measure the height of the wedge at its widest point and project it upwards from the breakout point.
Stop Loss: Place it just below the most recent swing low to protect your position if the breakout doesn’t happen.
The chart illustrates a falling wedge pattern on the Bitcoin / Tether US pair with a 1-hour timeframe. Price action is contained within two converging downward-sloping trendlines, suggesting weakening bearish momentum. The breakout above the upper trendline signals a bullish reversal, and the subsequent uptick in price confirms the shift in momentum.
In rare cases, a breakout failure can lead to a bearish falling wedge pattern, but this scenario is less common. Keep an eye on the price action for signs of continued upward momentum.
Rising Wedge Pattern: Bearish Reversal 📉
The rising wedge pattern is a bearish reversal signal. This formation happens when price moves between two upward-sloping trendlines, creating higher highs and higher lows. The rising wedge indicates weakening buying pressure and a potential reversal to the downside.
How to Trade the Rising Wedge
Entry: Enter a short position once the price breaks below the lower trendline.
Target: Measure the height of the wedge and project it downward from the breakout point.
Stop Loss: Set it just above the most recent swing high to protect your trade.
Wedge Chart Pattern Trading: Key Tips ⚡
Context is everything when trading wedge patterns. If a bullish wedge pattern appears in an uptrend, it’s more likely to break to the upside. If a bearish wedge shows up in a downtrend, expect a breakdown.
Here are a few quick tips to improve your wedge trading pattern game:
Trendlines are key: Ensure your trendlines are drawn accurately. Properly drawn trendlines lead to better trades.
Breakout confirmation: Confirm breakouts with increased volume and, ideally, by checking for confluence with other indicators like RSI or MACD. A breakout without volume is often a false signal.
Risk management: Always use a stop loss to protect your capital.
Use other indicators: Wedge patterns work well with additional tools such as RSI, moving averages, or MACD. The more confluence, the better!
Final Thoughts 🏁
Wedge patterns, whether it’s the falling wedge pattern signaling a bullish reversal or the rising wedge pattern trading indicating bearish pressure, are some of the most reliable chart formations out there. But remember: no setup is perfect, so always use a stop loss and never rely on a single indicator.
With practice, you’ll get better at spotting these setups and timing your entries and exits like a pro. Happy trading, and may the charts be in your favor! 💰📊
Trading Divergences With Wedges in ForexTrading Divergences With Wedges in Forex
Divergence trading in forex is a powerful technique for analysing market movements, as is observing rising and falling wedges. This article explores the synergy between divergence trading and wedges in forex, offering insights into how traders can leverage these signals. From the basics to advanced strategies, learn how you could utilise this approach effectively, potentially enhancing your trading skills in the dynamic forex market.
Understanding Divergences
In forex trading, the concept of divergence plays a pivotal role in identifying potential market shifts. A divergence in forex, meaning a situation where price action and a technical indicator like the Relative Strength Index (RSI) or Moving Average Convergence Divergence (MACD) move in opposite directions, often signals a weakening trend. This discrepancy is a valuable tool in divergence chart trading, as it may indicate a possible reversal or continuation of the current trend.
There are two primary types of divergence in forex—regular and hidden. Regular divergence occurs when the price makes higher highs or lower lows while the indicator does the opposite, often signalling a reversal. Hidden divergence, on the other hand, happens when the price makes lower highs or higher lows while the indicator shows higher highs or lower lows, typically suggesting a continuation of the current trend.
Trading Rising and Falling Wedges
Rising and falling wedges are significant patterns in forex trading, often signalling potential trend reversals. A rising wedge, formed by converging upward trendlines, often indicates a bearish reversal if it appears in an uptrend. Conversely, a falling wedge, characterised by converging downward trendlines, typically reflects a bullish reversal if it occurs in a downtrend.
Traders often look for a breakout from these patterns as a signal to enter trades. For rising wedges, a downward breakout can be seen as a sell signal, while an upward breakout from a falling wedge is often interpreted as a buy signal. When combined with divergences, this chart pattern can add confirmation and precede strong movements.
Best Practices for Trading Divergences
Trading divergence patterns in forex requires a keen eye for detail and a disciplined, holistic approach. Here are key practices for effective trading:
- Comprehensive Analysis: Before trading on divergence and wedges, be sure to analyse overall market conditions.
- Selecting the Right Indicator: Choose a forex divergence indicator that suits your trading style. Common choices include RSI, MACD, and Stochastic.
- Confirmation Is Key: It’s best to watch for additional confirmation from price action or other technical tools before entering a trade.
- Risk Management: Traders always set stop-loss orders to manage risk effectively. Divergence trading isn't foolproof; protecting your capital is crucial.
- Patience in Entry and Exit: Be patient as the divergence develops and confirm with your chosen indicators before entering or exiting a trade.
Strategy 1: RSI and Wedge Divergence
Traders focus on regular divergence patterns when the RSI is above 70 (overbought) or below 30 (oversold), combined with a rising or falling wedge pattern. The strategy hinges on identifying highs or lows within these RSI extremes. It's not crucial if the RSI remains consistently overbought or oversold, or if it fluctuates in and out of these zones.
Entry
- Traders may observe a regular divergence where both the price highs/lows and RSI readings are above 70 or below 30.
- After the formation of a lower high (in an overbought zone) or a higher low (in an oversold zone) in the RSI, traders typically watch as the RSI crosses back below 70 or above 30. This is accompanied by a breakout from a rising or falling wedge, acting as a potential signal to enter.
Stop Loss
- Stop losses might be set just beyond the high or low of the wedge.
Take Profit
- Profit targets may be established at suitable support/resistance levels.
- Another potential approach is to exit when the RSI crosses back into the opposite overbought/oversold territory.
Strategy 2: MACD and Wedge Divergence
Regarded as one of the best divergence trading strategies, MACD divergence focuses on the discrepancy between price action and the MACD histogram. The strategy is particularly potent when combined with a rising or falling wedge pattern in price.
Entry
- Traders typically observe for the MACD histogram to diverge from the price. This divergence manifests as the price reaching new highs or lows while the MACD histogram fails to do the same.
- The strategy involves waiting for the MACD signal line to cross over the MACD line in the direction of the anticipated reversal. This crossover should coincide with a breakout from the rising or falling wedge.
- After these conditions are met, traders may consider entering a trade in anticipation of a trend reversal.
Stop Loss
- Stop losses may be set beyond the high or low of the wedge, which may help traders manage risk by identifying a clear exit point if the anticipated reversal does not materialise.
Take Profit
- Profit targets might be established at nearby support or resistance levels, allowing traders to capitalise on the expected move while managing potential downside.
Strategy 3: Stochastic and Wedge Divergence
Stochastic divergence is a key technique for divergence day trading in forex, especially useful for identifying potential trend reversals. This strategy typically employs the Stochastic Oscillator with settings of 14, 3, 3.
Entry
- Traders may look for divergence scenarios where the Stochastic readings are above 80 or below 20, mirroring the RSI approach.
- This divergence is observed in conjunction with price action, forming a rising or falling wedge.
- Entry may be considered following a breakout from the wedge, which signals a potential shift in market direction.
Stop Loss
- Setting stop losses just beyond the high or low of the wedge might be an effective approach.
Take Profit
- Profit targets may be set at key support/resistance levels.
The Bottom Line
Divergence trading, coupled with the analysis of rising and falling wedges, offers a comprehensive approach to navigating the forex market. By integrating the discussed strategies with sound risk management and market analysis, traders may potentially enhance their ability to make informed decisions in the dynamic world of forex.
This article represents the opinion of the Companies operating under the FXOpen brand only. It is not to be construed as an offer, solicitation, or recommendation with respect to products and services provided by the Companies operating under the FXOpen brand, nor is it to be considered financial advice.

What is a Bearish Breakaway and How To Spot One!This Educational Idea consists of:
- What a Bearish Breakaway Candlestick Pattern is
- How its Formed
- Added Confirmations
The example comes to us from EURGBP over the evening hours!
Since I was late to turn it into a Trade Idea, perfect opportunity for a Learning Curve!
Hope you enjoy and find value!

Real Success Rates of the "Rising Wedge" in TradingReal Success Rates of the "Rising Wedge" in Trading
Introduction
The rising wedge, also known as the "rising wedge" in English, is a chart pattern that has a remarkable success rate in trading. This analysis details its performance, reliability and complementary indicators to optimize its use.
Success Rate and Performance
-Key Statistics
Overall success rate: 81% in bull markets
Average potential profit: 38% in an existing uptrend
-Breakout Direction
Bearish: 60% of cases
Bullish: 40% of cases
Contextual Reliability
Bull market: 81% success, average gain of 38%
After a downtrend: 51% success, average decline of 9%
Important Considerations
The rising wedge is generally a bearish pattern, indicating a potential reversal.
Reliability increases with the duration of the pattern formation.
Confirmation of the breakout by other indicators, especially volume, is crucial.
Complementary Indicators
-Volume
Gradual decrease during formation
Significant increase during breakout
-Oscillators
RSI (Relative Strength Index): Identifies overbought/oversold conditions
Stochastics: Detects price/indicator divergences
-Moving Averages
Crossovers: Signal trend changes
-Dynamic Support/Resistance: Confirm the validity of the wedge
-Momentum Indicators
MACD: Identifies price/indicator divergences
Momentum: Assesses the exhaustion of the trend
-Other Elements
Fibonacci Levels: Identify potential support/resistance
Japanese Candlestick Analysis: Provides indications of reversals
Conclusion
The rising wedge is a powerful tool for traders, offering a high success rate and significant profit potential. The combined use of complementary indicators increases the reliability of the signal and improves the accuracy of trading decisions. It is essential to look for a convergence of signals from multiple sources to minimize false signals and optimize trading performance.
_______________________________________________
Here are the best times to enter a trade after a rising wedge, in a professional manner:
-The confirmed breakout
Wait for the candle to close below the support line of the wedge.
Look for a significant increase in volume during the breakout to confirm its validity.
-The retest
Look for a pullback on the broken support line, which has become resistance.
Enter when the price rebounds downward on this new resistance, confirming the downtrend.
-The post-breakout consolidation
Identify the formation of a flag or pennant after the initial breakout.
Enter when this mini-formation breaks in the direction of the main downtrend.
-The confirmed divergences
Spot bearish divergences on oscillators such as the RSI or the MACD.
Enter when price confirms divergence by breaking a nearby support.
-Timing with Japanese Candlesticks
Identify bearish formations such as the Evening Star, Bearish Harami, or Dark Cloud.
Enter as soon as the next candle confirms the bearish pattern.
-Important Considerations
Always place a stop-loss to manage risk effectively.
Be patient and wait for the setup to be confirmed before entering the trade
Check the trend on higher timeframes to ensure the consistency of the trade.
Integrate the analysis of the rising wedge with other technical indicators to improve the quality of decisions.
By following these recommendations, traders can optimize their entries on rising wedges while minimizing the risk of false signals.

Rising and Falling Wedges ExplainedWelcome to the world of trading patterns. If you appreciate our charts, give us a quick 💜💜
Today, we'll explore two important ones: the Rising Wedge and the Falling Wedge . These patterns can signal shifts in market trends. Let's dive in and see how they work.
Rising Wedge:
In an uptrend, the Rising Wedge hints at a bearish turn. It takes shape as prices find a middle ground between two upward-sloping lines, one as support and the other as resistance, both inching closer. As the price inches towards the wedge's tip, its upward push tends to fade, suggesting a potential shift to a downward trend.
Your sell signal triggers with a bearish break beneath the wedge's support.
Set a stop loss just above the wedge's highs.
Aim for the next significant support level.
Falling Wedge:
Unlike the Rising Wedge, the falling wedge spells optimism in a downtrend. It emerges as prices consolidate between two downward-sloping lines, one providing support and the other resistance, both drawing nearer. As prices approach the wedge's apex, the downward momentum loses steam, hinting at a potential shift towards an upward trend.
Your buy signal activates with a bullish breakout beyond the wedge's resistance.
Place a stop loss just below the wedge's lows.
Target the next notable resistance.
Feel free to let us know your thoughts and if you have any questions. Your feedback is valuable and helps us improve. Happy trading!

Rising wedgeA rising wedge in an up trend is usually considered a reversal pattern. This pattern is at the end of a bullish wave, by creating close price tops, shows us that the supply has intensified and there is a possibility of a trend change. Of course, nothing is certain and if the buyers are more willing and strong, this pattern may be broken in the direction of the market rise.
A rising wedge in the middle of a downtrend, is considered a corrective move and is known as a continuing pattern. For example, take a look at the above chart of Ethereum on the weekly time frame

📈How to Trade: Rising Wedge Pattern📌 What is the Rising Wedge Pattern?
The rising wedge is a bearish chart pattern found at the end of an upward trend in financial markets. It suggests a potential reversal in the trend. It is the opposite of the bullish falling wedge pattern that occurs at the end of a downtrend. Traders recognize the rising wedge as a consolidation phase after a medium to long-term trend, indicating a decrease in momentum. Traders often use this pattern as a signal to take a short-selling position or exit their current position.
📊 How to Identify and Use the Rising Wedge
🔹 Identify an existing trend in a currency pair.
🔹 Draw support and resistance trend lines along with the highs and lows of the trend.
🔹 Wait for price consolidation and the contraction of the support and resistance lines, forming a rising wedge pattern.
🔹 Observe the upper trend line acting as resistance and the lower trend line acting as support, converging towards each other.
🔹 Place a sell order once the price breaks below the support line of the rising wedge pattern.
🔹 Set a stop-loss order at the same level as the support trend line to manage risk in case the price reverses.
🔹 Consider setting a profit target based on the distance between the highest and lowest points of the wedge pattern or by using a technical indicator or a previous support level as a reference.
💥 Key Takeaways:
🔸 The rising wedge is a technical chart pattern used to identify possible trend reversals.
🔸 The pattern appears as an upward-sloping price chart featuring two converging trendlines.
🔸 It is usually accompanied by decreasing trading volume.
🔸 A rising wedge is often considered a bearish chart pattern that indicates a potential breakout to the downside.
🔸 Wedges can either form in the rising or falling direction.
👤 @QuantVue
📅 Daily Ideas about market update, psychology & indicators
❤️ If you appreciate our work, please like, comment and follow ❤️

Wealth Unleashed: Wedge Pattern Power - Hidden Gem Revealed!Introduction:
Are you looking to skyrocket your trading profits? Look no further! Today, we will uncover the hidden gem of trading patterns: the Wedge Pattern. This powerful tool has the potential to transform your trading strategy and help you achieve financial success. Let's dive into the world of wedge patterns and explore how you can capitalize on their power.
What are Wedge Patterns?
Wedge patterns are popular among traders due to their high probability of forecasting trend reversals. These patterns appear when the price of an asset consolidates between converging support and resistance lines. There are two primary types of wedge patterns: the rising wedge and the falling wedge.
Rising Wedge:
In an upward trend, the rising wedge is considered a bearish pattern. It forms when the price consolidates between an upward-sloping support line and an upward-sloping resistance line that are converging. As the price approaches the apex of the wedge, the upward momentum weakens, signaling a potential trend reversal to the downside.
Falling Wedge:
Contrary to the rising wedge, the falling wedge is a bullish pattern. It appears in a downward trend when the price consolidates between a downward-sloping support line and a downward-sloping resistance line that are converging. As the price nears the apex of the wedge, the downward momentum loses strength, indicating a possible trend reversal to the upside.
Trading Strategies:
To capitalize on the power of wedge patterns, follow these steps:
✅Identify the pattern: Observe the chart for converging support and resistance lines to spot a rising or falling wedge pattern.
✅Confirmation: Wait for a breakout from the wedge pattern, either above the resistance line (for falling wedges) or below the support line (for rising wedges).
✅Entry point: Open a long position after a breakout above the resistance line in a falling wedge, or a short position after a breakout below the support line in a rising wedge.
✅Stop-loss and take-profit: Set your stop-loss order below the breakout level (for falling wedges) or above the breakout level (for rising wedges). Establish your take-profit target at a level that aligns with your risk-reward ratio and trading plan.
Conclusion:
The wedge pattern is a hidden gem that can potentially boost your trading profits when used correctly. By mastering the art of identifying and trading wedge patterns, you can strengthen your technical analysis skills and increase your chances of success in the market. Remember, no single tool guarantees success, so always use additional technical indicators and maintain a disciplined approach to risk management. Happy trading!

📉 4 Common Bearish PatternsIn trading, a bearish pattern is a technical chart pattern that indicates a potential trend reversal from an uptrend to a downtrend. These patterns are characterized by a series of price movements that signal a bearish sentiment among traders.
📍Bear Flag
🔸 A small rectangular pattern that slopes against the preceding trend
🔸 Forms after a rapid price decline (flagpole)
🔸 The pattern is completed when the price breaks below the lower trend line of the flag
📍Descending Triangle
🔸 A bearish continuation pattern that forms with a horizontal support line and a descending trendline
🔸 Forms as the price reaches lower highs, while the lows remain at the same level
🔸 The pattern is completed when the price breaks below the horizontal support line
📍Rising Wedge
🔸 A bearish reversal pattern that forms with a series of higher highs and higher lows
🔸 The pattern forms as the price moves up in a narrowing range
🔸 The pattern is completed when the price breaks below the lower trendline
📍Triple Top
🔸 A bearish reversal pattern that forms with three peaks at the same price level
🔸 The pattern forms as the price reaches resistance at the same level multiple times
🔸 The pattern is completed when the price breaks below the support level, which connects the lows between the peaks
👤 @AlgoBuddy
📅 Daily Ideas about market update, psychology & indicators
❤️ If you appreciate our work, please like, comment and follow ❤️

Classic Reversal Pattern You Must Know
☑️WHAT IS THE RISING WEDGE PATTERN?
The rising (ascending) wedge pattern is a bearish chart pattern that signals a highly probable breakout to the downside. It’s the opposite of the falling (descending) wedge pattern (bullish). A rising wedge can be both a continuation and reversal pattern, although the former is more common and more efficient as it follows the direction of an overall trend.
The rising wedge consists of two converging trend lines that connect the most recent higher lows and higher highs. In a rising wedge, the lows are catching up with the highs at a higher pace, which means that the lower (supporting) trend line is steeper.
☑️KEY FEATURES
• The price action temporarily trades in an uptrend (the higher highs and higher lows)
• Two trend lines (support and resistance) that are converging
• The decrease in volume as the wedge progresses towards the breakout
The third point is seen more as a boost to the validity and effectiveness of the pattern, rather than a mandatory element. And it is applicable either for stocks trading mostly.
☑️SPOTTING THE RISING WEDGE
Identifying a rising wedge is not so difficult. As a first step, you should eliminate all types of wedges that are present in the sideways-trading environment. The ascending wedge occurs either in a downtrend as the price action temporarily corrects higher, or in an uptrend.
☑️TRADING THE RISING WEDGE
Trading the rising wedge pattern is pretty easy. After we correctly identified the pattern all we need to do is wait patiently for the breakout of the wedge to the downside. After the breakout is confirmed(usually at least a 4H candle needs to close below the broken level) we can place a limit order to short the pair on a pullback giving us a better risk to reward ratio. The correct Stop Loss should be placed above the last higher high established by the wedge before the breakout. What concerns the Take Profit level, it must be based on the technical levels below( If there are any). If not, then we might use Trailing Stop or just choose a minimal acceptable RR of 1:1,5
❤️Please, support our work with like & comment!❤️
What do you want to learn in the next post?

How to understand the falling wedge and rising wedgeHello dear traders,
Here are some educational chart patterns you must know in 2022 and 2025.
I hope you find this information educational and informative.
We are new here so we ask you to support our views with your likes and comments,
Feel free to ask any questions in the comments, and we'll try to answer them all, folks.
What Is a Wedge?
A wedge is a price pattern marked by converging trend lines on a price chart. The two trend lines are drawn to connect the respective highs and lows of a price series over the course of 10 to 50 periods. The lines show that the highs and the lows are rising or falling at differing rates, giving the appearance of a wedge as the lines approach a convergence. Wedge-shaped trend lines are considered useful indicators of a potential reversal in price action by technical analysts.
Understanding the Wedge Pattern:-
A wedge pattern can signal either bullish or bearish price reversals. In either case, this pattern holds three common characteristics: first, the converging trend lines; second, a pattern of declining volume as the price progresses through the pattern; third, a breakout from one of the trend lines. The two forms of the wedge pattern are a rising wedge (which signals a bearish reversal) and a falling wedge (which signals a bullish reversal).
Falling Wedge pattern:-
When a security's price has been falling over time, a wedge pattern can occur just as the trend makes its final downward move. The trend lines drawn above the highs and below the lows on the price chart pattern can converge as the price slide loses momentum and buyers step in to slow the rate of decline. Before the lines converge, the price may breakout above the upper trend line.
When the price breaks the upper trend line, the security is expected to reverse and trend higher. Traders identifying bullish reversal signals would want to look for trades that benefit from the security’s rise in price.
Rising Wedge pattern:-
This usually occurs when the security's price has been rising over time, but it can also occur in the midst of a downtrend.
Trend lines drawn above and below a price chart pattern can converge to help a trader or analyst anticipate breakout reversals. While the price can break out of either trend line, the wedge pattern has a tendency to break out from the trend line in the opposite direction.
Therefore, the ascending wedge pattern indicates a higher probability of further downside in the price after the breakdown of the lower trend line. Traders can enter bearish trades on the basis of a charted security after a breakout, either by selling the security short or by using derivatives such as futures or options. These trades will seek to profit from the possibility of a fall in prices.
Trading Profits for the Wedge Pattern:-
As a general rule, price pattern strategies for trading systems rarely produce returns that outperform buy-and-hold strategies over time, but some patterns nevertheless appear to be useful in predicting general price trends. Huh. Some studies suggest that a wedge pattern will break out toward reversal (a bullish breakout for falling wedges and a bearish breakout for rising wedges) more than two-thirds of the time, with a falling wedge being followed by a rising wedge. Is a more reliable indicator than the wedge. ,
Because wedge patterns converge in a smaller price channel, the distance between the price at the entry of the trade and the price for the stop loss is relatively smaller than at the beginning of the pattern. This means that the stop loss can be placed closer to the time the trade is initiated, and if the trade is successful, can result in a return greater than the amount of risk initially placed on the trade.
Wedge a Continuation or a Reversal Pattern:-
The wedge pattern signals a reversal. The reversal is either bearish or bullish, depending on where the trend line meets, what the trading volume is, and whether the wedge is falling or rising.
Trade with care.
If you like our content, please feel free to support our page with a like, comment
Hit the like button if you like it and share your charts in the comments section.
Thank you

Forget about chart patterns! Hello, my dear friends and happy New Year!
I wish you to be healthy and reach all your goals in trading and not only! Never give up on this difficult way which we are going to overcome together!
Today we have a very important topic. How to use Elliott waves instead of classical chart patterns. This is the natural exposure why the chart patterns are garbage. I remember my third year at university when we have the trading lessons. Our teacher gave us a lot of useless knowledges about support, resistance and chart patterns. I have not understood why it should working and it was not soo intereting subject for me. That’s why I returned back to trading much later using self-education. Now I have the clear understanding why Elliott waves is the best tool and why it’s working. Most of traders even don’t understand that chart patterns is just the special case of Elliott waves. That’s why today I decided to explain you how you can change the first one to the second one. Let’s go!
Double Top(Bottom)
On the chart above I drew the different types of double tops. Generally we have 3 types of this pattern
Double top with the second top higher than the first one. In this case we can interpret it in two ways. It could be the classical waves 3, 4, 5 and the corrective wave A at the ending stage. In this case we can anticipate waves B and C. Also it could be the irregular correcton ABC inside wave 4 (rarely in wave 2). In this case we should wait for the wave 5 after that. Traders usually execute short position on the neckline breakdown and suffer when the wave 5 smashed their stop-loss. They are wondering why double top does not working.
Double top with the equal highs has the same possible outcomes. The only one difference that correction called flat instead of irregular.
Double top with the second top lower than the first one. Here is the most common variant is the end of the ABC correction. In this case we have the low potential for shorting the market becuase the new impulsive wave to the upside can hit all stop losses.
Head & Shoulders
This is the easiest pattern for analysis. The right sholder usually is the wave 4, the head, obviously is the wave 5 and the right shoulder is the wave B. On the neckline breakdown we have the shorting potential only in the rest part of the wave C. You could correctly count waves and short that the bearish reversal bar of the wave 5 or, as a last resort, at wave B potential top. Shorting at the neckline has sence only if you are sure that the wave B was the the wave 1 of the impulsive wave to the downside if higher degree and now the market is in wave 3. We have to learn how to count waves in a correct way. I would recommend you to read the Trading Chaos book by Bill Williams because it has the best explanation how do waves work.
Triangles and Wedges
This part is common for all types of triangles (ascending, descending, symmetrical) and wedges (falling and rising). This patterns have the similar structure. If we faced with one of these patterns we have 4 possible scenarios.
Triangle in the downtrend after the wave 3. In this case triangle is the wave 4, which is represented as the triangle correction. This correction type consists of 5 waves A, B, C, D and E. When the wave E is finished market will continue it’s move in the direction of a trend, printing the wave 5.
The same, but in the uptrend.
When the market showed us the 5 waves cycle to the upside and the correction is in progress. Triangle can appears in the wave B. In this case the price will continue the corrective move in the wave C after it’s finished.
The same with the downtrend.
Guys, of course there are much more types of chart patterns. For example, tripple tops and bottoms and so on. The purpose of this article is giving you another view of the market structure and to motivate you studying the Elliott waves theory. Believe me, it has much more potential than it seems on the first glimplse.
Best regards, Ivan
________________________________________________________________________________________________
If you like my educational ideas, please smash the boost button to stimulate me make more quality articles!

✅UNDERSTAND THE RISING WEDGE PATTERN✅
☑️WHAT IS THE RISING WEDGE PATTERN?
The rising (ascending) wedge pattern is a bearish chart pattern that signals a highly probable breakout to the downside. It’s the opposite of the falling (descending) wedge pattern (bullish). A rising wedge can be both a continuation and reversal pattern, although the former is more common and more efficient as it follows the direction of an overall trend.
The rising wedge consists of two converging trend lines that connect the most recent higher lows and higher highs. In a rising wedge, the lows are catching up with the highs at a higher pace, which means that the lower (supporting) trend line is steeper.
☑️KEY FEATURES
• The price action temporarily trades in an uptrend (the higher highs and higher lows)
• Two trend lines (support and resistance) that are converging
• The decrease in volume as the wedge progresses towards the breakout
The third point is seen more as a boost to the validity and effectiveness of the pattern, rather than a mandatory element. And it is applicable either for stocks trading mostly.
☑️SPOTTING THE RISING WEDGE
Identifying a rising wedge is not so difficult. As a first step, you should eliminate all types of wedges that are present in the sideways-trading environment. The ascending wedge occurs either in a downtrend as the price action temporarily corrects higher, or in an uptrend.
☑️TRADING THE RISING WEDGE
Trading the rising wedge pattern is pretty easy. After we correctly identified the pattern all we need to do is wait patiently for the breakout of the wedge to the downside. After the breakout is confirmed(usually at least a 4H candle needs to close below the broken level) we can place a limit order to short the pair on a pullback giving us a better risk to reward ratio. The correct Stop Loss should be placed above the last higher high established by the wedge before the breakout. What concerns the Take Profit level, it must be based on the technical levels below( If there are any). If not, then we might use Trailing Stop or just choose a minimal acceptable RR of 1:1,5
I Hope you guys learned something new today✅
Wish you all Best Of Luck👍
😇And may the odds be always in your favor😇
Do you like this post? Do you want more articles like that?

What is Rising Wedge pattern and how to trade with that?The Rising Wedge (also known as the ascending wedge) pattern is a powerful consolidation price pattern formed when price is bound between two rising trend lines. It is considered a bearish chart formation which can indicate both reversal and continuation patterns – depending on location and trend bias. Regardless of where the rising wedge appears, traders should always maintain the guideline that this pattern is inherently bearish in nature (see image).
HOW TO IDENTIFY A RISING WEDGE PATTERN ON CHARTS
The rising wedge pattern is interpreted as both a bearish continuation and bearish reversal pattern which gives rise to some confusion in the identification of the pattern. Both scenarios contain a different set of observation dynamics which must be taken into consideration.
Reversal Pattern:
Established uptrend
Rising wedge consolidation formation
Linking higher highs and higher lows using a trend line assembling towards a narrowing point
Look for break below support for short entry
Continuation Pattern:
Established downtrend
Rising wedge consolidation formation
Linking higher highs and higher lows using a trend line assembling towards a narrowing point
Look for break below support for short entry
How to trade with this:
*Entry Point: Right after the candlestick breakout of the support.
*Stop-Loss: At the highest resistance level of the Wedge pattern.
*Take-Profit: From the entry point, the distance is equal to the maximum width ( H ) of the rising wedge pattern.
This is the academic shape of this pattern, in the future we will publish Falling Wedge pattern 📚 . Please follow our page to be informed as soon as the materials are published.
Thank you all for supporting our activity with Likes 👍 and Comments ❤️

A Guide about Falling & Rising Wedge PatternsHello every one
🟡WHAT IS A FALLING WEDGE PATTERN?
The falling wedge pattern is a continuation pattern formed when price bounces between two downward sloping, converging trendlines. It is considered a bullish chart formation but can indicate both reversal and continuation patterns – depending on where it appears in the trend.
🌳HOW TO IDENTIFY A FALLING WEDGE PATTERN
The falling wedge pattern is interpreted as both a bullish continuation and bullish reversal pattern which gives rise to some confusion in the identification of the pattern. Both scenarios contain different market conditions which must be taken into consideration.
The differentiating factor that separates the continuation and reversal pattern is the direction of the trend when the falling wedge appears. A falling wedge is a continuation pattern if it appears in an uptrend and is a reversal pattern when it appears in a downtrend.
(Example)
🔵WHAT IS A RISING WEDGE PATTERN?
The rising wedge (also known as the ascending wedge) pattern is a powerful consolidation price pattern formed when price is bound between two rising trend lines. It is considered a bearish chart formation which can indicate both reversal and continuation patterns – depending on location and trend bias. Regardless of where the rising wedge appears, traders should always maintain the guideline that this pattern is inherently bearish in nature
🌳HOW TO IDENTIFY A RISING WEDGE PATTERN
The rising wedge pattern is interpreted as both a bearish continuation and bearish reversal pattern which gives rise to some confusion in the identification of the pattern. Both scenarios contain a different set of observation dynamics which must be taken into consideration.
(Example)

How to trade Rising Wedge patternWhat is a rising wedge?
A rising wedge is a technical pattern, suggesting a reversal in the trend . This pattern shows up in charts when the price moves upward with higher highs and lower lows converging toward a single point known as the apex.
There are 4 ways to trade wedges like shown on the chart
(1) Your entry point when the price breaks the lower bound of the wedge, place your stop loss above the last peak, your target range is the distance between the upper and lower bound of the wedge at the start point.
(2) Your entry point when the price breaks the neckline of the double top pattern inside the wedge pattern, place your stop loss above the double top, place your target as same as shape (1)
(3) Your entry point when the price retest the lower bound of the wedge, place your stop loss above the last peak inside the wedge pattern, place your target as same as shape (1)
(4) a false breakout may occur in the rising wedge pattern, wait the price to go inside the pattern again and your entry point should be after breaking the last trough and your stop loss should be placed above the last peak that has been formed within the wedge, your target should be placed as same as shape (1).
We wish you the best of luck!

price action patterns you need to know ( part 4 ) hi my friends , i'll share with you some patterns which can help you in trading ( part 4 )
Falling Wedge appear in downtrend and it indicates that the sellers are losing momentum in the market, and the buyers are gaining momentum ( long ) you can go long after the break or the retest of the trendline .
rising Wedge appear in uptrend and it indicates that the buyers are losing momentum in the market, and the sellers are gaining momentum ( short ) you can go short after the break or the retest of the trendline
note : Usually we find there is a divergence in the RSI indicator and this can be used as confirmation .
please support me with like and follow me for more ideas .

What are Falling and Rising Wedge Patterns?What Is the Wedge Pattern and Its Common Characteristics?
1. Wedge patterns have converging trend lines that come to an apex with a distinguishable upside or downside slant.
a. Wedge with an upside slant is called a rising wedge
b. Wedge with downside slant is called falling wedge
2. It has declining volumes as the pattern progresses.
3. It breaks out from one of the trend lines.
Why We Should Pay Attention to Wedge Patterns?
Some studies suggest that a wedge pattern will breakout towards a reversal rather than a continuation more often than two-thirds of the time. Therefore as the rule of thumb, people generally treat a falling wedge as a bullish pattern and a rising wedge as a bearish pattern, especially a falling wedge would be a more reliable reversal indicator than a rising wedge.
Since we know a wedge pattern has a higher probability to reverse and due to the fact that the price of wedge pattern converges to a smaller area, we can trade the reversal set up with a relatively close stop loss to its entry price, which provides us with a good trading opportunity with a decent Risk:Reward ratio.
Examples of a Bullish Rising Wedge and Bearish Falling Wedge.
Sadly, there is nothing that works 100% in trading. Not every rising or falling wedge will reverse as one might expect. Every trader must properly manage their risk by setting stop losses and not just trading based on price patterns. Below are two examples.
Bullish Rising Wedge (ETHUSDT during 15/NOV/20 - 28/DEC/20)
In the early stages of the epic 20-21 bull market, if traders blindly treat the rising wedge as a bearish signal and trade accordingly, they would pay a heavy price.
Bearish Falling Wedge (LTCUSD during 14/AUG/18 - 14/NOV/18)
On the contrary, in the late stage of the 2018 bear market, any trader who blindly trades the falling wedge to bet on a reversal would also learn a hard lesson.
Comment down your thoughts on Ascending Triangle Pattern in the comment section.
Disclaimer:
This is just an educational post. Never trade just any pattern. And please do your research before making any trades.
Happy Trading!

Closer look into Rising/Falling Wedge, Reversal Price Action
Closer look into Rising/Falling Wedge, Reversal Price Action structures/patterns
Hi traders:
Today I will go more in detail on rising/falling wedge correction in price action structures/patterns.
You might have already heard about these types of correctional structures, and many traders who utilize them.
Certainly there are many ways of traders identifying them and taking advantage of these kinds of price action, so it's ideal for you to understand them in your analysis.
We first need to understand that a rising/falling wedge is a REVERSAL price action. Meaning when the correction completes, there's a higher probability of the price to reverse.
You might have already seen multiple price action videos from me that go over all sorts of continuation and reversal price action (I will share links below),
and I always talk about when combining multiples of different price action structures/patterns will give you a better edge at entering positions that work out in your favor.
Same idea here, so let's take a look at how rising/falling wedges are, how to identify them, and how to effectively use them in your analysis.
Rising/falling wedge, just as the name suggests, is an ascending/descending type of correction where the price is getting squeezed into a “wedge”.
As the price gets narrower and narrower, there's a higher probability of the price to “reverse” from the wedge.
Now about entries, certainly many traders have their own method of entering, so I will share my point of view and the way how I like to enter them.
Any questions, comments or feedback welcome to let me know :)
Thank you
Risk Management: 3 different entries on how to enter the impulsive phrase of price action
Multi-time frame analysis
Identify a correction for the next impulse move in price action analysis
Continuation and Reversal Correction
Continuation Bull/Bear Flag
Parallel Channel (Horizontal, Ascending, Descending)
Reversal Ascending/Descending Channel
Reversal Double Top/Bottom
Reversal Head & Shoulder Pattern
Reversal “M” and “W” style pattern
Reversal Impulse Price Action
Continuation/Reversal Expanding Structure/Pattern

Wedge Pattern TradingRising Wedge Pattern is a trend reversal chart pattern that that indicates gradually decrease in market momentum.
if it is traded with confluence like a supply or resistance level then Winning probability of this setup will increase.

EDUCATION - Rising & Falling Wedges - Reversal PatternsWhat is an ascending/descending correction?
The most common reversal pattern is the rising and falling wedge, which typically occurs at the end of a trend. The pattern consists of two trendiness which contract price leading to an apex and then a breakout appears.
Rising Wedge – Bearish Reversal
The ascending reversal pattern is the rising wedge which consists of higher highs and higher lows whilst losing momentum to the upside. Price contracts and eventually has a bearish break.
Falling Wedge – Bullish Reversal
The falling wedge reversal pattern occurs at the end bear run and indicates that price is ready to reverse. Again, price contracts and then eventually breaks out upwards.
There are 2 types of ways we can trade wedge patterns; Risky Entry & Safe Entry. See below for the pros and cons for both and how to enter them
__________________________________________________________________
Risk Entry:
The reason why it is called a risk entry is because we haven't got many confirmations apart from the third touch of the trendline (as indicated in the chart above). Price may have the potential to go past the trendline for a deeper correction before moving up hence why this is called a risk entry. Whereas for the safe entry, the confirmation would be the break of the wedge.
How to trade using Risk Entry:
Wait for price to bounce off the trendline and then enter with stops below/above the correction depending on whether it’s a rising wedge or falling wedge.
One of the advantages of doing a risk entry is that we can have small stop loss and have a great risk:reward ratio. Also, we can gain an entry at the start of the move and have massive gains!
Safe Entry:
Safe entry requires more than one confluence and requires confirmation. One of the confirmations of the safe entry is the third touch bounce and then another confirmation is when price breaks the correction which confirms that the structure has changed and that we are in a reversal.
How to trade using Safe Entry:
For a safe entry, enter when price has broken the correction with stops above/below the correction. Please note that with this entry method, the stoploss will be greater.
The disadvantage to using a safe entry is that we require a bigger stop loss which makes the risk:reward ratio not as great as the risk entry. However, the probability of the trade succeeding is higher.
RISING WEDGE EXAMPLES
RISK ENTRY
SAFE ENTRY
FALLING WEDGE EXAMPLES
RISK ENTRY
SAFE ENTRY
