Trading the VIXOften dubbed the "fear index," the VIX gauges SPX options' implied volatility, typically rising during equity market declines and vice versa. It quantifies investor anxiety, demand for hedging, and market stress, crucial for traders and risk managers seeking to measure turbulence.
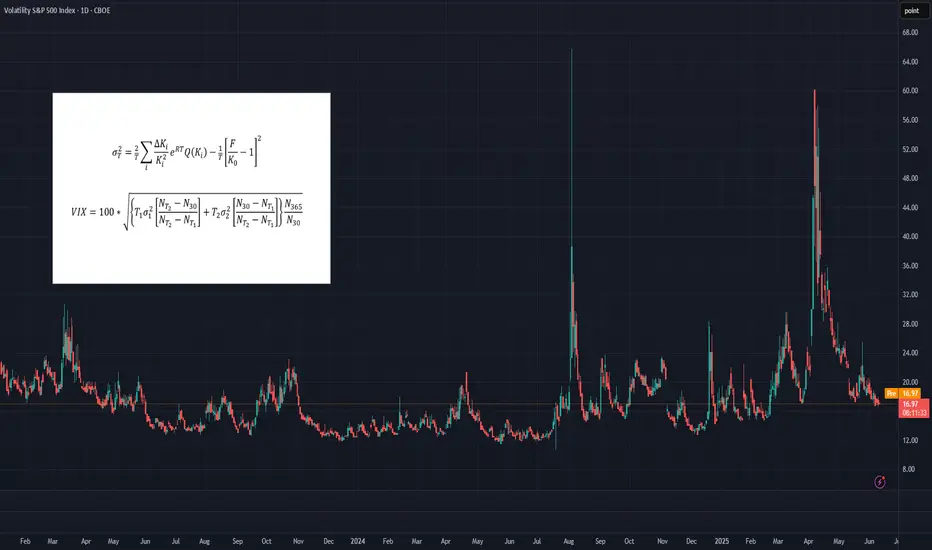
The VIX calculates a constant 30-day implied volatility using SPX options expiring over the next two months. Unlike simple weighted averages of equity indices, its methodology is more complex, involving implied variance calculation for the two nearest monthly expirations across all strikes. For detailed formulas, refer to the introductory chart or visit the CBOE’s official VIX Index page.
While the VIX Index itself isn’t tradable, exposure can be gained through VIX futures or exchange-traded products (ETPs) like VXX, UVXY, and SVXY. However, these instruments come with their own unique risks, pricing behaviors, and structural nuances, which can make directional VIX trading considerably more complex than it might initially appear.
What You Need to Know About Implied Volatilities
• In calm or uptrending markets, the volatility curve typically slopes upward (contango), indicating higher implied volatility with longer maturities.
• In declining or turbulent markets, the curve can invert, sloping downward (backwardation), as shorter-term implied volatilities rise sharply.
• This pattern can be observed, comparing VIX9D, VIX, and VIX3M against the SPX. In stable markets: VIX9D < VIX < VIX3M. In stressed markets, this relationship may reverse. The VIX9D and VIX3M are the 9-day respectively 3-month equivalent to the 30-day VIX.
What You Need to Know About VIX Futures
• When the volatility spot curve is in contango, the VIX futures curve will also slope upward.
• In backwardation, the futures curve slopes downward, reflecting heightened short-term volatility and short-term volatility spikes.
• While in contango, VIX futures "roll down the curve," meaning that—independent of changes in volatility—futures tend to decline in value over time.
• In backwardation, the opposite occurs: futures "roll up the curve," potentially rising in value over time even without volatility changes.
• VIX futures’ responsiveness to VIX Index movements – the beta of VIX futures against the VIX index - declines with longer expirations; front-month futures may react to 70-80% of VIX changes, compared to 40-60% for third or fourth-month futures.
Key Consequences for Traders
• Directional trading of VIX futures can be strongly influenced by the shape of the futures curve.
• Contango in low-VIX environments creates strong headwinds for long VIX futures positions, caused by the “roll-down-effect”.
• Conversely, backwardation in high-VIX environments creates headwinds for short positions.
• These effects are more pronounced in front-month contracts, making timing (entry and exit) for directional trades critical.
• There's a trade-off in directional strategies: front-month futures offer greater exposure to VIX movements but suffer more from negative roll effects.
How to Trade VIX Futures
• Due to these structural challenges, directional VIX futures trading is difficult and requires precision.
• A more effective approach is to trade changes in the shape of the futures curve using calendar spreads (e.g., long VX1, short VX2). This reduces the impact of roll effects on individual contracts.
• In low-VIX, contango conditions, a rising VIX typically leads to VX1 increasing faster than VX2, widening the VX1–VX2 spread—an opportunity for spread trading.
• While VX1 may initially suffer more from roll-down than VX2, this can reverse as the VIX rises and VX1 begins to “roll up,” especially when VIX > VX1 but VX1 < VX2.
• The opposite dynamic applies in high-VIX, backwardation environments.
• More broadly, changes in the shape of the futures curve across the first 6–8 months can be profitably traded using calendar spreads. Roll-effects and the declining beta-curve can also be efficiently traded.
How to capture the Roll-Down-Effect
One of the more popular VIX-trading strategies involves capturing the roll-down effect,, while the curve is in contango. It is a positive carry strategy that is best applied during calm or uptrending market conditions. Here’s a straightforward set of guidelines to implement the Roll-Down-Carry trade:
• Entry Condition: Initiate during calm market conditions, ideally when VIX9D-index is below VIX-index (though not guaranteed).
• Choosing Futures: Use VX1 and VX2 for calendar spreads if VX1 has more than 8-10 trading days left; otherwise, consider VX2 and VX3.
• Spread Analysis: Short VX1 and long VX2 if VX1–VIX spread is larger than VX2–VX1; otherwise, VX2 and VX3 may be suitable.
• Contango Effect: VX1’s roll-down effect typically outweighs VX2’s during contango.
• Relative Beta: VX1 shows higher reactivity to VIX changes compared to VX2, mimicking a slight short position on VIX.
• Exit Strategy: Use spread values, take-profit (TP), and stop-loss (SL); consider exiting if VIX9D crosses over VIX.
________________________________________
Conclusion
Directional trading of the VIX Index—typically through futures—demands precise timing and a good understanding of the volatility curve. This is because curve dynamics such as contango and backwardation can create significant headwinds or tailwinds, often working against a trader’s position regardless of the VIX’s actual movement. As a result, purely directional trades are not only difficult to time but also structurally disadvantaged in many market environments.
A more strategic and sustainable approach is to trade calendar spreads, which involves taking offsetting positions in VIX futures of different maturities. This method helps neutralize the impact of the curve's overall slope and focuses instead on relative changes between expirations. While it doesn’t eliminate all risk, calendar spread trading significantly reduces the drag from roll effects and still offers numerous opportunities to profit from shifts in market sentiment, volatility expectations, and changes in the shape of the futures curve.
What else can be done with VIX instruments
VIX indices across different maturities (VIX9D, VIX, VIX3M), along with VIX futures, offer valuable insights and potential entry signals for trading SPX or SPX options. In Part 2 of the Trading the VIX series, we’ll explore how to use these tools—along with VIX-based ETPs—for structured trading strategies.
Spread
How to Read a Forex Quote: Bid, Ask, and Spread ExplainedSo, you’ve decided to jump into the forex markets and stumbled upon your first quote. Now you're staring at numbers like EUR/USD 1.0987/1.0990, wondering what these flashing digits mean. Don’t worry—we’ve all been there. Let’s break it down, TradingView style, and get you up to speed on forex quotes, bid-ask spreads, and why these tiny decimal points matter more than you might think.
The Basics: What’s a Forex Quote?
At its core, a forex quote tells you the exchange rate between two currencies. Think of it like a price tag for the money you want to buy or sell. In any quote, you’ve got two currencies: the base currency and the quote currency. For example, in EUR/USD , the euro (EUR) is the base currency, and the US dollar (USD) is the quote currency. This quote tells you how many US dollars it costs to buy one euro.
Now the fun part: You’ll notice two prices next to that quote—the bid and the ask.
Bid vs. Ask: What’s the Difference?
When you see a forex quote like EUR/USD 1.0987/1.0990, you’re actually looking at two prices:
Bid Price (1.0987): This is the price a buyer (broker or trader) is willing to pay for the base currency. In simpler terms, this is the price you sell at.
Ask Price (1.0990): This is the price the seller (broker or trader) is willing to sell you the base currency for. In other words, this is the price you buy at.
So, if you’re buying EUR/USD , you’ll pay the ask price (1.0990), and if you’re selling, you’ll receive the bid price (1.0987). Notice how the ask is always higher than the bid? That’s where brokers make their money. Which brings us to…
The Spread: The Broker’s Cut
The spread is the difference between the bid and the ask. In this case, it’s 1.0990 - 1.0987 = 0.0003 or 3 pips (percentage in points). Think of the spread as the broker’s fee for facilitating the trade, essentially acting as the middleman. The tighter the spread, the less you’re paying to execute a trade.
For major currency pairs like EUR/USD , the spread is often pretty small (like 1-3 pips), but for exotic pairs (think USD/ZAR or USD/TRY ), spreads can get wider than your Uncle Bob’s waistband after Thanksgiving dinner.
Why the Spread Matters for Traders
Here’s the thing: spreads eat into your profits. Whether you’re a day trader or holding a longer-term position, the spread is something you need to bake into your strategy.
Scalpers and day traders need tight spreads. If you’re making a bunch of small, quick trades throughout the day, every pip counts. Wide spreads can kill your profit margins faster than a rogue tweet from Elon Musk.
Swing traders and position traders are less sensitive to spreads. If you’re in it for the long haul, a few pips won’t make or break your trade. But it’s still something to keep an eye on, especially when trading less liquid currency pairs.
Market Conditions and Spreads
Spreads aren’t fixed — ideally, they should be floating around in real-time dealmaking. They widen and tighten based on market conditions. During high volatility (like, say, a major economic announcement or a surprise central bank rate cut), spreads can widen. Conversely, during quiet market hours, spreads tend to tighten.
To avoid getting fleeced by wide spreads, keep an eye on liquidity. Major pairs like EUR/USD , GBP/USD , or USD/JPY have higher liquidity, meaning tighter spreads. Exotic pairs? Not so much. You’ll pay more to play in the less popular markets.
How to Use the Bid-Ask Spread to Your Advantage
Here’s a pro tip: If you’re in a tight spread market, like EUR/USD during peak trading hours, you can place tighter stop-loss and take-profit orders, maximizing your profits with minimal slippage. In volatile markets with wider spreads, give yourself more breathing room, or wait until liquidity returns.
How TradingView Does It
On TradingView, forex pairs are displayed with a single price quote rather than separate bid and ask prices. This single price quote represents the midpoint between the bid and the ask. TradingView uses this midpoint, also called the last trade price , to better display price flow and make it simpler to analyze price trends without the fluctuation that would come from constantly updating bid and ask prices.
For traders using TradingView to monitor forex prices, this single price quote allows them to focus more on price movements and technical analysis rather than factoring in the spread between bid and ask, which as we mentioned, is available with brokers since it's their bread and butter. So factor this in.
The Bottom Line
Going expert-level at bid, ask, and spread isn’t just forex surviving — it’s forex thriving. These tiny details can be the difference between making bank or watching your profits trickle away. Always factor in the spread when setting up trades, especially if you're trading lower-volume currency pairs or during off-hours.
Ready to flex your new bid-ask spread skills? And win some prizes at the same time? Join our paper trading competition "The Leap" , starting November 1, and show everyone what you've got. $25,000 are up for grabs.

How I used Volume Spread Analysis to avoid FOMO trading!As a trader, I often battle with the fear of missing out (FOMO), a common pitfall among traders that can lead to impulsive, unprofitable trades. After reviewing my journal, I determined that chasing breakouts was costing me a significant portion of my account, so I studied Volume Spread Analysis (VSA) to help me reduce my urges. Here is how is used VSA to avoid FOMOing a trade.
Before we get started, let's clarify two definitions:
Volume: Measures the number of times buyers and sellers exchange 1 unit of an asset at an agreed-upon price. It doesn't inherently indicate whether a trend is bullish or bearish, but rather that a trade has occurred. Low volume suggests that few transactions have taken place because buyers and sellers couldn't agree on price. High volume suggests that buyers OR sellers felt they were getting a bargain at the current price, leading to many transactions.
Spread/Range: The difference between the high and low of a candlestick. A narrow spread indicates little variance between what someone is willing to buy for and what someone is willing to sell for. A wide spread suggests that buyers and sellers have significantly different ideas of what the fair price is.
In short, Volume Spread Analysis (VSA) interprets the relationship between trading volume and candle spread. When volume and spread agree, they are considered harmonious, and the trend will probably continue. If volume and spread disagree, there is a divergence, and the trend may be weak or could even reverse. In general, there are three main harmonious conditions:
Narrowing spread should have narrowing volume.
Average spread should have average volume.
Widening spread should have widening volume.
I spotted a bear flag consolidation on QQQ and decided I would trade the breakout to the downside. I took a break and came back to the chart just after the breakdown had occurred, missing my ideal entry. The candle spread was widening and my first thought was "I have to get in! This thing is free falling!" PAUSE! I reminded myself that I cant make every dollar in the market. If I miss this trade, there will always be another. "Be patient and wait for the market to come back to you."
This is the chart after the initial break. What can we observe? QQQ broke the low of day with high volume and a widening red candle. Based on our definitions from earlier, we know that high volume means that buyers or sellers think they are getting a bargain so they are willing to transact as much as they can at current price. Given that price is falling, we can assume that the volume is due to aggressive selling. We remain patient and continue to watch for something to trade against.
Next, we see a narrower range candle with a long lower shadow and above average volume. By definition, strong volume with a narrow range is a possible divergence. We know that narrow range candles mean that buyers and sellers generally agree on current price, but why would it close near the highs if the selling was so aggressive? Given that there is a long lower shadow and then a bullish candle close, we can infer that sellers were not willing to sell below $467.89. The buyers absorbed the selling at those prices.
Fast forwarding, we notice that the volume and candle size has shrunk back to the average meaning buyers and sellers are in agreeance. The number of people willing to transact is decreasing. We also notice that a small range has formed. Buyers have not stepped in to buy above the previous low of day at $469.35 and the sellers have shown no effort to get back below $467.89. Now we have something to trade against instead of FOMOing in! We will look for a break of this range with increased volume.
On the next candle we see bulls break out of the range with aggressive volume and a wide spread candle. Something of note is that the volume on this bull candle is less that the volume of our initial sell candle. If those sellers were still present, wouldn't they be selling at these higher prices and forcing the candle range to be narrow? This shows us that bulls are now in control and the selling from earlier was just a hoax.
As we can see, the rest is history. If I FOMOed into the short as I had planned, this trade would have resulted in a loss. Being patient allowed me to realize that there was nothing to miss out on and actually allowed me to find a better trade.
Key Notes
Always journal your trades and review them
Never FOMO into a trade. Be patient and wait for the trade to come to you!
You dont need to take every trade to make money in the market. It is okay to miss a trade if it means protecting your account.
Volume spread analysis is not 100%, but it can be useful in determining the strength of a trend.

Volume Spread Analysis (VSA): Volume and Price DynamicsVolume Spread Analysis (VSA): Understanding Market Intentions through Volume and Price Dynamics.
█ Simple Explanation:
Volume Spread Analysis (VSA) is a trading technique that identifies key market patterns and trends by analyzing the relationship between volume and price spread, revealing traders' actions and market behavior.
Essentials in Volume Spread Analysis (VSA):
Laws.
VSA Indicator.
Signs of Strength.
Signs of Weakness.
Note that while the provided examples are excellent for illustrating the points, they are unlikely to play out perfectly in most scenarios.
█ Laws
Three basic laws forming the foundation of Volume Spread Analysis (VSA).
The Law of Supply and Demand
This law states that supply and demand balance each other over time. High demand and low supply lead to rising prices until demand falls to a level where supply can meet it. Conversely, low demand and high supply cause prices to fall until demand increases enough to absorb the excess supply.
The Law of Cause and Effect
This law assumes that a 'cause' will result in an 'effect' proportional to the 'cause'. A strong 'cause' will lead to a strong trend (effect), while a weak 'cause' will lead to a weak trend.
The Law of Effort vs Result
This law asserts that the result should reflect the effort exerted. In trading terms, a large volume should result in a significant price move (spread). If the spread is small, the volume should also be small. Any deviation from this pattern is considered an anomaly.
█ VSA Indicator
This indicator simplifies the identification of Volume and Spread Levels. It provides options to display volume and/or spread bars. An enhanced version of the indicator auto-scales both volume and spread for optimal chart presentation, reloading every time the chart is moved.
Levels: Representing the levels of both volume and spread using the terminalogy of low, normal, high, and ultra.
Indicator Version 1: Display volume and/or spread bars. When both are displayed, the spread bars are shown in a fixed quantity.
Indicator Version 2: Display both volume and spread bars, with the spread bars scaled to the volume bars.
█ Signs of Strength
Indicates that the market is likely to experience bullish behavior.
Down Thrust: Indicates strong buying interest at lower prices, suggesting a potential upward reversal.
Selling Climax: Signifies a reversal point as panic selling exhausts and smart money starts accumulating.
Bear Effort No Result: A large downward price move without strong selling effort (volume) indicates an anomaly where the result doesn't match the effort, suggesting the down move may be unsustained.
No Effort Bear Result: Strong selling effort (volume) fails to push prices down indicating an anomaly where the result doesn't match the effort, suggesting a potential lack of downward momentum.
Inverse Down Thrust: Shows buyers overpowering sellers, likely leading to a bullish market reversal.
Failed Selling Climax: Failed selling effort suggests strong buying support and a possible upward trend reversal.
Bull Outside Reversal: Indicates strong buying reversing a downtrend, confirmed by higher close.
End of Falling Market: Signifies strong buying absorbs panic selling at new lows, likely leading to stabilized price or reversal.
Pseudo Down Thrust: Suggests weakening of the downward momentum with a potential upward continuation if broken above high.
No Supply: Indicates a lack of selling interest at lower prices, potentially setting up for a price rise.
█ Signs of Weakness
Indicates that the market is likely to experience bearish behavior.
Up Thrust: Indicates sellers overpowering buyers during a price rise, suggesting a potential downward reversal.
Buying Climax: Represents peak buying, typically at price highs, with potential for reversal as sellers take control.
No Effort Bull Result: A large upward price move without strong buying pressure (volume) indicates an anomaly where the result doesn't match the effort, suggesting the up move may be unsustained.
Bull Effort No Result: Strong buying (volume) fails to drive prices higher indicates an anomaly where the result doesn't match the effort, suggesting a potential lack of upward momentum.
Inverse Up Thrust: Increased selling pressure during an uptrend suggests a possible shift to a downtrend.
Failed Buying Climax: High buying volume fails to sustain higher prices, indicating a potential reversal to downtrend.
Bear Outside Reversal: Strong selling pressure reversing an uptrend, signaling a potential downtrend.
End of Rising Market: Indicates buying saturation at market peaks, suggesting a possible reversal as demand exhausts.
Pseudo Down Thrust: Indicates weakening upward momentum with potential for downward continuation if broken below low.
No Demand: Indicates reduced buying interest at higher prices, possibly leading to a price decline.

[EDU-Bite Sized Mini Series]Margin? Lots? Spread? What are they?Hello fellow traders , my regular and new friends!
Welcome and thanks for dropping by my post.
Today we are going to cover terms such as Margin, Lot size, Spread and What are they.
Forex trading is a dynamic and potentially lucrative endeavor, but it comes with its own set of terminology and jargon that can be intimidating for beginners. Understanding these terms is crucial for aspiring traders to navigate the forex market effectively and make informed decisions.
Margin
One of the fundamental concepts in forex trading is margin, which refers to the amount of money required to open and maintain a trading position. Margin allows traders to control larger positions with a relatively small amount of capital, amplifying both potential profits and losses. It's important for traders to understand margin requirements and manage their leverage carefully to avoid excessive risk.
Lot Size
Another key concept is lots, which represent the size of a trading position in forex. Standard lots typically consist of 100,000 units of the base currency, while mini lots and micro lots represent 10,000 and 1,000 units, respectively. Lot size determines the potential profit or loss of a trade, with larger lots leading to greater fluctuations in account equity. If you are more comfortable with smaller lot size, you can even go on to nano lots in 100 unit of currency.
Spread
Spread is another term commonly used in forex trading, referring to the difference between the bid and ask prices of a currency pair. The bid price is the price at which traders can sell a currency pair, while the ask price is the price at which they can buy it. The spread represents the cost of executing a trade and can vary depending on market conditions and liquidity.
There are different types of spreads encountered in forex trading, including fixed spreads and variable spreads. Fixed spreads remain constant regardless of market conditions, providing traders with certainty about trading costs. On the other hand, variable spreads fluctuate in response to market volatility, widening during times of high activity and narrowing during periods of low activity.
Understanding these trading terms and jargon is essential for beginners to develop a solid foundation in forex trading. By mastering concepts such as margin, lots, spread, and different types of spreads, aspiring traders can make more informed decisions and effectively manage their risk in the dynamic and fast-paced world of forex.
Do check out my recorded video (in trading ideas) for the week to have more explanation in place.
Do Like and Boost if you have learnt something and enjoyed the content, thank you!
-- Get the right tools and an experienced Guide, you WILL navigate your way out of this "Dangerous Jungle"! --
*********************************************************************
Disclaimers:
The analysis shared through this channel are purely for educational and entertainment purposes only. They are by no means professional advice for individual/s to enter trades for investment or trading purposes.
*********************************************************************

What is Spread in Trading | Everything You Need to Know
Hey traders,
It turned out that many newbie traders completely neglect spreads in their trading.
In this post, we will discuss what is the market spread and how it can occasionally spoil a seemingly good trade.
💱No matter what financial instrument we trade, in order to buy the asset we need to have a counterpart that is willing to sell it to us and vice versa, if we want to sell the asset, we need to have someone to sell it to.
The market provides a convenient exchange between buyers and sellers. The asset price is determined by a current supply and demand.
However, even the most liquid markets have two prices: bid and ask.
🙋♂️ Ask price represents the lowest price the market participants are willing to sell the asset to you, while 🙇♂️ bid price shows the highest price the market participants are willing to buy the asset from you.
Here is how bid and ask prices look like.
Bid and ask price are almost never equal. The difference between them is called the spread .
📈The spread size depends on liquidity of the market.
📍Higher liquidity implies bigger trading volumes and greater number of market participants, making it easier for them to make an exchange.
On such markets we see lower spreads.
📍From the other side, less liquid markets are categorized with low trading volumes, making it harder for the market participants to find a counterpart for the exchange.
On such market, spreads are usually high.
For example, current EURUSD price is 1.0249 / 1.0269.
Bid price is 1.0249 - you open short position on that price.
Ask price is 1.0269 - you open long position on that price.
The spread is 2 pips.
❗️Spreads must always be considered in a calculation of a risk to reward ratio for the trade. For scalpers and day traders, higher than usual spread may spoil a seemingly good trade.
Always check spreads before you open the trade.
Check how the spread is displayed in the trading terminal.
In 2020, for example, we saw unusually high spreads on Gold during UK/NY trading sessions. Spreads were so high that I did not manage to open a trade for a couple of days.
Not considering spreads in such a situation would cost you a lot of money.
Do you consider spread when you trade?🤓

Stock Market Logic Series #7Options Spreads strategy, let us talk about it.
If you want to buy high-probability spreads, there are specific places where you have the advantage.
And, there are other specific places where it is just pure gambling.
And, we don't gamble, EVER.
We take calculated risks, where the probability of success is much higher than the probability of loss.
--------------------------
In spread options, what matters the most is where the price will be at the expiration date.
WHY?
Because your profit can only be realized near the expiration date unless the price moves dramatically into your favor and far away from the spread strikes.
So, if what matters is where the price is at the expiration date, you want that in this future date, the price of the stock to be away from it, with HIGH PROBABILITY.
As you can see from the drawing on the chart,
the blue channel signifies the probability area of where the price should be in the future.
So if in the future, you are in the probable zone, as seen in the RED spreads, at the expiration date, the price could be below or above your strikes, and thus be successful or not successful, so your odds are more 50-50.
since the price can just stall there, and oscillate in this area, since it is the probable area where the price should be.
But if you look carefully at historical data, you can see that in the GREEN (MONEY ZONES), the price gets immediately rejected...
WITH THE HELP OF T-I-M-E
And when you buy spreads, you want TIME to be on your side...
So now you can easily see... how to make TIME which is a HUGE factor in spreads, on your side!
The trend is your friend... IF... you let it TIME to help you...
When you use options, and trading options in general you need to know which strategy fits which scenario, and where your HIGH probability trade waiting for you.
Just in case you don't know what options spreads are...
In simple words...
You choose 2 prices of the stock (aka strikes):
------$100
------$90
and you speculate that
if the price in a month will be above $100, you profit 1 point.
and if the price in a month will be below $90, you lose 1 point.
So it is a 1:1 risk-to-reward strategy.
So your advantage comes from knowing where are the pivot points.
But not all pivot points have the same advantage...
As I just showed you in this post...

Factor Forex Spread into Trades: A Guide to Bid & Ask PricesHave you ever found yourself in a situation where trade was closed out before reaching your intended stop loss level, or where the market reaches your profit target but the trade never closes in your favour?
It can be frustrating and confusing, leaving you wondering what went wrong. You may even start to blame your broker or the market itself, thinking they are conspiring against you. But the truth is, it's not the market or your broker - it's you.
The key issue is that you're not taking the market spread into account when setting your trade levels. A professional trader must always factor in the spread to avoid inconsistencies and mishaps in their trades. In this post, we will discuss the difference between the BID and ASK price, understand what the market spread is and show you how to factor it into your trade levels for a smoother and more successful trading experience.
As a professional trader, it is crucial to understand the BID and ASK prices. Failure to do so can result in costly mistakes when setting up trades. When placing a trade, these two prices are crucial to consider.
The BID Price
The BID price is something that every trader should have a good understanding of.
The BID price is the price that is displayed on the charts, for example, if the USD/JPY pair was displaying 110.00 on your chart, then the BID price is 110.00.
The BID price is the price that you deal with every time you press the sell button. This is because it is the price at which your broker is willing to purchase the currency from you. In other words, you are selling the currency to your broker at the BID price.
The ASK Price
The ASK price can be a little more complex, as it is often the cause of unexpected outcomes in trade orders.
Typically, you do not see the ASK price when you have your charts open, it is only visible when you open your trade order window or enable that option in your trading software.
The ASK price is the price at which your broker is willing to sell you the currency, and it is a completely different price than what you see on the charts. The ASK price is what you deal with every time the BUY button is pressed and it is typically more expensive than the BID price you are viewing on the chart.
Therefore, the ASK price is the price your broker is "asking" for to sell the currency. The BID price may be 1.45000 on the charts but your broker's ASK price may be something like 1.45030. This is where the concept of calculated Forex spread comes into play.
How to Incorporate Spread into Trade Planning
When placing trade orders, it is important to remember two key principles. These principles must be applied every time you enter and exit a trade, so it is essential to memorize them or keep them in a visible place for reference.
~ When going long, the market is entered at the ASK price and exited at the BID price.
~ When going short, the market is entered at the BID price and exited at the ASK price.
For instance, let's say you want to set a pending order to go long when USD/CAD reaches 1.30000 on the chart, you don’t simply place the pending order entry price at 1.30000. Remember the rule for long trades, you ‘enter the market at the ASK price because the ASK price is what your broker is willing to sell you the currency for. Whenever you are the buyer – the ASK price is quoted.
If your broker's spread is roughly 2 pips for USD/CAD, when the market reaches 1.30000 your broker will be "asking" for 1.30020.
So when the price on the chart reaches 1.30000 (this is the BID price), your broker will be willing to sell the currency for 1.30020 (when the spread is 2 pips).
Therefore, if you place your pending order with an entry price of 1.30000, your trade will not be triggered because your broker is not willing to sell you the currency for that price at that point in time. In this case, you would have to wait for the BID price to reach 1.29980, at which point the broker's ASK price would be 1.30000 and your trade will be filled.
In order to ensure that the trade is triggered when the BID price reaches 1.30000, you must factor in the market spread and set your entry order at 1.30020.
Determining Stop Loss and Exit Prices for Long Positions
Determining stop loss and exit levels for long positions is made relatively simple by utilizing the BID price. The BID price, which is the price at which your broker is willing to buy the currency back from you, reflects the prices that are commonly obtainable from the Interbank Market.
When exiting a trade, the currency is sold back to the broker at the BID price. The BID price is the one that is visible on the charts, and there is no additional commission to be taken into account. Therefore, stop and target levels can be set directly off the BID prices displayed on the charts, making the process straightforward.
Setting Up Short Trades
When executing short trades, the process is reversed. Short trades are entered at the BID price, so the price displayed on the chart is used for the short entry order.
However, the stop loss and target prices for short trades must take into account the Forex spread, as the trade will be exited at the ASK price, which is typically higher than the BID price due to the broker's commission.
To ensure that stop loss levels are not triggered prematurely, the Forex spread must be calculated and added to the stop loss value. This will allow the trade to move freely to its stop-loss level before being closed.
Additionally, the Forex spread must also be factored in for the target price levels of short trades. The target price should be found on the chart, the spread added, and that value should be used as the target price level for every short trade order.
By following the proper procedures for calculating and factoring in the Forex spread, you can now confidently place trade orders and enter the Forex market in an effective manner. This will prevent frustration and disappointment by ensuring that pending orders are executed correctly and that trades exit at the intended price levels.

What is a Spread in Forex?Hello hello! In this post, we'll take a look at the basic principles behind the spread in forex market and why it is important.
In the foreign exchange market, the spread is the difference between the bid price and the ask price for a particular currency pair. The bid price is the highest price that a market maker is willing to pay for a currency, while the ask price is the lowest price at which a market maker is willing to sell the same currency. The spread, therefore, represents the cost of trading a particular currency pair.
When trading in the forex market, traders usually buy a currency at the ask price and then sell it at a higher bid price, hoping to make a profit. The spread is the difference between the two prices and it represents the trader's cost of trading that currency pair.
The spread is usually expressed in pips, which is the smallest unit of price change in the forex market. For example, if the bid price for EUR/USD is 1.0735 and the ask price is 1.0740, the spread would be 5 pips.
The size of the spread can vary depending on the currency pair being traded and the market conditions. Some currency pairs, such as the major pairs like EUR/USD, USD/JPY, and GBP/USD, tend to have relatively tight spreads, while others, such as the exotic pairs, can have wider spreads. Also, the spread can vary depending on the trading conditions, for instance, during high volatility period, such as economic news release, the spread tend to widen.
In forex trading, traders should always be aware of the spread as it represents a cost of trading and it affects the trader's potential profits and losses. Spreads are usually factored into a trader's profit and loss calculations and it is important to consider the spread before opening a trade. Some brokers also offer variable spreads and fixed spreads, it is important to be aware of the difference between the two.
Many online forex brokers now offer variable spreads, which means that the spread will change depending on the market conditions, but some brokers also offer fixed spreads, which means that the spread will remain the same regardless of market conditions.

2% Rule with CFDs versus Spread TradingThe rule is very easy to understand.
Whether you trade using CFDs or Spread Betting, the rule is the same.
Never risk more than 2% of your portfolio on any one trade.
It’s one rule that you can use whether you have a R1,000 account or a R10,000,000 account.
You see, trading is a forever business.
This means, as a trader you should risk as little of your portfolio as possible in order to stay in the game longer.
We’ll now go straight into how you to enter your CFDs and Spread Betting trades using the 2% rule.
How to enter your CFD trade using the 2% Rule
Here are the specifics for the trade
CFD of the underlying Company: TIM Ltd CFDs
Portfolio value: R100,000
2% Max risk per CFD trade: R2,000
Entry price: R400.00
Stop loss price: R380.00
To calculate the no. of CFDs you’ll buy per trade, you’ll need the:
~ Max risk per trade
~ Entry Price and
~ Stop loss price
Next, you’ll need to follow two steps:
Step #1:
Calculate the risk in trade
The ‘risk in trade’ is the price difference between where you enter and where your stop loss is:
Risk in trade = (Entry price – Stop loss price)
= (R400 – R380)
= R20
Step #2:
Calculate the no. of CFDs to buy
No. of CFDs to buy = (2% Risk ÷ Risk in trade)
= (R2,000 ÷ R20)
= 100 CFDs
In your platform you’ll type in 100 TIM CFDs to buy, place your entry price at R400 and your stop loss price at R380 to risk only 2% of your portfolio.
Note: 1 CFD = 1 Share exposure
100 CFDs = 100 Shares exposure
How to enter your Spread Trade using the 2% Rule
With spread trading you trade on a ‘value per 1 point’ basis.
You’ll choose either: R0.01, R0.10, R1 or any other amount per 1 cent movement in the underlying market.
If you choose R0.10 value per 1 cent movement, for every 10 cents the market moves against or for you, you’ll lose or gain 100 cents (10 cents value per point X 10 cents movement).
Here are the specifics for the spread trade.
Contract of the underlying Company: TIM Ltd
Portfolio value: R100,000
2% Max risk per Spread trade: 200,000c (R2,000)
Entry price: 40,000c (R400.00)
Stop loss price: 38,000c (R380.00)
To calculate the ‘Value Per Point’ to enter your long (buy) trade, you’ll need the:
~ Max risk per trade
~ Entry Price
~ Stop loss price
Next, you’ll need to follow two steps:
Step #1:
Calculate the risk in trade
Risk in trade = (Entry price – Stop loss price)
= (40,000c – R38,000c)
= 2,000c (R20.00)
Step #2:
Value per 1 cent movement
Value per 1 cent movement
= (2% Risk ÷ Risk in trade)
= (200,000c ÷ 2,000c)
= 100c (R1.00)
This means, with a ‘Value per point of 100c’ every 1 cent the TIM Ltd share price moves, you’ll make or lose 100 cents.
Every 2,000c the market moves, you’ll make or lose 200,000c or R2,000 of your portfolio (100c Value per 1 cent movement X 2,000c movement).
Note:
1 Cent per 1 cent movement = 1 Share exposure
100 Cents per 1 cent movement = 100 Shares exposure

It’s trading wheaty (pretty) high now...Continuing the topic of spreads between related commodities, the Hard Red Winter Wheat – Soft Red Winter Wheat spread is another one trading at an extreme level now.
A brief explanation on the different types of wheat we are referring to here:
1) The Hard Red Winter Wheat (HRW) is the most widely grown class of wheat. A high protein product, used for breads, some types of Asian noodles and general-purpose flour.
2) The Soft Red Winter Wheat (SRW) is the third largest class of wheat variety grown in the US, lower protein wheat used in producing confectionary products such as cookies, crackers, and other bread products.
Generally, the HRW Wheat Futures (KE) trades at a premium to the SRW Wheat Futures (ZW) due to the higher protein content, however other factors such as production levels and supply demand dynamics may disrupt this spread, as seen from the wide range it has been trading since 1977.
Currently, this spread is trading close to 132 cents, with only one instance where it has traded higher, which was in March 2011 when this spread reached an all-time high of 164.
We attribute the spread trading at a high now due to the following 2 reasons:
1) The 2022 HRW production is currently the lowest on record since 1963, due to widespread droughts across many of the HRW production regions.
2) The average protein content of the 2022 yield is higher than last year, as well as the average of the past 5 years, resulting in a higher quality crop.
As a result, HRW is trading at a premium as supply shortage and a higher quality product pushes the price higher, while SRW sees average production and quality.
While it is challenging to assess the production levels and quality for the next season, from a risk reward perspective, we see an opportunity here. The past few spread peaks have been clearly marked out by Relative Strength Index (RSI) pointing oversold. With the 10-year average for the spread at 6.3 cents and the RSI now oversold, we lean bearish on the spread.
Referencing the average of the past 3 declines at 150 cents and lasting 511 days, we could set out trade levels.
If the historical pattern holds this time, a conservative target of 120 cents and a trade length of 500 days points us to the 15-cent level. We see the current set-up as an opportunistic one, with similar episodes in the past pointing lower. CME also has the synthetic KC HRW Wheat-Wheat Intercommodity Spread, which can be used to express the same view and is financially settled.
The charts above were generated using CME’s Real-Time data available on TradingView. Inspirante Trading Solutions is subscribed to both TradingView Premium and CME Real-time Market Data which allows us to identify trading set-ups in real-time and express our market opinions. If you have futures in your trading portfolio, you can check out on CME Group data plans available that suit your trading needs www.tradingview.com
Disclaimer:
The contents in this Idea are intended for information purpose only and do not constitute investment recommendation or advice. Nor are they used to promote any specific products or services. They serve as an integral part of a case study to demonstrate fundamental concepts in risk management under given market scenarios.
Sources:
www.uswheat.org
www.cmegroup.com
www.cmegroup.com
www.usda.gov

Bull Bear Power Void - Your volume oscillator is lying to you.The simplicity of this indicator is REALLY what has me gassed up. It's the smallest indicator I have coded but it is just so powerful. There are a million oscillators out there based on volume. My biggest problem with them is that they simply tell you whether you have volume to the upside or volume to the down side. It kind of tricks you with the lack of information into thinking you have a change in your trend or that you're going to be able to break out of a range across a moving average or through some trend line or support and resistance.
However many of these Oscillators are failing because they lack to tell you one key thing. They tell you that you have volume but they never tell you if it's enough volume.
Even a popular indicator like the MACD can have its MACD Line crossing upwards over the signal, telling you that you have an uptrend but again it's still failing to give you the results of how much volume of trades you have and "is it enough" volume in that crossover. It boils down to the one key fact that without volume there is no momentum. This should be able to make trading crossovers a lot easier.
So in today's video I'm going to show you the newest addition to the trading View Community Scripts and it is called,
"The Bull Bear Void Volume Oscillator"
Use this link to get it for free
From my own testing, this oscillator can predict whether the next candle will get you the move you need or not. In the markets you cannot have anything good without volume. After you have volume you have momentum. You cannot have momentum without volume and this is the key thing that causes people to fail when they look for breakouts, trend reversals, or if they're wondering whether this move is a fake out.
This indicator is based on the study of volume spread analysis or VSA.
This indicator is designed to be paired perfectly with the Heiken Ashi Algo oscillator.
Get it here
This indicator is strictly to be used as a confirmation indicator and not to be used by itself to tell you when to buy or sell.
What are its Parts?
The Colored Columns or Volume Bars
RED Column - Indicates volume movie downward
Light Red - indicates volume is pulling back from a downward move
Green - indicates volume is moving upwards
Light Green - indicates volume is moving down from an outboard move
The void
Is Green for bullish and red for bearish. This is a Cloud that appears extending from the center upwards and downwards. This is the average range of volume. Anything volume closing inside of this void is ranging volume or very little volume and it is not enough to break the trend or break out.
The MACD and MACD Signal Line
Just like using the macd these two lines indicate whether the trend is moving up or the trend is moving down. But in this oscillator it's been colorized to show you when profits are being taken versus new positions being opened in either direction.
Rules for a SELL CONFIRMATION TRADE
The macd line must be underneath the signal line and the macd line must be below the midline.
A bullish column must appear below the midline and it must extend outside of the red void.
if you are using the heikin-ashi Aldo oscillator you must also have a red Heiken Ashi candle close below -10.
The MACD trend line must be a solid color and NOT black.
To open a LONG position you simply reverse the rules.

Demo MYX Future Market Watchlist GeneratorThis is demo for MYX Future Market Watchlist Generator.
The process is similar and explain in this video .
I did some mistake during watchlist. Watchlist does not need to be created.
Import directly from file, new watchlist name will appear.
Sorry for inconvenient caused, this video does not contain audio. Thank you.

What is Spread in Trading | Trading Basics 📚
Hey traders,
It turned out that many newbie traders completely neglect spreads in their trading.
In this post, we will discuss what is the market spread and how it can occasionally spoil a seemingly good trade.
💱No matter what financial instrument we trade, in order to buy the asset we need to have a counterpart that is willing to sell it to us and vice versa, if we want to sell the asset, we need to have someone to sell it to.
The market provides a convenient exchange between buyers and sellers. The asset price is determined by a current supply and demand.
However, even the most liquid markets have two prices: bid and ask.
🙋♂️Ask price represents the lowest price the market participants are willing to sell the asset to you, while 🙇♂️bid price shows the highest price the market participants are willing to buy the asset from you.
Bid and ask price are almost never equal. The difference between them is called the spread.
📈The spread size depends on liquidity of the market.
📍Higher liquidity implies bigger trading volumes and greater number of market participants, making it easier for them to make an exchange.
On such markets we see lower spreads.
📍From the other side, less liquid markets are categorized with low trading volumes, making it harder for the market participants to find a counterpart for the exchange.
On such market, spreads are usually high.
For example, current EURUSD price is 1.0249 / 1.0269.
Bid price is 1.0249 - you open short position on that price.
Ask price is 1.0269 - you open long position on that price.
The spread is 2 pips.
❗️Spreads must always be considered in a calculation of a risk to reward ratio for the trade. For scalpers and day traders, higher than usual spread may spoil a seemingly good trade.
Always check spreads before you open the trade.
In 2020, for example, we saw unusually high spreads on Gold during UK/NY trading sessions. Spreads were so high that I did not manage to open a trade for a couple of days.
Not considering spreads in such a situation would cost you a lot of money.
Do you consider spread when you trade?🤓
❤️If you have any questions, please, ask me in the comment section.
Please, support my work with like, thank you!❤️

Quality And Location Spreads Provide Fundamental CluesMy introduction to commodity markets came in the 1970s when I was invited to work for the summer for the world’s leading commodity merchant company. In the 1970s, Philipp Brothers’ headquarters were in the heart of New York City. The company had offices all over the world. Where it did not have an office, it had a network of agents. Philipp Brothers bought commodities from producers and provided financing for raw materials production and sold to consumers. In an era of rising inflation in the late 1970s, the company was so profitable that it bought the leading Wall Street, privately held bond trading and investment banking firm, Salomon Brothers.
My first job was delivering telex messages to trading and traffic departments. Traders were the kings, earning millions in profits. The traffic department arranged the logistics of moving raw materials around the globe from production points to consuming locations. The telex messages contained information about proposed transactions and completed ones. I read each one with great interest. Those messages turned out to be an invaluable education in the business.
The high school job turned into a lifelong career. The excitement of markets and the global nature of the commodities business was a powerful force that caused me to forgo law school for a career as a commodity trader.
Market structure- We looked at processing spreads and term structure
Location-location-location is the real estate mantra- It applies to commodities too
Different qualities command premiums or discounts
Another part of market structure that can provide valuable clues and makes the pieces of the puzzle form a picture
I view the commodity markets as a jigsaw puzzle with many moving pieces. Each market has idiosyncratic characteristics. Quality and location are parts of each market’s structure and can provide insight into the path of least resistance of prices.
Market structure- We looked at processing spreads and term structure
Over the past two weeks, I highlighted processing spreads and term structure, two critical puzzle pieces. In the future, I will cover substitution spreads and the essential technical factors that held uncover a picture of the path of least resistance for prices.
Processing spreads tell us about the demand for one commodity that is a product of another. Crude oil crack spreads and soybean crush spreads were examples.
Term structure tells us about the supply-demand balance as backwardation where deferred prices are lower than nearby prices for the same commodity indicates supply shortages or concerns. Contango, where deferred prices are higher, suggests plenty of nearby supplies to satisfy demand or a market is in equilibrium with supply and demand balanced.
This week, we will look at location and quality spreads covering the same commodity’s regional dynamics and different compositions. These spreads shed light on areas of the world where a commodity may trade at a significant differential or where other forms or variations of the same commodity are at premiums or discounts, which could signal price changes.
Location-location-location is the real estate mantra- It applies to commodities too
A location spread reflects the price of the same commodity for delivery in one location or area versus another. The most recent example of substantial location differentials has been in the natural gas market.
The natural gas futures contract on the CME’s NYMEX division reflects the price of the energy commodity for delivery at the Henry Hub in Erath, Louisiana.
The chart shows that in October 2021, the futures reached the highest price since February 2014 when they traded to a high of $6.466 per MMBtu, only 2.7 cents below the 2014 $6.493 high.
Meanwhile, shortages of natural gas in Asia and Europe pushed the energy commodity price over five times higher than the NYMEX futures price. Since natural gas in liquid form travels the world via ocean vessels, the high prices in Asia and Europe have a bullish impact on US prices.
Meanwhile, prices in the US can vary dramatically from the NYMEX Henry Hub price, which is a benchmark. Following the price action in natural gas swaps between one US region and others can provide clues about the energy commodity’s price path.
Commodity production tends to be localized in areas of the world where the earth’s crust contains reserves or the soil and climate support crop growth. Consumption is widespread as people worldwide require essential staples. When local shortages occur, prices can rise to substantial premiums to benchmarks. In glut conditions, they can fall to significant discounts. Monitoring these location differentials in all commodities provides valuable information about supply and demand characteristics.
Different qualities command premiums or discounts
A quality spread is the price differential between one form or composition of a commodity and another in the same raw material. An example is the price differential for one hundred-ounce bars of gold and four hundred-ounce bars of gold. Each COMEX contract calls for 100 ounces of the precious metal, the US standard of trade. The London gold market is a far more active wholesale market, where the standard of trade calls for the four hundred-ounce bars. Price differentials reflect the price and time to process one form of gold into the other. Significant premiums or discounts of either size bars, or different sizes such as kilos bars, one-ounce bars, or others, can tell us about retail or wholesale gold demand.
When we drink a cup of coffee, we rarely think of the origin of the beans that are ground into the caffeinated beverage. Arabica coffee beans trade in the futures market on the Intercontinental Exchange. The Arabica beans tend to be most popular in the US. Starbucks, Dunkin Donuts, and most US establishments offer Arabica coffee to consumers. Brazil is the world’s leading producer of Arabica beans.
Meanwhile, Vietnam is the leading product of Robusta coffee, which is the beans required for espresso coffees. Robusta coffee futures trade on the Intercontinental Exchange in Europe. A weather event in Vietnam or Brazil can cause supply issues for Arabica or Robusta beans, leading to a price change in one or both variations of the soft commodity.
There are many other examples of quality spreads where one form or size of a commodity can experience supply or demand changes that impact the overall price action in the raw materials.
Another part of market structure that can provide valuable clues and makes the pieces of the puzzle form a picture
Location and quality factors can reveal underlying fundamental trends in a commodity. Comparing current levels to historical ones and explaining the changes often leads to an improved understanding of previous price trends and can help predict the future path of least resistance of prices.
Location and quality differentials are parts of a market’s overall structure. Combined with the other structural factors, they can uncover opportunities that improve the odds of success.
---
Use the links below to sign up for the Monday Night Strategy Call this week. You can also access the full article for free using the other link below.
Trading advice given in this communication, if any, is based on information taken from trades and statistical services and other sources that we believe are reliable. The author does not guarantee that such information is accurate or complete and it should not be relied upon as such. Trading advice reflects the author’s good faith judgment at a specific time and is subject to change without notice. There is no guarantee that the advice the author provides will result in profitable trades. There is risk of loss in all futures and options trading. Any investment involves substantial risks, including, but not limited to, pricing volatility, inadequate liquidity, and the potential complete loss of principal. This article does not in any way constitute an offer or solicitation of an offer to buy or sell any investment, security, or commodity discussed herein, or any security in any jurisdiction in which such an offer would be unlawful under the securities laws of such jurisdiction.

Processing Spreads Provide Fundamental CluesSome futures markets offer contracts that are related to others and are processed products of the commodity. Understanding the price relationships, history, and paths of least resistance of the processed product versus the original input can provide valuable insight into supply and demand fundamentals. Moreover, these relationships shed light on other related assets.
Market structures are the pieces of a jigsaw puzzle
Processing spreads are real-time supply and demand barometers
The soybean crush spread
Gasoline and distillate crack spreads
Monitoring corporate profits
There is so much data at our fingertips, but we need to understand how to use and interpret the information. Processing spreads are invaluable tools as they are critical variables for market calculus when forecasting the path of least resistance of prices.
The crude oil and soybean futures markets offer liquid futures contracts in products that can reveal significant trends, warning signs, and calls to action. Anyone who undertakes a home improvement project knows that the job will not go well without the correct tools. Trying to hammer in a nail with a screwdriver is far from optimal. Tightening a bolt with an ax is a disaster. The best tool leads to the optimal result. The processing spread is one of the most critical tools in my investment and trading toolbox.
Market structure are the pieces of a jigsaw puzzle
In the world of commodities, market structure are integral pieces of a puzzle. When put together, they provide clues about the path of least resistance of prices as they reflect and can be real-time indicators of supply and demand fundamentals. A commodity’s market structure includes:
Term structure- Price differentials for nearby versus deferred delivery periods.
Location differentials- Price differentials for delivery of a raw material in different regions.
Quality differentials- Price differentials for differing grades, sizes, or composition of the same commodity.
Substitution spreads- The price comparison of one commodity for another that can serve as a substitute.
Processing spreads- The margin or differential for refining or transforming one commodity into its products.
Together, the various pieces that comprise a market’s structure create a picture that often points to higher or lower price paths.
Processing spreads are real-time supply and demand barometers
The processing spread is one of the valuable tools in an analysts’ toolbox. It tells us if demand for the products is rising or falling.
Consumers often require the processed product instead of the raw commodity. The differential between prices of the input, the commodity, and the output, the product, is a critical fundamental measure. Narrowing processing spreads signal falling demand while widening spreads are a sign that supplies are not keeping pace with requirements. Since futures contracts prices are constantly changing, processing spreads can be volatile. When the commodity and product trade in the futures market, the differentials provide a unique supply and demand perspective for traders and investors. There can be many reasons for price variance in processing spreads. However, comparing them to historical levels can serve as real-time indicators of fundamental forces that determine the underlying commodity’s price direction when exogenous factors are not impacting the overall refining or treatment process.
Many commodities do not offer futures contracts in the products. The soybean and crude oil markets are exceptions.
The soybean crush spread
Soybean futures trade on the CME’s CBOT division. Soybean products, soybean meal, and soybean oil also trade in the futures markets on the CBOT with separate and independent futures contracts. Soybean meal is a critical ingredient in animal feed, while soybean oil is cooking oil. Both have other uses.
Processors crush raw soybeans into the two products; the oil is the liquid from the crushing process, while the meal is the solid substance.
The soybean crush spread can be highly volatile.
The monthly chart shows the soybean crush spread over the past fifteen years. The spread traded to a low of a quarter of one cent to as high as $2.1950. The low was in 2013 when soybean futures were trending lower from the all-time high in 2012 at $17.9475 per bushel. The high was in October 2014 when soybean futures were consolidating at lower levels. The move to the high was because consumers bought soybean products at lower prices around the $10 per bushel level.
More recently, the crush spread signaled that soybean futures had run out of downside steam. After trading to a high of $16.7725 per bushel in May 2021, the oilseed futures fell below $12 in October. When soybeans were on the high in May, the crush fell to a low of 52.75 cents.
At high soybean prices, consumers backed off buying the oilseed products, leading to a price correction that took the price below the $12 per bushel level in October. Meanwhile, falling prices caused demand for products to return. The crush spreads traded to the most recent high at $1.9050 during the week of October 18. The rising crush spread was a sign of robust demand that lifted the raw soybean futures from the recent low.
The November soybean futures chart shows the rise from a low of $11.8450 to the $12.50 level. The price action in the crush spread was a signal that demand for products would lift the soybean futures price. The processing spread action signaled the price bottom over the past weeks.
Gasoline and distillate crack spreads
Crude oil refiners process the raw energy commodity that powers the world into products, gasoline, and distillates. The NYMEX futures market trades contracts in crude oil, gasoline, and heating oil. Heating oil is a distillate fuel that is a proxy for other distillates, including jet and diesel fuels. Refineries process crude oil into the oil products by heating them to different temperatures in a catalytic cracker. The price differential between the input, crude oil, and the output, the products, are “crack spreads.” Rising crack spreads point to increasing demand for oil products. When they fall, it is a sign of oversupply or weak demand.
Crude oil futures reached lows in April 2020 during the height of the global pandemic’s impact on markets across all asset classes.
The NYMEX crude oil futures weekly chart highlights the bullish trend since April 2020 as the energy commodity has made higher lows and higher highs.
The weekly chart of the gasoline crack spreads highlights the bullish trend since March 2020. Gasoline is a seasonal commodity that tends to reach highs during the spring and summer months and decline during the winter as drivers tend to put more mileage on their cars during the warm months. However, at the $17.63 per barrel level at the end of last week, the gasoline crack spread was appreciable higher than the peak in October 2020, when it reached $11.62 per barrel. The gasoline crack spread has provided bullish validation for the path of least resistance of crude oil’s price.
The weekly heating oil or distillate crack spread chart also displays a bullish trend. Distillates tend to be less seasonal than gasoline as jet and diesel requirements are year-round. At the $22.53 per barrel level at the end of last week, the heating oil crack was far higher than its October 2020 peak at $9.96 per barrel.
The crack spreads have supported the rising crude oil price as they point to robust product demand.
Monitoring corporate profits
While processing spreads can provide insight into the path of least resistance of prices for commodities that are inputs, they are also real-time earnings indicators for companies that refine or process the raw commodities into the products.
Refiners or processors tend to buy the input at market prices and sell products at market prices. The refiners and processors make significant capital investments in refineries or other processing equipment. They make or lose money on the processing spread. When they widen, they experience a profit bonanza; when they fall, times can get rough. When the spreads rise above the cost of the process, profits rise. Low processing spread levels can lead to losses.
Valero (VLO) is a company that refines crude oil into oil products.
The chart shows that the high in October 2020 was at $44.88 per share. In October 2021, VLO was over the $80 level at the end of last week. Rising crack spreads have lifted profits for the oil refiner.
Archer Daniel Midland (ADM) and Bunge Ltd. (BG) are leading agricultural processors. Soybean processing is one of the many business lines for the two companies. The rising soybean crush spreads have lifted profits for the companies.
In October 2020, ADM shares reached a high of $52.05 per share. At the end of last week, the stock was at the $66.22 level.
BG shares reached a high of $60.50 in October 2020 and were trading at the $88.33 level at the end of last week. The rise soybean crush spreads at least partially supported rising profits and higher share prices for ADM and BG.
Processing spreads are real-time indicators for the demand of the commodities that are the inputs. They are also real-time earnings barometers for companies that process commodities into products. Any tool that improves your ability to analyze markets is worth keeping in that toolbelt.
---
The full article and spread charts are available using the link below. You can also sign up for the Monday Night Strategy Call below.
Trading advice given in this communication, if any, is based on information taken from trades and statistical services and other sources that we believe are reliable. The author does not guarantee that such information is accurate or complete and it should not be relied upon as such. Trading advice reflects the author’s good faith judgment at a specific time and is subject to change without notice. There is no guarantee that the advice the author provides will result in profitable trades. There is risk of loss in all futures and options trading. Any investment involves substantial risks, including, but not limited to, pricing volatility, inadequate liquidity, and the potential complete loss of principal. This article does not in any way constitute an offer or solicitation of an offer to buy or sell any investment, security, or commodity discussed herein, or any security in any jurisdiction in which such an offer would be unlawful under the securities laws of such jurisdiction.

Crude Oil Spreads: A Quick Intro.Spreads are complex instruments. This is just an introduction and some ideas to get our brains ticking over. I had started writing a guide to understanding these three types of spreads, but it just got a little long. It might be easier to do it this way:
What do you see above?
Here are some observations to get started:
1
All spreads topped out well before June Crude Oil topped out. From about 17th Feb, those spreads stopped gaining. Could spreads be a way to take a contrary position as a trend exhausts itself, and have a little room for error? It certainly is here (although not always the case).
2
Look at the ATR for each. Spreads show lower volatility.
3
Correlations (the CC shows the spread correlation to the underlying June contract). Correlations seem strong during a trend then do their own thing at other times. Change creates opportunity. Constant correlations are not as fun.
4
Basic spreads: bull and bears – are directional. That is, they move closely with the underlying. More complex spreads, like the fly and condor seem to be suited to shifting sentiment along the forward curve.
5
Flies and condors are very similar. The condor tends to have a little more volatility than the fly. In this case, it’s not much.
-
It can be a complex subject, worthy of something closer to a book, than a comment here, but it’s a start.
Just a warning – going down the spread trading path might change everything.
-
A couple of futures markets where flies and condors are often traded: Crude, Natural Gas, Grains, Eurodollars (and most other STIRs). Options - that's a totally different chat....

Winrates required to breakeven relative to stop & target sizesTaking AUDUSD as an example here, the spread is not the smallest relative to ATR nor the largest.
The formula to get a breakeven winrate is 1/(1+reward/risk).
Because we want winrate*reward = loserate*risk <=> winrate*reward = (1-winrate)*risk <=> winrate*reward + winrate*risk = risk (never 0) <=> winrate = 1/(1+reward/risk)
For example with a 20 pip stop, base risk to reward of 1 to 5, and 2 point spread, reward or winners = 98 pips, risk or losers = 22 pips.
So the reward/risk = 98/22 = 4.4545454545... So the breakeven winrate will be 1/5.4545454545 = 18.33%
That is just the breakeven winrate.
Profitability will of course depend on:
- Frequency: How many trades you are able to take
- Winrate: How much higher than the breakeven winrate it is
- Position size: Profitability does not go up the higher it goes
If a strategy or trader only gets a couple of trades a year and his winrate is barely above breakeven, he will not be very profitable, and it will be very easy to lose all profits.
And as the stops & targets in pips go down, the hit rates needed to actually make money go up exponentially up to a point where the trader needs to own a crystal ball and be able to predict the future.
Take costs into consideration with any strategy and before placing any trade.
And 1 other thing to keep in mind is spreads can also fluctuate, depending on the broker, at certain hours they can go up 3 fold, sometimes more, it can really hurt.
A cool thing you may notice is with a stop of 20 pips, the spread/stop = 10% and also the winrate to breakeven is increased by 10% for both risk to rewards.
Same thing with the 5 pips stop. And so on. The required winrate to breakeven increases by 100*(spread/stop)%.
Easy to quickly calculate when you are considering trades.


Call Ratio Spread DebitThe ratio call spread for debit is the same strategy as ratio call spread credit. But now, the upper and lower strike price are farther apart. This change, give different mathematical results as you can see on the chart.
If you didn’t read the previous post, please do.
In the chart we see a ratio spread of 2:1, in this case, the options that were sold are now worth less than the call that was bought. So this position is now with debit.
Inputs: MA (Mastercard)
Debit paid -> 3.8 (-$380 for one position)
Stock price -> 338
Upper strike -> 350 , 2 calls sold
Lower strike -> 330 , 1 call bought
Days to expire -> 36
Implied Volatility -> 0.309 (30.9%)
Date -> 12/11/2020
The Debit paid is $380, the maximum profit is $1620 with less than 1% probability, the maximum loss is theoretically unlimited.
In this example, one call was bought at 330 strike price for 12.7 and two calls were sold at 350 strike price for 4.45 each, in total 8.9.
The debit = 8.9-12.7 = (-3.8)
If at expiration the stock price will be below the lower strike (330), all of the options will be worthless and the loss will be only (-$380).
Maximum profit = Difference between strike – debit paid = 350-330 – 3.8 = 16.2
This position is neutral.
At the expiration:
Between 333.8 to 366.2 the position will be with a profit. $0 - $1620
Under 330.17 the position will lose (-$380) no matter what price.
Above 369.80 the risk is getting bigger.

Call Ratio Spread CreditA ratio call spread is a neutral strategy in which we buy several calls at a lower strike and sells more calls at a higher strike. In a ratio call spread with credit, there is no downside risk. The ratio spread that we see on the chart has a ratio of 2:1.
We can see from the chart the non-linear behavior of options.
Inputs: MA (Mastercard)
Credit received -> 3.1 ($310 for one position)
Stock price -> 332
Upper strike -> 340 , 2 calls sold
Lower strike -> 330 , 1 call bought
Days to expire -> 37
Implied Volatility -> 0.291 (29.1%)
Date -> 11/11/2020
The credit received is $310, the maximum profit is $1310 with less than 1% probability, the maximum loss is theoretically unlimited.
In this example, one call was bought at 330 strike price for 14.2 and two calls were sold at 340 strike price for 8.65 each, in total 17.3.
The credit = 17.3-14.2 = 3.1
If at expiration the stock price will be below the lower strike (330), all of the options will be worthless and all the credit will be received.
The maximum profit at expiration for a ratio spread occurs if the stock is exactly at the striking price of the sold options. The reason is that the call that was bought has some profit (stock price above strike price) and the sold options are worthless.
Maximum profit = The spread (340-330=10) + Credit received (17.3) – Debit paid (14.2) = 13.1 => $1310 (mulitpling by 100 shers per option contract)
The risk in this position is to the upside. The calculation for the break-even at expiration.
Break-even point = Upper strike price + the points of max profit = 340+13.1=353.1
This strategy has a high probability in general and even more so when used correctly.
The example that has been used could profit the most in the blue zone, where the profit is greater than 50% of the maximum profit, but it will take 34 days out of 37 to reach there.
How implied volatility affect this position?
In a ratio spread, there are more options sold than bought, in the previous posts we saw that volatility increase is harming sold options and benefits bought options, this example is no different.
10% increase in implied volatility, the lines are now in a worse location compare to the original position.
10% decrease in implied volatility, the lines are now in a better location compare to the original position. The position can now reach the 50% max profit zone in 30 days.
The next post will be on ratio spread debit, that looks different from the ratio spread credit, the solution to the partial differential equations of the Black-Scholes model can be seen.

NZDUSD Aloha, welcome to the new week!
Wanted to share a tip that has helped me save money and kept my psychology sane:
Let the market develop for the first few hours before placing a trade. Reason being is spreads are usually steep and the market can be volatile and choppy.
NZDUSD was on my watch at the end of last week and my last analysis shows that I would be going long on this trade, however, applying a the rule of "let the market decide in the first 4-5 hours", minimum, has saved me from a quick loss of -1% on this trade and countless others trades.
I like the 15min wedge for a continuation, the 50ema on 4hr, 1hr, and 15min all support my thoughs of going long. However, The daily is stil developing to either break above the 50 or reject it and have a
crash.
Any way, hope this in your trading journey!
Stay patient and wait for your strategy to play out, no need to rush it! Mahalo for reading, happy trading all!

Bitcoin: a gauge for asian risk toleranceSpread between Chinese and JGB's appears follow Bitcoin (usd) pretty well. As expected: bitcoin is the exact opposite of a portfolio hedge, and just a call option (like Tom Lee has made the case for) for growth. Interestingly enough, falling rates appear to stimulate selling and rising rates entice buying.
