“Cut Your Losses, Let Your Profits Run.” Fine, But How Exactly?We’ve all heard it. It’s right up there with “buy low, sell high” in the Hall of Fame of obvious trading advice. Everyone agrees with it. Few people do it.
Why? Because cutting losses hurts. Letting profits run is scary (especially in the current macro ). And both go directly against how human brains are wired.
Still, that simple phrase sits at the core of nearly every profitable trading career ever built. So let’s talk about how traders actually do that in the real world.
🧠 Why Your Brain Hates This Rule
Your brain evolved to avoid the bad stuff and lock in the good stuff. Trading puts that wiring to the test.
When a trade is losing, your instinct is to wait — maybe it’ll bounce. So you avoid facing the bad consequences of your decision. It ain’t a loss unless you sell, right?
When a trade is winning, your instinct is to grab the money before it disappears. That’s called loss aversion, and it’s why so many traders end up with small wins and large losses. Revenge trading usually follows.
The goal here is simple: Make the average win bigger than the average loss. Or, even better, have one big winner that can take care of several small-size losses.
📉 Cutting Losses: Think in Probabilities
Cutting losses doesn’t mean being right less — it means being wrong cheaply. “It's not whether you're right or wrong, but how much money you make when you're right and how much you lose when you're wrong.”
Professional traders assume they will be wrong a lot. They build that expectation into their process and risk profile. When a trade moves against them beyond what they originally planned for, they step aside without drama.
“If you have a losing position that is making you uncomfortable, the solution is very simple: Get out, because you can always get back in.”
A small loss is just a data point. A big loss changes behavior.
The traders who make it treat exits like boring administrative work. Just a clean “this didn’t work, let’s see what’s next.”
📈 Letting Profits Run: The Harder Half
Cutting losses is uncomfortable — but letting profits run is even harder.
When a trade goes your way, your mind immediately starts calculating what you could buy with the gains or how much you’re up just for the day. The idea of losing those profits feels worse than the pain of an initial loss. So traders exit too early, again and again.
The result? They get paid for being right, but not enough to cover when they’re wrong.
Letting profits run means allowing the market to do the work. It means resisting the urge to micromanage every tick. It means giving strong trends time to show themselves.
🧮 The Math That Makes This Work
This rule isn’t philosophical — it’s mathematical (it’s fairly simple, though).
Imagine a trader wins half their trades. If their losses average 1 unit and their wins average 2 units, they’re profitable over time.
But flip it — small wins, large losses — and even being right 60% of the time won’t save you.
Cutting losses protects the downside. Letting profits run expands the upside. Together, they tilt probability in your favor, especially if you’re chasing asymmetrical bets .
That’s the whole game. One good trend pays for ten small losses and the equity curve starts to make some sense.
🧭 The Trader’s Secret Weapon: Risk Profile
The traders who follow this rule best don’t rely on willpower. They rely on a solid risk profile.
They decide in advance:
• How much they’re willing to lose
• Under what conditions they exit
• What signals a trade is still working
By making these decisions before emotions get involved, they remove most of the internal debate when it matters most, especially during high-impact economic data releases .
Trading becomes less about being brave and more about being prepared. In short, the whole thing about cutting your losses and letting your profits run is about embracing small losses without ego and allowing big wins without fear.
Off to you : How do you deal with your losses and wins? Share your approach in the comments!
Trend Analysis

XAUUSD Crash – Everything You Need To KnowDuring periods of extreme market volatility, there is no word that shocks traders more than CRASH. With gold (XAUUSD), every time rumors of a crash appear, the community splits into two camps: panic sellers and aggressive bottom-catchers. But the truth is this: most traders lose money not because gold crashes, but because they don’t understand the nature of a crash .
This article will help you understand XAUUSD crashes clearly, fully, and realistically—so you don’t become a victim of emotions.
1️⃣ What Is an XAUUSD Crash? (Understanding It Correctly)
An XAUUSD crash is not simply a strong price drop .
A true crash usually has three characteristics:
- Price drops very fast in a short period of time
- Large volatility, breaking multiple key support levels
- Liquidity explodes → many orders are wiped out simultaneously
Most importantly:
👉 A crash usually happens when the market is already imbalanced beforehand , not randomly.
2️⃣ Why Can Gold Crash? (Core Reasons)
No crash happens “out of nowhere.” With XAUUSD, crashes typically come from a combination of three factors :
🔹 1. Strong and Unexpected News
- The FED suddenly turns hawkish
- U.S. economic data comes in far better than expected
- Bond yields and the USD surge rapidly
➡️ Safe-haven capital flows out of gold in a very short time .
🔹 2. The Market Was Overheated Beforehand
- Price keeps printing new highs
- Retail traders FOMO into buy trades
- BUY stop losses are densely stacked below
➡️ One trigger is enough → a domino sell-off.
🔹 3. Liquidity Hunt
- Price breaks support without a pullback
- BUY stop losses are triggered in bulk
- Market makers “collect liquidity” within minutes
3️⃣ Does a Crash Mean a Long-Term Trend Reversal?
👉 In most cases, NO .
Many XAUUSD crashes are actually:
- Deep corrections within an uptrend
- Emotional flushes to clean the market
- A position reset before the next move
Common mistake:
Seeing a sharp drop → concluding “the trend is broken”
Reality:
A trend only breaks when major structure is destroyed and fails to be defended
4️⃣ Where Do Traders Usually Go Wrong During an XAUUSD Crash?
Here are four mistakes I see repeatedly:
❌ Chasing SELLs after price has already moved far
❌ Blindly catching bottoms without clear price zones
❌ Holding BUYs because “gold is a safe-haven asset”
❌ Failing to reduce position size when volatility spikes
A crash doesn’t kill unskilled traders,
👉 it kills undisciplined traders .
5️⃣ What Should You Do When XAUUSD Starts to Crash? (The Right Mindset)
Instead of asking: “Should I SELL now?”
Ask yourself:
- Is price breaking structure or just hunting liquidity?
- Where is the next major support zone?
- Is selling pressure still strong, or has distribution ended?
In many situations:
👉 Not trading is the best trading decision .
Long-term survivors are not those who catch perfect tops or bottoms,
but those who know when to stay out of the market .

HOW TO AVOID LOSSES IN THE XAUUSD MARKET1️⃣ Where XAUUSD Losses Really Come From
From my experience, losses in XAUUSD don’t come from gold itself — they come from the trader.
Most losses happen because of:
- Entering trades without a clear plan
- Making emotional decisions during volatile moves
- Ignoring proper risk management
Gold moves fast. If I make even a small mistake, the market will amplify it immediately.
2️⃣ Why Most Traders Lose Money Trading Gold
I’ve seen many traders struggle with XAUUSD for three main reasons:
- They don’t fully understand market structure and liquidity
- They become overconfident because gold “moves well”
- They refuse to accept stop-losses
Many traders tell themselves: “Gold will reverse soon.”
In reality, gold can keep running much longer than an account can survive.
3️⃣ My Core Rules to Avoid Losses in XAUUSD
These are the rules I strictly follow to stay consistent:
- I trade in the direction of the dominant trend
- I only enter at pre-defined key levels
- Risk management comes first — profit comes second
I keep my risk per trade small and controlled
No setup is ever worth risking my entire account.
4️⃣ Mistakes I Avoid When Trading Gold
❌ Chasing price during impulsive moves
❌ Holding losing trades during high-impact news
❌ Overtrading when liquidity is low
❌ Trading without a clear execution plan
These mistakes might not destroy an account instantly,
but they destroy consistency over time.
5️⃣ My Mindset When Trading XAUUSD
I treat gold trading as a game of probability, not prediction.
- Being wrong is part of the process
- Protecting capital is always my priority
- My goal is not to win every trade,
but to lose as little as possible when I’m wrong
📌 If this post helps you, feel free to leave a comment or follow for more gold trading insights.

Seasonality is context, not a strategySeasonality is often misunderstood.
On its own, it is not a trading strategy.
It does not provide entries, exits, or risk management.
What it does provide is context.
Over long samples, certain periods show a higher tendency
for trends to persist, while others tend to be more erratic or corrective.
That does not mean price must move in a specific direction.
It simply means the environment changes.
For system traders, this distinction matters.
A rules-based strategy should always come first.
Entries, exits, and risk management must stand on their own.
Seasonality should never be used to justify trades
that are otherwise invalid.
Where seasonality becomes useful is as confluence.
When a trend-following system is already active,
it can help answer secondary questions:
• Should risk be reduced or allowed to express fully?
• Is this an environment where trends historically expand?
• Or one where patience and smaller size makes more sense?
In that sense, seasonality informs position sizing
and expectations — not signal generation.
The chart above shows how BTC can behave very differently
depending on the time of year.
Some periods favor sustained moves.
Others punish impatience.
A robust system should survive all of them.
Seasonality simply helps frame the environment you are operating in.
For this type of analysis, I personally like using
TradingView’s built-in seasonality indicator.
Not because it provides signals,
but because it offers a clear, long-term statistical reference.
Used this way, it adds context
without interfering with the actual rules of a trading system.

Hassett vs. Warsh: Who Is More Favorable to Risk Assets?Who will be the next Chair of the Federal Reserve, and which of the two leading candidates is more favorable to risk assets in financial markets? President Trump is expected to appoint the next Fed Chair this January. This individual will act as a shadow Fed Chair until the end of Jerome Powell’s term in May.
Let us examine several key factors:
• Their stance on the inflation/employment trade-off
• Their stance toward equity markets
• Their stance toward the cryptocurrency market
• Their known relationship with President Trump
In the matchup between Kevin Hassett and Kevin Warsh, one conclusion is clear when viewed from the perspective of risk assets (equities, cryptocurrencies, growth assets): Kevin Hassett is by far the more favorable profile. The differences between the two men are not a matter of technical nuance, but of fundamentally opposing economic philosophies.
Kevin Hassett positions himself primarily as an economist focused on growth and employment. His interpretation of monetary policy prioritizes economic expansion, activity, and support for demand, even if this implies a higher tolerance for inflation. This approach mechanically translates into a preference for lower interest rates, accommodative monetary policy, and abundant liquidity within the financial system. Historically, these are precisely the conditions that fuel equity markets—particularly growth stocks—as well as alternative and speculative assets, including cryptocurrencies.
By contrast, Kevin Warsh embodies a vision strictly centered on price stability. His approach emphasizes monetary discipline, the fight against inflation, and the normalization of unconventional policies. Such an orientation implies tighter financial conditions, less conducive to valuation excesses and speculative cycles. In this framework, risk assets do not benefit from strong structural support and are more exposed to phases of consolidation or correction.
The link with equity markets is therefore unambiguous. Hassett supports an environment in which valuation multiples can expand and risk-taking is encouraged by a low cost of capital. Warsh, on the other hand, favors a framework in which markets must adjust to stricter fundamentals, mechanically limiting market euphoria.
Regarding cryptocurrencies, the divergence is even more pronounced. Crypto assets thrive in cycles of abundant liquidity and accommodative monetary policy. Hassett’s stance—perceived as open to this ecosystem and supportive of expansive financial conditions—is clearly aligned with a bullish dynamic for digital assets. Warsh, more wary of the excesses associated with loose policy, represents an environment that is far less supportive for this type of asset.
Finally, the close relationship between Hassett and Donald Trump, whose economic doctrine is built around growth, market stimulation, and the performance of financial assets, reinforces this interpretation. Hassett appears as the natural extension of a market- and risk-friendly policy stance.
Conclusion: unequivocally, Kevin Hassett is the candidate most favorable to risk assets, both through his macroeconomic vision and through its direct implications for equities and cryptocurrencies.
DISCLAIMER:
This content is intended for individuals who are familiar with financial markets and instruments and is for information purposes only. The presented idea (including market commentary, market data and observations) is not a work product of any research department of Swissquote or its affiliates. This material is intended to highlight market action and does not constitute investment, legal or tax advice. If you are a retail investor or lack experience in trading complex financial products, it is advisable to seek professional advice from licensed advisor before making any financial decisions.
This content is not intended to manipulate the market or encourage any specific financial behavior.
Swissquote makes no representation or warranty as to the quality, completeness, accuracy, comprehensiveness or non-infringement of such content. The views expressed are those of the consultant and are provided for educational purposes only. Any information provided relating to a product or market should not be construed as recommending an investment strategy or transaction. Past performance is not a guarantee of future results.
Swissquote and its employees and representatives shall in no event be held liable for any damages or losses arising directly or indirectly from decisions made on the basis of this content.
The use of any third-party brands or trademarks is for information only and does not imply endorsement by Swissquote, or that the trademark owner has authorised Swissquote to promote its products or services.
Swissquote is the marketing brand for the activities of Swissquote Bank Ltd (Switzerland) regulated by FINMA, Swissquote Capital Markets Limited regulated by CySEC (Cyprus), Swissquote Bank Europe SA (Luxembourg) regulated by the CSSF, Swissquote Ltd (UK) regulated by the FCA, Swissquote Financial Services (Malta) Ltd regulated by the Malta Financial Services Authority, Swissquote MEA Ltd. (UAE) regulated by the Dubai Financial Services Authority, Swissquote Pte Ltd (Singapore) regulated by the Monetary Authority of Singapore, Swissquote Asia Limited (Hong Kong) licensed by the Hong Kong Securities and Futures Commission (SFC) and Swissquote South Africa (Pty) Ltd supervised by the FSCA.
Products and services of Swissquote are only intended for those permitted to receive them under local law.
All investments carry a degree of risk. The risk of loss in trading or holding financial instruments can be substantial. The value of financial instruments, including but not limited to stocks, bonds, cryptocurrencies, and other assets, can fluctuate both upwards and downwards. There is a significant risk of financial loss when buying, selling, holding, staking, or investing in these instruments. SQBE makes no recommendations regarding any specific investment, transaction, or the use of any particular investment strategy.
CFDs are complex instruments and come with a high risk of losing money rapidly due to leverage. The vast majority of retail client accounts suffer capital losses when trading in CFDs. You should consider whether you understand how CFDs work and whether you can afford to take the high risk of losing your money.
Digital Assets are unregulated in most countries and consumer protection rules may not apply. As highly volatile speculative investments, Digital Assets are not suitable for investors without a high-risk tolerance. Make sure you understand each Digital Asset before you trade.
Cryptocurrencies are not considered legal tender in some jurisdictions and are subject to regulatory uncertainties.
The use of Internet-based systems can involve high risks, including, but not limited to, fraud, cyber-attacks, network and communication failures, as well as identity theft and phishing attacks related to crypto-assets.

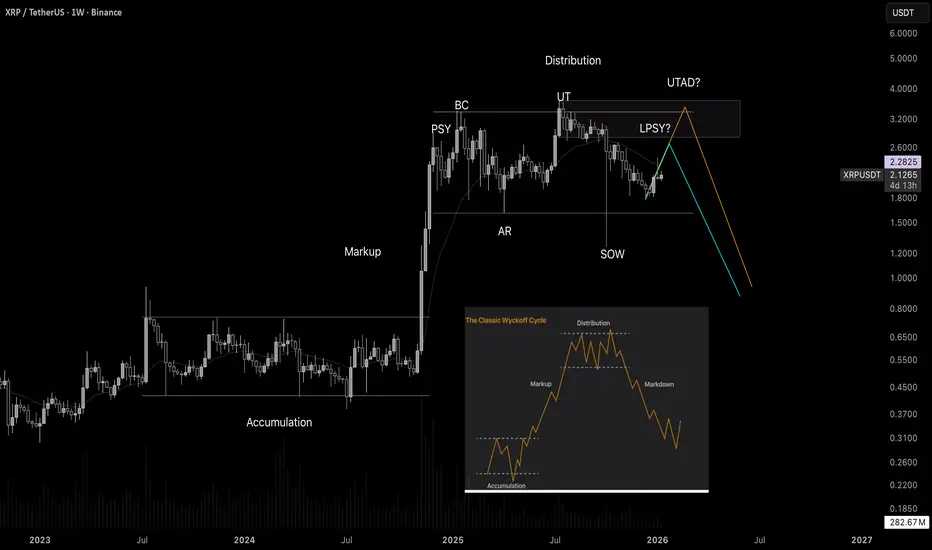
The XRP chart is like from a textbook! Wyckoff tutorialWelcome! When finance professionals are watching, you can expect solid analytics and real education.
Today we’re going to break down Wyckoff market cycles using the XRP chart in real time.
Wyckoff cycles are not just theory - they are an established concept that works in all markets. This is a model of price behavior based on the actions of large players ("smart money"). It shows how professionals accumulate positions, drive the market, and distribute assets, creating repeating phases of growth and decline.
Any market moves cyclically. Wyckoff identified two major cycles:
Bull market cycle (Accumulation → Markup → Distribution → Markdown)
Bear market cycle (the mirror reflection of the first)
Each cycle consists of four phases:
-Accumulation
-Markup (Growth)
-Distributio
-Markdown (Decline)
Phase 1. Accumulation
This is the phase when "smart money" buys the asset in large volumes while trying not to push the price too high. Conditions are created where regular market participants do not want to buy the asset, and may even sell it near market lows. Usually during this period there is bad news, lack of confidence, etc. Large players quietly buy up all this negativity.
Phase 2. Markup (Growth)
An impulsive upward movement begins - a trend that everyone notices when it is already too late. The crowd starts to wake up and enters the market at high prices.
Phase 3. Distribution
The price again enters a trading range, but now major participants sell their positions to retail traders who come in euphoric after the rise. Usually, the news is excellent here, everyone expects further growth, there is general euphoria, people load into the asset to the maximum while large players quietly unload their positions.
Phase 4. Markdown (Decline)
Professionals have sold everything they wanted, and now the market goes down almost without resistance. Retail - back to the factory.
Elliot Waves Strategy ExplainedElliott Wave theory is not a forecasting tool. The moment it’s used that way, it becomes useless. It does not tell you where price will go. It describes how participation unfolds once direction is already present.
At its simplest, markets alternate between expansion and digestion. Impulse waves show commitment and follow-through. Corrective waves show hesitation, overlap, and redistribution. Everything else traders add on top is interpretation, not edge.
Most traders fail with Elliott Waves because they try to label the market instead of read it. Wave counts are adjusted after every pullback to protect bias. When a count needs defending, it has already lost its value for execution.
Wave completion does not mean reversal. Strong trends extend, truncate, or move into complex corrections without ever giving clean countertrend entries. Acting on a “finished” wave without a structural break is just early positioning dressed up as analysis.
The subjectivity of Elliott Waves is the warning label. If two valid counts exist, neither can justify risk on its own. Structure, location, and participation come first. The wave count only adds context to what price is already showing.
Used correctly, Elliott Waves help with expectations and trade management. They stop traders from chasing late impulses and from exiting too early during normal corrections. Used incorrectly, they create the illusion of control over an uncertain market.
Elliott Waves don’t give certainty. They give restraint. And restraint is far more valuable.

How to Trade Smart Money Concepts SMC with Top-Down Analysis
Today, I will show you how to trade SMC with Top-Down Analysis.
You will learn how to combine liquidity, structure mapping, mitigation and breaker blocks on different time frames for spotting accurate entries in Gold and Forex.
In this strategy, we will use 2 time frames: daily time frame and 4H.
To understand how to use them step by step, let's start with studying 2 price models.
Always start your analysis with a daily time frame.
You will need to identify liquidity supply and demand zones there.
After you see a test of a supply zone on a daily time frame, start analyzing a 4H time frame.
On a 4H, you will need to do structure mapping and make sure that the market is in an intraday bullish trend.
In this bullish trend, you will need to identify Order Block zone.
It will a liquidity demand zone based on the last Higher Low.
Your signal to sell will be its breakout and a 4H candle close below.
Depending on the price action, set your sell limit order on the broken order block zone (it will be either a breaker or mitigation block).
Your stop loss should be above the last Higher High and your take profit should be the next demand zone on a 4H.
Here is the example of such a price model on EURUSD.
The price reached a significant daily supply zone.
After its test, the price dropped, breaking a bullish order block zone.
Selling on its retest (entry was the lowest candle close within a broken OB zone), stop loss was above the highs and tp - the closest 4H demand zone.
Now, let's study the second price model.
If you see a test of a supply zone on a daily time frame, start analyzing a 4H time frame .
On a 4H, you will need to do structure mapping and make sure that the market is in an intraday bearish trend.
In this down trend, you will need to identify Order Block zone.
It will a liquidity supply zone based on the last Lower High.
Your signal to buy will be its breakout and a 4H candle close above.
Depending on a price action, set your buy limit order on the broken order block zone (it will be either a breaker or mitigation block).
Your stop loss should be below the last Lower Low and your take profit should be the next supply zone on a 4H.
Examine the following setup on EURNZD.
We see a test of a significant daily demand cluster.
The pair is bearish on a 4H time frame.
Our signal to buy will be a bullish breakout of an Order Block zone and a 4H candle close above that.
We will set a buy limit on its retest then (entry level will be the highest candle 4H close with OB zone).
TP will be the next 4H supply zone and SL will lie below LL.
2 simple price models that we studied in this video will help you to effectively trade liquidity supply and demand zones.
A combination of 2 time frames, basic structure mapping and change of character will provide an accurate entry signal for your trades.
❤️Please, support my work with like, thank you!❤️
I am part of Trade Nation's Influencer program and receive a monthly fee for using their TradingView charts in my analysis.

Options Blueprint Series [Intermediate]: Breakout With A Buffer1. Market Context: Strength at the Surface, Fragility Underneath
The NASDAQ-100 futures market currently occupies a rare and structurally important zone. Price is trading above a prior all-time high, yet remains below the most recent all-time high, with only a relatively modest distance separating current price from historical extremes.
From a purely technical standpoint, this positioning can be interpreted as constructive. Markets that hold above former highs often retain the potential to transition into renewed expansion and price discovery. However, context matters. This strength exists alongside broader signals of vulnerability across U.S. equity markets—signals that have been explored in prior work and that suggest upside continuation is not guaranteed.
This creates a dual-risk environment:
Upside risk: missing participation if the NASDAQ resumes trending higher.
Downside risk: absorbing full exposure if price fails near historical extremes.
In such conditions, directional certainty is low, but volatility risk is high. This is where outright futures exposure may be less efficient, and where options structures can offer a more robust framework.
2. The Problem With Linear Exposure at Elevated Levels
Holding NASDAQ-100 futures outright implies linear exposure:
Every point higher benefits the position.
Every point lower damages it.
Near historical highs, that symmetry becomes problematic. A trader must be correct not only on direction, but also on timing. Even a structurally bullish thesis can fail if volatility expands or if price retraces before resuming higher.
Linear exposure forces a binary outcome:
Be early and absorb drawdowns.
Be late and miss opportunity.
The goal of this blueprint is to avoid that binary trap by reshaping exposure, not eliminating it.
3. Why Options Are Better Suited for This Environment
Options allow traders to separate direction from risk. Rather than committing capital to a single path, options structures can be designed to:
Define maximum loss in advance
Shift break-even points away from current price
Allow time and volatility to work in favor of the position
Importantly, this blueprint does not rely on forecasting. It assumes uncertainty and builds around it.
The objective is not to predict whether the NASDAQ will break higher or fail lower. The objective is to remain functional across multiple outcomes.
4. Instruments Used: NQ and MNQ Options
This structure applies to:
NASDAQ-100 E-mini futures options (NQ)
NASDAQ-100 Micro E-mini futures options (MNQ)
The logic is identical across both contracts. The difference lies in scale:
NQ offers larger notional exposure and fewer contracts.
MNQ allows finer position sizing, particularly useful when structuring multi-leg options strategies.
Both instruments support the same conceptual framework.
5. Introducing the “Breakout With A Buffer” Concept
The core idea behind this blueprint is simple:
Do not chase price near highs
Do not stand aside entirely
Create a buffer below price while retaining upside access
This is achieved by combining:
A bull put spread placed well below current price
A long call positioned above current price
Together, these components transform uncertainty into a structured payoff.
6. Strategy Construction: Step by Step
The structure consists of three legs:
Short put at approximately 22,000
Long put at approximately 21,000
Long call at approximately 28,750
The bull put spread generates a net credit. That credit is then used to fund the long call.
This matters. Rather than paying outright for upside exposure, the structure monetizes downside stability to finance it.
7. Why a Bull Put Spread and Not a Naked Put
Selling naked puts would introduce undefined downside risk, which contradicts the purpose of this blueprint.
The long put:
Caps downside exposure
Converts the position into a defined-risk structure
Clarifies the maximum loss from the outset
This is not about maximizing credit. It is about controlling tail risk.
8. Strike Selection: Structural, Not Arbitrary
The selected put strikes align with:
The prior all-time high region
A visible concentration of UFOs (UnFilled Orders) acting as structural support
UnFilled Orders represent areas where institutional activity previously absorbed selling pressure. Positioning the put spread near such zones introduces a structural buffer, rather than relying on random distance.
The call strike, by contrast, is intentionally placed far above current price. This avoids overpaying for near-term momentum and instead positions for a regime where price transitions into sustained expansion.
9. Why This Is Not a Collar or a Covered Strategy
It is important to distinguish this blueprint from more common approaches:
Collars require long underlying exposure.
Covered calls cap upside and remain fully exposed to downside.
Outright calls depend heavily on timing and volatility expansion.
This structure does none of those things. It:
Does not require owning futures
Does not cap upside
Does not rely on immediate directional movement
Instead, it converts time and uncertainty into functional components of the trade.
10. Risk Profile: Defined, Asymmetric, Intentional
The resulting payoff has several key characteristics:
Maximum risk is limited to the width of the put spread (approximately 1,000 NASDAQ points), adjusted for net credit.
Break-even is pushed far below current price, near the 22,000 area.
Moderate upside benefits from both time decay on the put spread and directional exposure through the call.
Strong upside allows the long call to dominate the payoff.
This asymmetry is intentional. The structure sacrifices linear gains in exchange for survivability.
11. Scenario Analysis
At the time of constructing this case study, NASDAQ-100 futures trade near 25,900.
Possible outcomes:
Gradual advance: The put spread decays, the call gains sensitivity.
Strong breakout: The call drives returns.
Sideways consolidation: Time decay works in favor of the structure.
Moderate decline: The buffer absorbs volatility.
Deep decline below support: The defined maximum loss is realized.
Every outcome is known in advance. That clarity is the edge.
12. Volatility Considerations
This structure is volatility-aware:
Short puts benefit from volatility contraction.
Long calls benefit from volatility expansion during upside moves.
Rather than betting on volatility direction, the structure balances exposure across regimes.
13. NQ vs MNQ Implementation
For NQ:
Fewer contracts
Larger notional exposure
Greater margin efficiency per leg
For MNQ:
More granular sizing
Easier scaling
Reduced psychological pressure per contract
The strategy logic remains unchanged.
14. Contract Specifications
NQ Tick size: 0.25 points = $5
MNQ Tick size: 0.25 points = $0.50
Options multipliers mirror the futures contracts. Margin requirements vary by broker and volatility regime, currently:
NQ margin requirement = $33,500 per contract
MNQ margin requirement = $3,350 per contract
15. Risk Management Is the Strategy
Defined risk does not remove responsibility. This blueprint requires:
Proper sizing
Acceptance of worst-case outcomes
Discipline in structure selection
Options do not eliminate uncertainty. They make it visible.
16. Key Takeaways
Elevated markets demand adaptive exposure.
Options allow participation without blind commitment.
The Breakout With A Buffer blueprint prioritizes risk clarity first, opportunity second.
This framework is reusable whenever markets hover near historical extremes amid conflicting signals.
Data Consideration
When charting futures, the data provided could be delayed. Traders working with the ticker symbols discussed in this idea may prefer to use CME Group real-time data plan on TradingView: www.tradingview.com - This consideration is particularly important for shorter-term traders, whereas it may be less critical for those focused on longer-term trading strategies.
General Disclaimer
The trade ideas presented herein are solely for illustrative purposes forming a part of a case study intended to demonstrate key principles in risk management within the context of the specific market scenarios discussed. These ideas are not to be interpreted as investment recommendations or financial advice. They do not endorse or promote any specific trading strategies, financial products, or services. The information provided is based on data believed to be reliable; however, its accuracy or completeness cannot be guaranteed. Trading in financial markets involves risks, including the potential loss of principal. Each individual should conduct their own research and consult with professional financial advisors before making any investment decisions. The author or publisher of this content bears no responsibility for any actions taken based on the information provided or for any resultant financial or other losses.

Drawdown Psychology: How to Survive When Everything Goes WrongEvery Trader Will Face Drawdowns. Most Won't Survive Them Psychologically.
You've been trading well. Account is growing. Confidence is high.
Then it starts. One loss. Then another. Then a streak.
Suddenly you're down 15%. Then 20%. The strategy that was working isn't anymore.
This is the moment that defines your trading career. Not the wins - the drawdowns.
What Is a Drawdown?
Definition:
A drawdown is the decline from a peak in your account equity to a subsequent low.
Calculation:
Drawdown % = (Peak - Trough) / Peak × 100
Example:
Account peaks at $100,000
Falls to $80,000
Drawdown = ($100,000 - $80,000) / $100,000 = 20%
Key Insight:
Drawdowns are inevitable. Every strategy, every trader, every fund experiences them.
The Psychology of Drawdowns
Stage 1: Denial
"This is just a normal losing streak. It'll turn around."
Behavior: Continue trading normally, maybe even increase size to "make it back."
Stage 2: Frustration
"Why isn't this working? What's wrong with the market?"
Behavior: Start questioning strategy, looking for external blame.
Stage 3: Desperation
"I need to make this back. I'll try something different."
Behavior: Abandon strategy, chase trades, increase risk.
Stage 4: Capitulation
"I can't do this anymore. Trading doesn't work."
Behavior: Stop trading entirely, often at the worst possible time.
Stage 5: Recovery (If You Survive)
"I understand what happened. I can rebuild."
Behavior: Return to process, reduced size, systematic approach.
The Math of Recovery
The Brutal Truth:
10% drawdown → Need 11% to recover
20% drawdown → Need 25% to recover
30% drawdown → Need 43% to recover
40% drawdown → Need 67% to recover
50% drawdown → Need 100% to recover
60% drawdown → Need 150% to recover
70% drawdown → Need 233% to recover
80% drawdown → Need 400% to recover
90% drawdown → Need 900% to recover
The Implication:
Large drawdowns are nearly impossible to recover from.
A 50% drawdown requires 100% gain just to break even.
This is why drawdown management is more important than profit maximization.
Drawdown Survival Framework
Rule 1: Expect Drawdowns
Before you start trading, know:
What is the maximum historical drawdown of your strategy?
What drawdown can you psychologically handle?
What drawdown would make you stop trading?
If your strategy's expected max drawdown exceeds what you can handle, reduce size until it doesn't.
Rule 2: Pre-Define Your Response
Write down BEFORE drawdowns happen:
At 10% drawdown, I will: ___________
At 20% drawdown, I will: ___________
At 30% drawdown, I will: ___________
Example responses:
Reduce position size by 25%
Take a 1-week break
Review all trades for pattern
Consult accountability partner
Rule 3: Separate Process from Outcome
During drawdowns, ask:
Am I following my rules?
Is my execution correct?
Is this normal variance or something broken?
If process is correct, the drawdown is just variance. Stay the course.
If process is broken, fix the process - not by chasing.
Rule 4: Reduce Size, Don't Increase
The instinct during drawdowns: "I need to make it back, so I'll size up."
This is the path to ruin.
The correct response: Reduce size during drawdowns.
Smaller losses = slower bleeding
Less emotional pressure
More time to assess and adjust
Rule 5: Take Breaks
Continuous trading during drawdowns leads to:
Emotional exhaustion
Revenge trading
Poor decision making
Scheduled breaks allow:
Emotional reset
Objective review
Fresh perspective
AI-Assisted Drawdown Management
1. Automatic Size Reduction
AI reduces position sizes when drawdown thresholds are hit.
10% drawdown → 75% normal size
20% drawdown → 50% normal size
30% drawdown → 25% normal size or pause
2. Strategy Performance Monitoring
AI tracks whether drawdown is:
Within historical norms
Exceeding expected parameters
Showing signs of strategy breakdown
3. Emotional State Detection
AI monitors trading behavior for signs of tilt:
Increased trade frequency
Larger position sizes
Deviation from rules
4. Automated Circuit Breakers
AI enforces:
Daily loss limits
Weekly loss limits
Mandatory cooling-off periods
Drawdown Mistakes
Increasing Size to Recover - "I need to make it back faster." Result: Larger losses, deeper drawdown, potential ruin. Reduce size during drawdowns, not increase.
Abandoning Strategy Mid-Drawdown - "This strategy doesn't work anymore." Result: Switch to new strategy at worst time, miss recovery. Evaluate strategy on full cycle, not during drawdown.
Revenge Trading - "I'll show the market." Result: Emotional trades, poor decisions, deeper losses. Take breaks, follow rules, reduce size.
Hiding from the Numbers - "I don't want to look at my account." Result: No awareness, no adjustment, continued bleeding. Face the numbers, but with a plan.
Comparing to Others - "Everyone else is making money." Result: FOMO, strategy hopping, emotional decisions. Focus on your process, not others' results.
Drawdown Recovery Protocol
Phase 1: Stabilize (Immediate)
Reduce position sizes by 50%
Take 2-3 day break from trading
Review recent trades objectively
Phase 2: Assess (Week 1)
Is drawdown within historical norms?
Are you following your rules?
Is the strategy still valid?
Phase 3: Adjust (Week 2)
If process issue: Fix the process
If market issue: Adapt or wait
If strategy issue: Consider modifications
Phase 4: Rebuild (Ongoing)
Gradually increase size as performance improves
Don't rush back to full size
Celebrate process adherence, not just profits
Drawdown Checklist
During any drawdown:
Is this drawdown within expected parameters?
Am I following my trading rules?
Have I reduced position sizes?
Have I taken a break to reset emotionally?
Do I have a written plan for this drawdown level?
Am I avoiding revenge trading?
Have I talked to an accountability partner?
Key Takeaways
Drawdowns are inevitable - every trader experiences them
The math of recovery makes large drawdowns nearly impossible to overcome
Pre-define your response to drawdowns BEFORE they happen
Reduce size during drawdowns, never increase
Separate process from outcome - if process is correct, stay the course
Your Turn
What's the largest drawdown you've experienced?
How did you handle it psychologically?
Share your drawdown survival strategies below 👇

Finding Edge Where Others Aren't Looking
The Best Traders Aren't Just Looking at Charts Anymore
While most traders stare at the same charts, indicators, and news feeds...
A new breed of traders is counting cars in parking lots from space, tracking shipping containers across oceans, and analyzing millions of social media posts.
This is alternative data - and it's changing who has the edge.
What Is Alternative Data?
Definition:
Alternative data is any data used for investment decisions that isn't traditional financial data (price, volume, earnings, etc.).
Traditional Data:
Price and volume
Financial statements
Earnings reports
Economic indicators
Analyst ratings
Alternative Data:
Satellite imagery
Social media sentiment
Web traffic and app usage
Credit card transactions
Geolocation data
Weather patterns
Job postings
Patent filings
And much more...
Types of Alternative Data
1. Satellite and Geospatial Data
What It Tracks:
Retail parking lot traffic
Oil storage tank levels
Crop health and yields
Shipping and logistics
Construction activity
Example:
Count cars in Walmart parking lots before earnings.
More cars = more sales = potential earnings beat.
Edge: Information before it appears in financial reports.
2. Social Media and Sentiment Data
What It Tracks:
Brand mentions and sentiment
Product buzz
Consumer complaints
Viral trends
Influencer activity
Example:
Track sentiment around a new product launch.
Negative sentiment spike = potential sales disappointment.
Edge: Real-time consumer reaction before sales data.
3. Web Traffic and App Data
What It Tracks:
Website visits
App downloads and usage
Search trends
E-commerce activity
User engagement
Example:
Track app downloads for a gaming company.
Declining downloads = potential revenue miss.
Edge: Usage data before quarterly reports.
4. Transaction Data
What It Tracks:
Credit card spending
Point-of-sale data
E-commerce transactions
Consumer behavior patterns
Example:
Aggregate credit card data shows spending at restaurants declining.
Restaurant stocks may underperform.
Edge: Spending patterns before earnings.
5. Employment and Job Data
What It Tracks:
Job postings
Hiring trends
Layoff announcements
Glassdoor reviews
LinkedIn activity
Example:
Company suddenly posts many engineering jobs.
Could indicate new product development.
Edge: Corporate strategy signals before announcements.
6. Supply Chain Data
What It Tracks:
Shipping container movements
Port activity
Supplier relationships
Inventory levels
Logistics patterns
Example:
Track shipping from key suppliers to Apple.
Increased shipments before product launch = strong demand.
Edge: Supply chain signals before sales data.
How AI Processes Alternative Data
Challenge:
Alternative data is:
Massive in volume
Unstructured (images, text, etc.)
Noisy
Requires specialized processing
AI Solutions:
1. Computer Vision
Analyzes satellite imagery
Counts objects (cars, ships, tanks)
Detects changes over time
2. Natural Language Processing
Processes social media text
Extracts sentiment
Identifies trends and topics
3. Machine Learning
Finds patterns in transaction data
Predicts outcomes from alternative signals
Combines multiple data sources
4. Time Series Analysis
Tracks changes over time
Identifies anomalies
Forecasts future values
Alternative Data in Practice
Case Study 1: Retail Earnings
Satellite data shows parking lot traffic up 15% vs last year
Social sentiment for brand is positive
Web traffic to e-commerce site increasing
Prediction: Earnings beat
Result: Stock rises on earnings
Case Study 2: Oil Prices
Satellite shows oil storage tanks filling up
Shipping data shows tankers waiting to unload
Prediction: Supply glut, prices may fall
Result: Oil prices decline
Case Study 3: Tech Company
App download data shows declining engagement
Job postings show layoffs in key division
Social sentiment turning negative
Prediction: Guidance cut coming
Result: Stock falls on earnings
Alternative Data Challenges
Cost - Quality alternative data is expensive. Satellite data: $10,000-$100,000+/year. Transaction data: $50,000-$500,000+/year. Not accessible to most retail traders.
Signal vs Noise - Most alternative data is noise. Requires sophisticated processing. Easy to find false patterns. Overfitting risk is high.
Alpha Decay - As more traders use the same data, edge disappears. Popular datasets become crowded. Unique data sources are key.
Legal and Ethical Issues - Some data collection is questionable. Privacy concerns. Data sourcing legality. Regulatory scrutiny increasing.
Integration Complexity - Combining alternative data with trading is hard. Different formats and frequencies. Requires specialized infrastructure.
Alternative Data for Retail Traders
Accessible Options:
1. Social Sentiment Tools
Free or low-cost sentiment indicators
Twitter/X trending analysis
Reddit sentiment trackers
2. Google Trends
Free search trend data
Track interest in products/companies
Identify emerging trends
3. Web Traffic Estimators
SimilarWeb, Alexa (limited free tiers)
Estimate website traffic
Compare competitors
4. App Store Data
App Annie, Sensor Tower (limited free)
Track app rankings and downloads
Monitor mobile trends
5. Job Posting Aggregators
Indeed, LinkedIn trends
Track hiring patterns
Identify company direction
Building an Alternative Data Framework
Step 1: Identify Your Edge
What information would give you an advantage?
What do you trade?
What drives those assets?
What data could predict those drivers?
Step 2: Find Data Sources
Free sources first (Google Trends, social media)
Low-cost aggregators
Premium sources if justified
Step 3: Process and Analyze
Clean and structure the data
Look for correlations with price
Backtest any signals
Step 4: Integrate with Trading
How will you use the signal?
What's the trading rule?
How do you size positions?
Step 5: Monitor and Adapt
Track signal performance
Watch for alpha decay
Continuously improve
Key Takeaways
Alternative data provides information before it appears in traditional sources
Types include satellite imagery, social sentiment, web traffic, transactions, and more
AI is essential for processing unstructured alternative data at scale
Challenges include cost, noise, alpha decay, and integration complexity
Retail traders can access some alternative data through free or low-cost tools
Your Turn
Have you used any alternative data sources in your trading?
What unconventional information do you think could provide edge?
Share your thoughts below 👇


One small loser and a lot of patient waiting. This recording is a look at what it takes to be a professional trader. I took a fake out short and got stopped for a small loss. Spent the rest of the session waiting for a good setup, including NOT jumping on many fake break outs.
Successful trading is about patience and discipline. Have a plan and follow it. Wait for confirmation. Always use a stop loss. Have a plan for how you will manage your trade once you've entered.

GBPUSD: Mastering One Pair Teaches Swing Trading PerfectlyMost traders don’t fail because they lack strategy
They fail because they lack discipline
In this video, we break down the psychology of trading a single pair and why mastering GBPUSD is one of the fastest ways to build consistency, confidence, and emotional control in the markets.
This isn’t about indicators or chasing setups
It’s about learning one market deeply enough to trust your decisions
Hold trades through drawdown
Stick to a plan
And stop sabotaging yourself with overtrading and noise
We cover
Why focusing on one pair sharpens discipline
How mastering GBPUSD improves risk management and execution
The mental edge that comes from knowing a market inside and out
How to hold trades during drawdown without breaking your rules
If you’re getting back into trading or rebuilding consistency
This video is for you
CTA
Drop a comment with the pair you’re committing to mastering
Subscribe for practical trading psychology and execution-based lessons
And if this resonates share it with a trader who needs to hear it

Axis Bank | Gann Square of 9 Intraday Case Study | 21 Apr 2023This idea illustrates how WD Gann’s Square of 9 helps identify normal intraday price capacity and high-probability reversal zones using price–time geometry.
On 21 April 2023, Axis Bank started showing downside momentum from the second 15-minute candle.
To measure the expected intraday decline, the day’s high near ₹873.85 was selected as the 0-degree (0°) reference point, following standard Gann methodology.
Using the Gann Square of 9, the stock’s normal intraday downside level was projected at:
45° → ₹858
Price reached the 45-degree level around 1:00 PM, completing its normal price capacity well before the ideal Gann timing window near 2:30 PM.
According to Gann’s time–price principles, early completion of a degree level often signals temporary exhaustion.
From this zone, Axis Bank reacted strongly and reversed upward, offering clean intraday recovery movement.
This case demonstrates how price geometry combined with time awareness can help traders define logical reaction zones, rather than relying on indicators or guesswork.
📌 Key Gann Levels
0° → 873.85
45° → 858
🔍 Educational Takeaways
Square of 9 defines price capacity
Time determines when reactions are likely
Early completion increases reversal probability
Structure > indicators
Disclaimer:
This idea is shared strictly for educational and analytical purposes only. It does not constitute trading or investment advice.

“BTCUSD price is falling. Liquidity tells the story.”BTCUSD — When Price Drops, Context Matters More Than Direction
Bitcoin is falling — but the question isn’t how far.
The question is what kind of move this is.
This chart uses the Liquidity Regime Framework to show whether:
Price is being accepted lower (trend continuation), or
Liquidity is absorbing the drop (potential trap / pause)
In bearish regimes, the same support level behaves very differently than it does in bullish ones.
That’s why blindly buying “support” or shorting “momentum” fails during regime shifts.
No buy/sell signals here.
Just context to help you decide when not to trade during volatility.
Direction is obvious.
Regime is not.
If you trade Bitcoin, understanding this difference matters more during drops than rallies.

BTCUSD Liquidity Regime — Context Before SignalsMost traders aren’t losing because of bad entries.
They’re losing because they don’t know what market they’re in.
This chart doesn’t predict price.
It shows context.
Before asking buy or sell, ask:
Is price being accepted… or absorbed?
No signals.
No hype.
Just liquidity, regime, and traps.
Context first. Execution second.

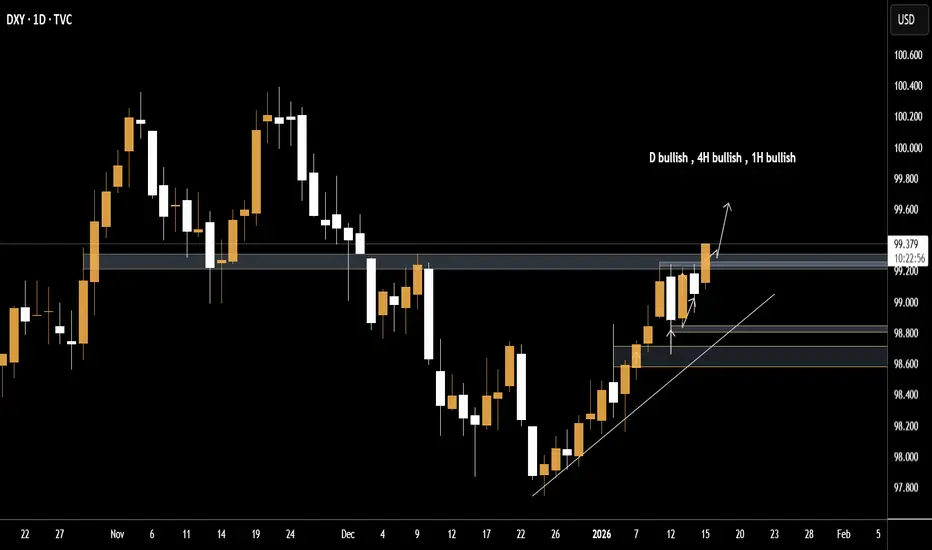
DXY Strength Building | Price Action + Positive Data
The DXY is showing clear bullish strength supported by solid price action and alignment across Daily, 4H, and 1H timeframes.
Today’s PPI data came in positive, adding more fuel to the bullish momentum.
Just two days ago, CPI was also positive, confirming the fundamental support behind this move.
As long as price respects the current structure and demand zones, the bullish scenario remains valid.
Is this the beginning of a stronger USD phase? 🚀📊

Impact of Multinational Corporations (MNCs) on Global TradingExpansion of Global Trade Volumes
One of the most visible impacts of MNCs on trading is the massive expansion of global trade volumes. By operating in multiple countries, MNCs import raw materials from one region, process them in another, and sell finished products across global markets. This integrated approach significantly increases cross-border transactions. Large corporations such as automobile manufacturers, technology firms, and energy companies engage in continuous international trade, making them major contributors to world exports and imports. As a result, MNCs act as powerful engines driving international commerce and market integration.
Development of Global Supply Chains
MNCs have revolutionized trading through the creation of complex global supply chains. Instead of producing goods entirely in one country, companies break production into stages and locate each stage where it is most cost-effective. For example, design may occur in a developed economy, manufacturing in a developing country, and assembly or marketing elsewhere. This fragmentation of production increases trade in intermediate goods and services. It also deepens economic interdependence between nations, making global trade more efficient but also more sensitive to disruptions such as geopolitical tensions or supply shocks.
Technology Transfer and Innovation
Another critical impact of MNCs on trading is technology transfer. When MNCs enter foreign markets, they often bring advanced technologies, modern management practices, and innovative processes. Local firms engaged in trade benefit by learning from these practices, improving productivity and product quality. Over time, this raises the competitiveness of host countries in global markets. Technology-driven efficiency also reduces production costs, enabling MNCs to trade at larger scales and offer competitively priced products internationally.
Influence on Trade Policies and Regulations
MNCs possess significant economic power, allowing them to influence trade policies and regulations. Governments often adjust trade rules, tax structures, and investment policies to attract or retain multinational investment. Free trade agreements, special economic zones, and export incentives are frequently designed with large corporations in mind. While this can promote trade liberalization and economic growth, it can also raise concerns about unequal bargaining power, where smaller nations may prioritize corporate interests over local businesses or long-term economic stability.
Impact on Developing Economies
For developing countries, MNCs can be both an opportunity and a challenge in trading. On the positive side, MNCs generate export earnings, create jobs, improve infrastructure, and integrate local economies into global trade networks. Many emerging economies have become major exporters by serving as manufacturing hubs for multinational firms. However, dependence on MNC-led trade can also make these economies vulnerable. Profit repatriation, limited local value addition, and pressure on domestic industries may restrict long-term benefits if not managed carefully.
Standardization and Global Brands
MNCs contribute to the standardization of products and trading practices across borders. Global brands follow uniform quality standards, packaging, pricing strategies, and logistics systems. This standardization simplifies international trade by reducing transaction costs and increasing consumer trust. At the same time, it intensifies competition, as local traders and small firms must compete with well-known multinational brands that enjoy economies of scale, strong marketing power, and extensive distribution networks.
Financial Flows and Capital Movement
Trading activities of MNCs are closely linked with international capital flows. Cross-border investments, intra-company trade, and transfer pricing significantly affect trade balances and foreign exchange markets. MNCs often trade goods and services between their subsidiaries, influencing reported trade statistics. These internal transactions can optimize costs but may also create regulatory challenges for governments trying to ensure fair taxation and transparent trade reporting.
Employment and Skill Development
Through their trading operations, MNCs impact labor markets worldwide. Export-oriented production facilities generate employment and promote skill development, especially in manufacturing and services sectors. Skilled labor improves the capacity of countries to participate in higher-value trade. However, automation and cost optimization strategies adopted by MNCs can also lead to job displacement, highlighting the need for balanced trade and employment policies.
Market Competition and Trade Dynamics
MNCs intensify global competition by entering new markets with strong financial backing and advanced capabilities. This can lower prices and improve product quality for consumers, stimulating trade demand. At the same time, aggressive competition may drive smaller traders out of the market. Over time, trading becomes dominated by large players, potentially reducing diversity and resilience in global trade systems.
Challenges and Criticisms
Despite their benefits, MNCs face criticism for certain trading practices. Issues such as environmental degradation, labor exploitation, tax avoidance, and excessive market power are frequently highlighted. Critics argue that unchecked multinational trading can widen economic inequalities between countries and within societies. Addressing these challenges requires effective global trade governance, transparent regulations, and responsible corporate behavior.
Conclusion
In conclusion, Multinational Corporations have a profound and multi-dimensional impact on global trading. They expand trade volumes, build global supply chains, transfer technology, influence policies, and shape market competition. While their role has accelerated economic integration and growth, it also presents challenges related to equity, sustainability, and economic sovereignty. The future of global trade will depend on how effectively governments, international institutions, and MNCs collaborate to ensure that multinational trading promotes inclusive growth, fair competition, and long-term global economic stability.

Global Stock MarketStructure, Functioning, Trends, and Its Impact on the World Economy
The global stock market represents a vast network of interconnected financial exchanges where shares of publicly listed companies are bought and sold across countries and continents. It is one of the most important pillars of the modern financial system, serving as a bridge between companies that need capital and investors seeking opportunities for wealth creation. From the New York Stock Exchange (NYSE) and NASDAQ in the United States to the London Stock Exchange (LSE), Tokyo Stock Exchange (TSE), Shanghai Stock Exchange (SSE), and India’s NSE and BSE, the global stock market operates almost around the clock, reflecting the continuous flow of capital in a globalized economy.
At its core, the global stock market performs two fundamental functions. First, it enables companies to raise capital by issuing shares to the public. This capital is then used for expansion, research and development, infrastructure, and innovation. Second, it provides investors with a platform to participate in the growth of these companies, offering potential returns in the form of capital appreciation and dividends. Together, these functions support economic growth, job creation, and technological progress worldwide.
Structure of the Global Stock Market
The global stock market is not a single, centralized entity but a collection of national and regional markets connected through technology, capital flows, and investor sentiment. Each country typically has one or more stock exchanges regulated by domestic authorities. For example, the U.S. markets are regulated by the Securities and Exchange Commission (SEC), while India’s markets are regulated by the Securities and Exchange Board of India (SEBI). Despite differing regulations, accounting standards, and trading hours, globalization has tightly linked these markets.
Market participants include retail investors, institutional investors such as mutual funds, pension funds, insurance companies, hedge funds, sovereign wealth funds, and increasingly, algorithmic and high-frequency traders. Advances in technology have made cross-border investing easier than ever, allowing investors in one country to invest in equities listed thousands of kilometers away with minimal friction.
Key Global Stock Market Indices
Stock market indices act as benchmarks to measure the performance of specific markets or sectors. Prominent global indices include the S&P 500, Dow Jones Industrial Average, and NASDAQ Composite in the U.S.; the FTSE 100 in the UK; the DAX in Germany; the Nikkei 225 in Japan; the Hang Seng Index in Hong Kong; and the Nifty 50 and Sensex in India. Global indices such as the MSCI World Index and MSCI Emerging Markets Index provide a broader view of international equity performance.
These indices are closely watched because they reflect investor confidence, economic expectations, and corporate health. Movements in major indices often influence investor sentiment globally, triggering rallies or sell-offs across multiple markets.
Factors Influencing the Global Stock Market
The global stock market is influenced by a wide range of factors, both economic and non-economic. Macroeconomic indicators such as GDP growth, inflation, interest rates, employment data, and trade balances play a crucial role. Central bank policies, especially interest rate decisions by institutions like the U.S. Federal Reserve, the European Central Bank (ECB), and other major central banks, have a significant impact on global liquidity and equity valuations.
Geopolitical events also strongly affect global markets. Wars, trade disputes, sanctions, elections, and diplomatic tensions can increase uncertainty and volatility. For example, conflicts in major oil-producing regions can impact energy prices, which in turn affect stock markets worldwide. Similarly, global crises such as the COVID-19 pandemic demonstrated how interconnected markets are, as shocks in one region quickly spread across the globe.
Corporate earnings and financial performance are another key driver. Strong earnings growth tends to support higher stock prices, while disappointing results can lead to sharp declines. Technological innovation, mergers and acquisitions, and regulatory changes also influence market dynamics.
Developed vs. Emerging Markets
The global stock market is often divided into developed markets and emerging markets. Developed markets, such as the U.S., Western Europe, Japan, and Australia, are characterized by mature economies, stable political systems, strong regulatory frameworks, and high market liquidity. These markets tend to be less volatile but may offer relatively moderate growth compared to emerging markets.
Emerging markets, including countries like India, China, Brazil, South Africa, and Indonesia, are associated with faster economic growth, expanding middle classes, and increasing industrialization. While these markets offer higher growth potential, they also come with higher risks due to political instability, currency fluctuations, and regulatory uncertainties. Global investors often diversify across both developed and emerging markets to balance risk and return.
Role of Technology and Globalization
Technology has transformed the global stock market dramatically. Electronic trading platforms, real-time data, mobile trading apps, and algorithmic trading have increased market efficiency and accessibility. Information now travels instantly, meaning that news released in one country can impact stock prices worldwide within seconds.
Globalization has further strengthened these connections. Multinational corporations operate across borders, and their performance depends on global supply chains, consumer demand, and international trade policies. As a result, the stock price of a company listed in one country may be influenced by economic conditions in many others.
Opportunities and Risks for Investors
The global stock market offers vast opportunities for investors. International diversification can reduce portfolio risk by spreading investments across different economies, sectors, and currencies. Investors can gain exposure to global growth trends such as digitalization, renewable energy, healthcare innovation, and artificial intelligence.
However, global investing also involves risks. Currency risk can affect returns when exchange rates fluctuate. Political and regulatory risks may impact foreign investments. Market volatility can increase during global crises, leading to sharp and sudden losses. Therefore, successful participation in the global stock market requires careful research, risk management, and a long-term perspective.
Conclusion
The global stock market is a powerful engine of economic growth and wealth creation, reflecting the collective expectations and decisions of millions of participants worldwide. It connects economies, channels savings into productive investments, and provides insights into the health of businesses and nations. While it is influenced by a complex mix of economic data, corporate performance, technology, and geopolitics, its fundamental role remains unchanged: allocating capital efficiently and enabling participation in global prosperity.
In an increasingly interconnected world, understanding the global stock market is essential not only for investors but also for policymakers, businesses, and individuals seeking to navigate the modern economy. With the right knowledge, discipline, and strategy, the global stock market can serve as a valuable tool for long-term financial growth and economic development.
Role of International Trade1. Promotes Economic Growth
One of the most significant roles of international trade is its contribution to economic growth. By opening access to larger global markets, countries can sell more than they could within their domestic boundaries. This increased demand encourages higher production, leading to better utilization of resources and economies of scale. Export-oriented industries often grow faster, contributing positively to a nation’s Gross Domestic Product (GDP). For developing countries, international trade provides opportunities to accelerate growth by integrating with global value chains.
2. Efficient Allocation of Resources
International trade is based on the principle of comparative advantage, which states that countries should specialize in producing goods and services they can produce most efficiently and at lower opportunity cost. For example, a country rich in natural resources may focus on mining or agriculture, while a technologically advanced country may specialize in manufacturing or services. This specialization leads to efficient allocation of global resources, minimizing waste and maximizing productivity worldwide.
3. Enhances Consumer Choice and Living Standards
Trade allows consumers access to a wide variety of goods and services that may not be available domestically. Products such as electronics, automobiles, medicines, clothing, and food items can be sourced from different parts of the world at competitive prices. Increased competition among producers also leads to better quality and innovation. As a result, consumers enjoy lower prices, improved quality, and greater choices, which significantly enhances living standards.
4. Encourages Industrial Development
International trade supports industrialization, especially in developing and emerging economies. Exposure to global markets encourages industries to improve efficiency, adopt new technologies, and meet international quality standards. Export-led growth strategies have helped many countries transform from agrarian economies into industrial powerhouses. Trade also attracts foreign direct investment (FDI), which brings capital, managerial expertise, and advanced technology.
5. Generates Employment Opportunities
Trade expansion leads to job creation in export-oriented industries such as manufacturing, agriculture, logistics, shipping, finance, and information technology. As companies expand production to meet global demand, they require more labor. Although trade can sometimes lead to job displacement in less competitive sectors, overall it creates better employment opportunities and encourages skill development. Governments can support workforce transition through training and education programs.
6. Facilitates Technology Transfer and Innovation
International trade plays a crucial role in spreading technology and innovation across borders. Imports of advanced machinery, equipment, and software help domestic industries modernize production processes. Multinational companies often share best practices, research methods, and technical knowledge with local firms. This exchange accelerates innovation, increases productivity, and strengthens a country’s technological capabilities.
7. Strengthens International Relations
Trade fosters cooperation and interdependence among nations. Countries engaged in trade are more likely to maintain peaceful relations, as economic ties create mutual benefits. Trade agreements and economic partnerships promote dialogue, trust, and collaboration on broader global issues such as climate change, security, and sustainable development. Thus, international trade also plays a diplomatic role by strengthening global stability.
8. Supports Economic Diversification
For many countries, especially those dependent on a single commodity or sector, international trade encourages diversification. By exploring new export markets and products, economies reduce dependence on limited resources and minimize vulnerability to price fluctuations. Diversification improves economic resilience and helps countries better withstand global economic shocks.
9. Increases Government Revenue
Trade generates significant revenue for governments through customs duties, tariffs, and taxes on imports and exports. These revenues can be used to fund public services such as infrastructure, healthcare, education, and social welfare programs. While many countries are reducing tariffs under free trade agreements, trade-related economic growth still expands the tax base.
10. Promotes Global Economic Integration
International trade is a foundation of globalization. It connects countries into a single economic system where goods, services, and capital flow more freely. This integration helps align production standards, financial systems, and business practices. While globalization presents challenges such as inequality and environmental concerns, its benefits—driven largely by trade—have lifted millions out of poverty worldwide.
11. Challenges and Responsible Trade
Despite its advantages, international trade also presents challenges. Trade imbalances, protectionism, unfair trade practices, environmental degradation, and social inequality are important concerns. Therefore, the role of international trade must be supported by fair trade policies, strong regulations, environmental protection, and inclusive growth strategies. Sustainable and ethical trade ensures that the benefits are widely shared.
Conclusion
The role of international trade in the modern world is multifaceted and indispensable. It drives economic growth, promotes efficiency, enhances consumer welfare, supports industrial and technological advancement, and strengthens global cooperation. While challenges exist, well-managed international trade remains a powerful engine for development and prosperity. In an increasingly interconnected global economy, countries that actively and responsibly engage in international trade are better positioned to achieve long-term economic stability and improved quality of life for their citizens.

ICICI Bank | Gann Square of 9 Intraday Case Study | 06 Apr 2023This chart presents a classical WD Gann Square of 9 intraday setup, where price completed its normal capacity early in time, leading to a high-probability reversal.
On 06 April 2023, ICICI Bank started gaining upside momentum from the third 15-minute candle.
The intraday low at ₹875 was selected as the 0-degree (0°) reference point, following standard Gann methodology.
Using the Gann Square of 9, the stock’s normal intraday upside level was projected at:
45° → ₹890
Price reached the 45-degree level around 11:15 AM, which is significantly earlier than the ideal Gann time window near 2:30 PM.
As per Gann’s time–price relationship, early completion of a degree level often indicates temporary exhaustion.
The stock reacted precisely from this zone and reversed lower, offering clear intraday downside movement.
This case highlights how price geometry combined with time analysis helps traders identify logical reaction zones, rather than depending on indicators or assumptions.
📌 Key Gann Levels
0° → 875
45° → 890
🔍 Learning Points
Square of 9 defines price capacity
Time determines when that capacity becomes effective
Early completion = higher probability of reaction
Structure > indicators
Disclaimer:
This idea is shared for educational and analytical purposes only. It is not a trading or investment recommendation.
