M2 Liquidity vs Gold × VIX — Macro Stress & Liquidity GaugeThe formula reflects real U.S. dollar liquidity, normalized through gold as a long-term store-of-value anchor and multiplied by VIX — an indicator of market stress and expected volatility.
The indicator has been working for over 20 years and captures global market sentiment: periods when market participants are willing to take on risk, as well as phases of consolidation and heightened caution.
The green zone represents periods of fear and liquidity compression — precisely the conditions under which favorable opportunities for gradual position accumulation are formed.
The red zone reflects overheated market phases, when investors are already deeply positioned and the incentive grows to lock in profits, move to cash, or rotate capital into other asset classes (under current conditions — including crypto markets).
The yellow zone serves as a transitional decision-making phase.
When the indicator moves from the green zone toward the red zone, the yellow zone acts as an area for partial profit-taking, helping reduce risk ahead of potential market overheating.
When the indicator moves from the red zone toward the green zone, the yellow zone may serve as an area for re-entering or gradually rebuilding a position.
The yellow zone functions as a balancing range, allowing for position management and capital reallocation without attempting to precisely time market reversals.
1-VIX

VIX: Fear vs Correction principleBased on principle, where highest probability is when:
-(SPX) 50/200 UP sloping.
-Full correction
-Positive "context" (fundamentals, that change every year. For instance next year theme is new FED chair. Beginning of QE money printing etc).
Some times SPX drops and VIX flies on "fear". but strong trend stays in tact. And sometimes there is a full exhaust, meaning going up is "easy" (no resistance).

YEN CARRY TRADE LAST WAVE UP 5 of C of B CRASH SOON AFTERThe chart of the yen carry trade The reason for the coming CRASH in world markets for 2026 . Best of trades WAVETIMER !

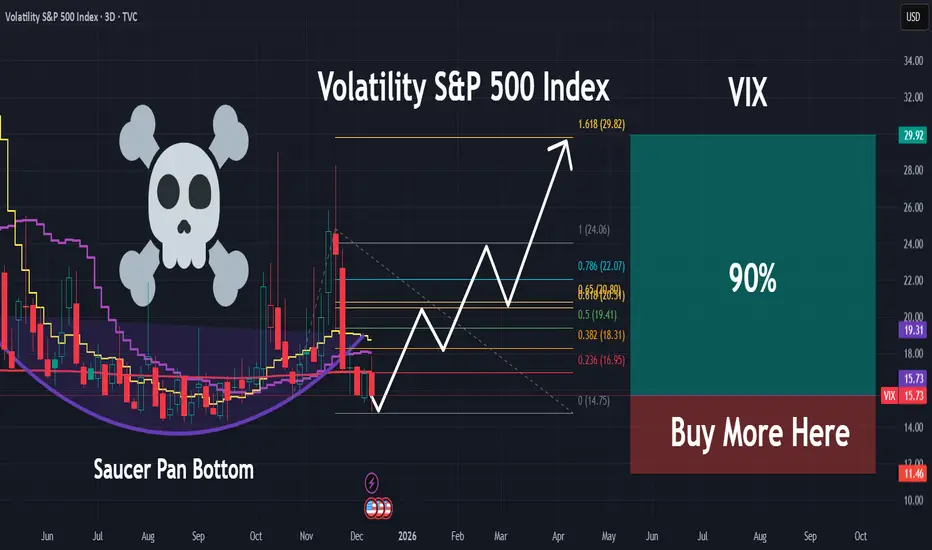
VIX | Major Volatility and Market Correction Incoming | LONGThe VIX Index, formally known as the Cboe Volatility Index, is a real-time market index that represents the market's expectation of 30-day forward-looking volatility for the S&P 500 index. It is widely known as the "fear gauge" because it tends to rise sharply during periods of increased investor fear and market uncertainty.
Weekly US Market Outlook – SPY, QQQ, DXY, VIX (30 NOV)Weekly US Market Outlook – SPY, QQQ, DXY, VIX
Bullet points:
Market sentiment turned bullish again as the probability of a December Fed rate cut climbed to 87%.
Fear & Greed Index recovered from extreme fear (9) to 24.
Options sentiment still signals extreme fear → room for upside continuation.
DXY remains bearish until 99, supporting risk assets.
VIX continues to decline toward 15.70–14.20, but these levels historically precede sharp corrections.
Heavy data week ahead (ADP, Jobless Claims, PCE) → major volatility drivers.
SPY targets 690 → 700 zone; QQQ targets 625 → 637 → 647.5.
Market Sentiment
Market sentiment has shifted decisively toward a bullish stance after the probability of a December rate cut surged back to 86%. Markets are now pricing in one more cut before 2026, creating a supportive macro backdrop for equities. At the same time, the Fear & Greed Index has rebounded from extreme fear levels of 9 to 24, indicating a slow but clear improvement in risk appetite.
Stronger than expected earnings from NVDA continue to reinforce the narrative that the AI cycle is intact and far from bubble conditions. Additionally, easing geopolitical tensions specifically the US–China trade agreement have reduced risk premia across global markets. Taken together, these developments support a short to mid term bullish environment and increase the likelihood of a Santa Rally.
Options Sentiment
Despite improving market sentiment, options markets remain deeply positioned in the extreme fear zone. This divergence between spot indices and options positioning typically suggests that market participants remain hedged or underexposed, allowing equities to extend higher as positioning normalizes. In other words, options sentiment indicates there is still significant room for markets to explore higher price levels.
DXY – US Dollar Index
Monitoring the DXY is essential because of its direct correlation with risk assets. A rising dollar weighs on equities, while a declining dollar supports them. The DXY was rejected at the 100.30 level and is now retracing toward the HTF Key Zone, highlighted around 99.
My base case is a move down into the 99 region, followed by short term accumulation and a potential bounce back above this level. Until DXY reaches 99, the trend remains bearish, which historically provides strong support for equities, commodities, and other USD sensitive assets.
VIX – Volatility Index
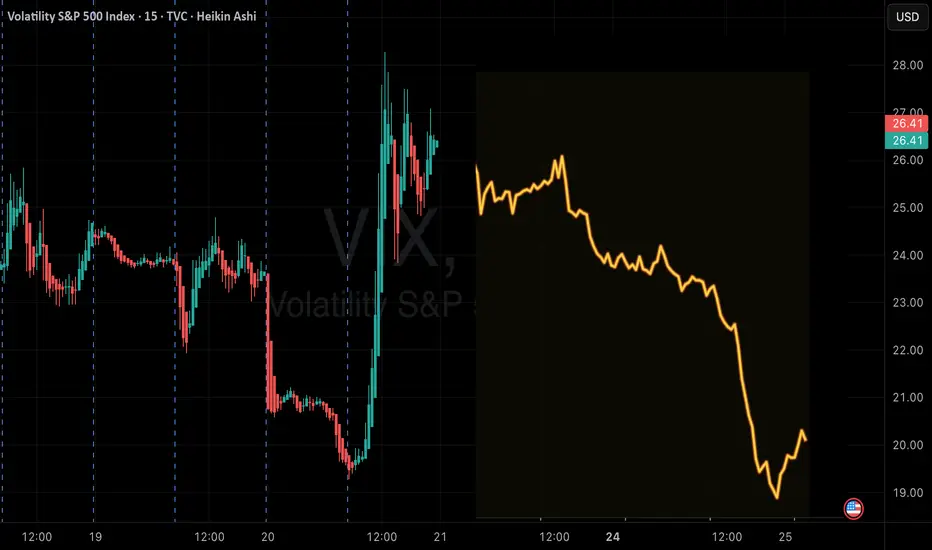
VIX, which reflects S&P 500 options based volatility expectations, has been declining since the November 21 peak, which aligned with the recent local bottom in the S&P 500. I expect VIX to continue trending lower toward 15.70 and potentially 14.20 levels previously associated with S&P 500 all time highs.
However, it is crucial to note that when VIX reaches these zones, markets often experience rapid and unexpected corrections. Therefore, while volatility compression favors short-term bullish continuation, the risk of a sharp reversal increases as VIX approaches these historically significant thresholds.
Upcoming Data Releases
A high-impact macro week is ahead, especially between Wednesday and Friday. The key releases include:
ISM Manufacturing PMI – Monday
JOLTS Job Openings – Tuesday
ADP Nonfarm Employment – Wednesday
Services PMI – Wednesday
ISM Non-Manufacturing PMI – Wednesday
Initial Jobless Claims – Thursday
PCE Inflation (September, delayed) – Friday
Michigan Consumer Sentiment – Friday
The most influential dataset will be the combination of ADP Employment, Initial Jobless Claims, and PCE Inflation. If labor data comes in stronger than expected, the Fed may interpret it as a sign of a resilient labor market reducing the need for additional cuts. Conversely, if PCE inflation comes in hotter than expected, policymakers may see it as a reason to delay cuts.
Given that this PCE print is delayed due to the U.S. government shutdown, the market reaction may be muted, but it still matters for the December policy narrative.
SPY Weekly Outlook – Prediction
In my opinion, SPY is positioned to target new all time highs early in the week. Price may first test 686, followed by a brief retracement or consolidation, and then continue higher toward 690, marking a fresh ATH. Under strong bullish momentum, SPY may extend into the 700 zone by the end of the week. These levels represent the primary upside targets I will be monitoring closely.
QQQ Weekly Outlook – Prediction
QQQ remains structurally weaker than SPY, yet it also maintains strong bullish momentum. The 617 level is a key zone for potential call entries. Price may initially target 625, where a short term rejection could occur, followed by a small pullback. Afterward, QQQ could advance toward its all time high at 637, and in a stronger continuation scenario, possibly extend to 647.5.
Conclusion
Overall, market conditions have turned constructive again. Sentiment is stabilizing, central bank expectations are supportive, volatility is compressing, and the dollar remains weak all providing a tailwind for equities. This week’s heavy macro calendar may bring volatility spikes, but unless data significantly challenges the rate cut narrative, both SPY and QQQ appear positioned to continue their upward trajectory toward new highs.
⚠️ This analysis is for educational purposes only and does not constitute financial advice. Always conduct your own research before trading or investing.

VIX mid-term TAI've been watching VIX closely since September, and the accumulation has been growing since then and it's not stopped yet, it looks like it set double top and currently is cooling down but the indicators are still very strong and they don't get that strong that often on daily time frame, the VIX may look like it's cooling down for a holiday cheer but it didn't go away yet. So be prepared for a possible volatility to hit again.

volatility clustering"high volatility is often followed by high volatility (and low by low) rather than being randomly distributed"
Markets move in cycles. Using this principle you could some times predict outcomes (regime changes).

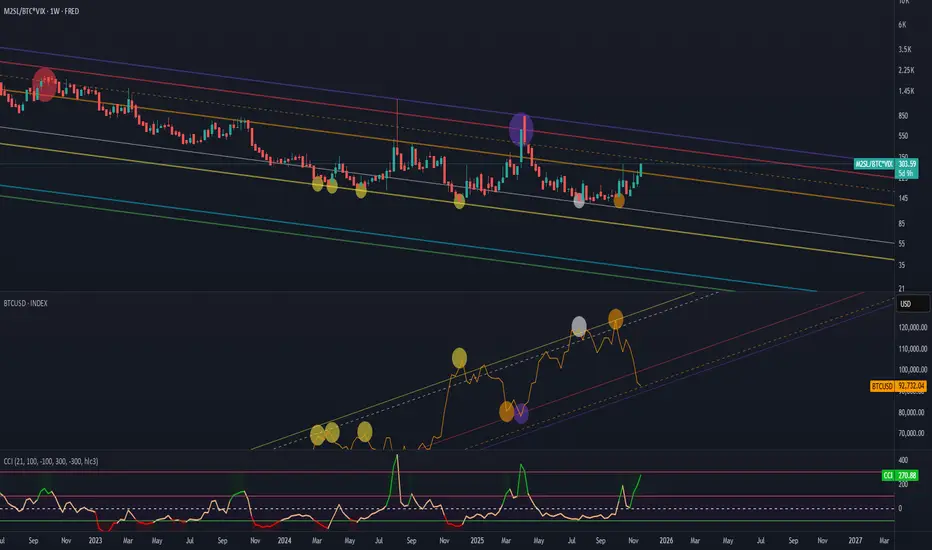
Macro Liquidity Model + Altcoin True Market Cap: CorrelationMacro Liquidity Model vs Altcoin Real Market Cap — CCI & MACD Confirmation
This model uses the formula:
FRED:M2SL / (CRYPTOCAP:TOTAL3 – CRYPTOCAP:USDT – CRYPTOCAP:USDC – CRYPTOCAP:DAI) × TVC:VIX
It shows the relationship between global liquidity (M2) market fear (VIX) and the true altcoin market capitalization (TOTAL3 excluding stablecoins).
This helps us understand which phase of the market we are currently in.
At the moment we are somewhere right near the bottom — if not already at the bottom. You can safely start accumulating any asset you prefer.
The CCI shows “overbought” conditions for M2, which actually means altcoins are oversold.
MACD hasn’t touched zero yet, which suggests there might still be a small dip left — which is also visible on the TOTAL3 – USDT – USDC – DAI chart.
If the next weekly candle closes bullish, there is a chance the market will continue rising until May, especially if the 2020 fractal repeats.
In general, May looks like the optimal time to start taking profits — and then we will see how the macro develops from there.
For additional clarity:
the upper chart represents global money (M2)
the lower chart represents altcoins
the higher the upper chart goes → the more money is OUT of the market
the lower it drops → the more money is FLOWING into the market

QuantSignals V3: VIX Poised for Potential Pullback – Handle WithVIX Weekly | QuantSignals V3 | 2025-11-20
Direction: PUT (Bearish)
Confidence: 58%
Expiry: 2025-11-28 (8 days)
Strike Focus: $23.00
Weekly Momentum: BEARISH (-1.17%)
Flow Intel: Neutral
Entry Price: Market (illiquid options)
Target 1: Price-dependent
Target 2: Price-dependent
Stop Loss: $24.01 (Katy AI stop level)
Position Size: 1% of portfolio (extremely cautious)
Analysis:
Katy AI: NEUTRAL overall, but 68.8% of prediction points below current price; final target $19.88 (-15.9%).
Technical: VIX at $23.66, 1-week bearish momentum, resistance $24.01, support around $21-22.
Options Flow: Extremely illiquid, neutral bias.
Risk Level: HIGH – illiquid market, low confidence, extreme volatility.
Trade Setup:
Why Trade: Detailed AI series shows consistent downward bias.
Timing: Position early in the week to capture predicted decline.
Risk Mitigation: Extremely small size; stop loss at $24.01.
⚠️ Important: Illiquid VIX options make this trade high-risk. Only for professional traders or market-makers. Retail traders should avoid.
PRE-NY CONDITIONS Dollar is pressing into a major cross-asset high, recognized across FX, yields, and risk assets. London kept DXY inside a tight structure with no clean breakout, which turns this level into stop-time: the point where liquidity pauses and the market decides whether the move extends or fades.
Front-end yields remain firm, anchoring the Dollar’s support. The 10-year is indecisive, offering no confirmation and keeping the curve without a clear macro signal. ES holds its overnight gap on Nvidia strength, but volatility near 21 keeps risk fragile. Gold remains neutral, reflecting a balanced but uncertain safety tone into the U.S. session.
DXY: Testing a major high; range-bound after London; structure stretched but supported by 2Y strength.
US10Y: Indecisive daily structure; long end is not confirming Dollar strength; macro tone remains unclear.
US2Y: Firm short-end repricing; maintains policy pressure and supports Dollar tone.
ES: Holding gap; risk appetite supported but shallow; volatility still limiting follow-through.
Gold: Neutral safety tone; neither attracting nor rejecting flows; reflects cross-asset indecision.
VIX: Near 21; elevated volatility keeps conditions reactive and reduces trend reliability.
Cross-asset alignment remains mixed. The Dollar is firm, but only the front end confirms it. Long-end yields hesitate. ES shows controlled appetite, but volatility denies conviction. Gold confirms the indecision. Liquidity conditions lean cautious, shaped more by bond market signals than by clean macro drivers.
Pillar Focus: PEM — Confirmation Entries
Today's environment aligns with PEM logic. A stretched Dollar at a major level, split yields, and elevated volatility mean operators should rely on confirmation-based triggers, shorter engagements, and strict timing. High-frequency windows (NY open → 10:00 → London fix) carry more clarity than directional assumptions.
Follow higher-timeframe direction
Ignore noise from earlier sessions
Wait for structure + flow alignment
Act only on confirmation
Summary: NY opens into a cautious environment defined by a stretched Dollar, mixed yields, and elevated volatility — a clear PEM day.
— CORE5DAN
Institutional Logic. Modern Technology. Real Freedom.

QuantSignals V3: High-Confidence VIX DowntrendVIX QuantSignals Katy 1M Prediction (2025-11-19)
Current Price: $22.40
Trend: Bearish
Confidence: 75%
Volatility: 94.1%
Final Prediction: $20.98 (-6.34%)
30-Min Target: $21.10 (-5.81%)
Trade Signal:
Direction: PUT
Entry: $22.40
Target: $21.26
Stop Loss: $22.74
Expected Move: -6.34%
Summary: 1 trade signal generated from 1 successful analysis.
Liquidity (M2) to BTC.D, amplified by (VIX) FEARIt shows the ratio of global liquidity (M2) to Bitcoin’s market capitalization, amplified by market fear (VIX), relative to BTCUSD.
Thanks to this formula, we have an understanding of which phase of the market we are currently in.
In this case the CCI indicator shows:
overbought conditions — meaning money is outside the market and
oversold conditions — meaning there is too much money in the market and it’s time to sell
FRED:M2SL/CRYPTOCAP:BTC*TVC:VIX
For some reason the Bitcoin chart isn’t displaying with all the markings, so I’ll attach a screenshot below.
PRE-LONDON CONDITIONS — DXY Range-Bound, Yields Slide, ES HeavyU.S. Dollar Index (DXY) holds a tight 98.99–99.59 range in a third consecutive inside bar.
U.S. 10-year yield drops ~1.01% in Asia.
U.S. 2-year yield falls ~1.27%.
S&P 500 futures (ES) extend lower toward the 6.571 fractal.
Gold tests support after filling imbalance.
Volatility remains elevated.
DXY — Dollar Index
Dollar stays inside 98.991–99.591.
Inside-bar stack remains unbroken.
Price sits near the 0.6 premium zone.
Neutral until London breaks the range.
Yields — 10Y & 2Y
10Y yield: -1.01% in Asia → long-end compression.
2Y yield: -1.27% → dovish policy tone.
Curve: both ends lower → risk-off positioning.
ES — S&P 500 Futures
ES moves lower toward 6.571.
Yesterday’s high-volatility expansion continues.
Tone remains defensive.
Gold — Safety Premium
Gold fills imbalance and presses into support.
Break = active safety flows.
Hold = passive bid.
Volatility
VIX closed pre-London.
Futures hold elevated regime.
Conditions favor fast intraday expansions.
Calendar Risk
Medium-tier data ahead.
Yesterday’s partial data production repeats → limited visibility.
Expect flow-driven moves until major prints arrive.
Execution View
DXY bias neutral inside range.
Yields down + ES down = risk-off.
Gold support = key inflection.
London expansion outside 98.99–99.59 sets direction.
Trade second move, not first spike.
Summary:
Dollar trapped. Yields lower. ES heavy. Gold at support.
Fragile pre-London environment; London’s first expansion defines the session.
— CORE5DAN
Institutional Logic. Modern Technology. Real Freedom.

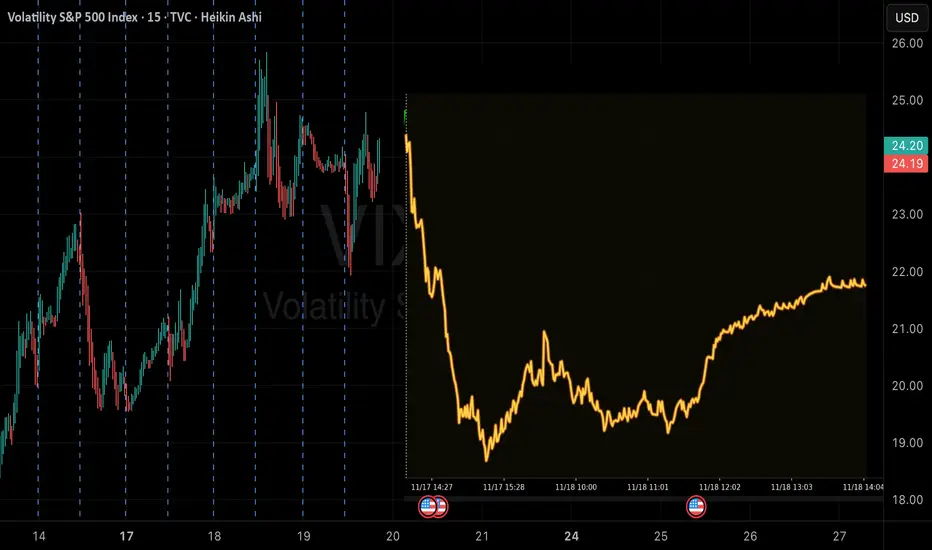
QuantSignals V3 | High-Probability VIX OptionsVIX Weekly Signal | 2025-11-17
Direction: BUY PUTS
Strike: $20.00
Entry: $0.00 (requires live price discovery)
Target 1 / 2: $0.10 / $0.20
Stop Loss: $0.00 / $20.13
Expiry: 2025-11-21
Confidence: 60% | Medium
Weekly Momentum: BEARISH (-4.02%)
Technical Notes: Slight bearish bias; support $18.97, resistance $20.13
Risk: Moderate – VIX is volatile; monitor options data carefully
Alternate VIX CALL Signal:
Strike $22.50, Confidence 70%, weekly bullish momentum +10%, strong trend confirmation, entry $0.00 (verify pricing), Target 1/2: $0.30/$0.50
PRE-LONDON CONDITIONS — 17 Nov 2025I. Market Environment
Dollar: Neutral overnight. No directional pressure in Asia.
Yields: US10Y and US2Y stable — policy expectations unchanged.
Risk: Equities firm but stretched. Volatility elevated from Friday.
Focus: Light session before a heavy macro week.
Liquidity: Cautious, headline-sensitive.
II. Six-Chart Snapshot
(All structural notes shown on your chart image — not repeated in text.)
III. Cross-Asset Signals
Yields keep the Dollar capped.
Equities supported but fragile.
Gold softer despite elevated volatility.
Flows lean cautious.
Global risk = neutral-to-defensive.
IV. Core Drivers
• Dollar behavior inside a neutral environment
• Yield stability across the curve
• Equity sensitivity with elevated volatility
• London open → London fix → U.S. session flow
V. Execution Notes — PEM Logic
Follow higher-timeframe direction
Ignore early-session noise
Wait for structure + flow alignment
Act only on confirmation
Summary
Neutral Dollar, stretched risk, elevated volatility — London opens in a cautious, event-driven environment.
— CORE5DAN
Institutional Logic. Modern Technology. Real Freedom.

$VIX: ALLIGNED FOR FURTHER EQUITY MARKET WEAKNESS We can observe the following on the weekly chart:
1. MACD buy signal since September 29th
2. RSI 14 above the 50 line at 53
3. From October 27th onwards, higher weekly lows and higher weekly closing highs.
4. Despite new all-time highs for benchmark stock indices, there is a divergence with the TVC:VIX (negative divergence for equities)
If this pattern persists, the risk to the stock market remains.

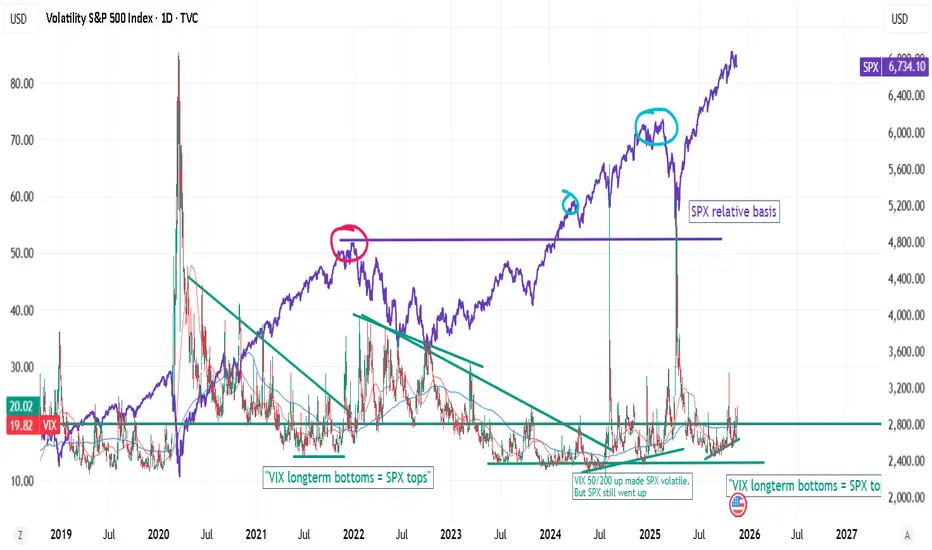
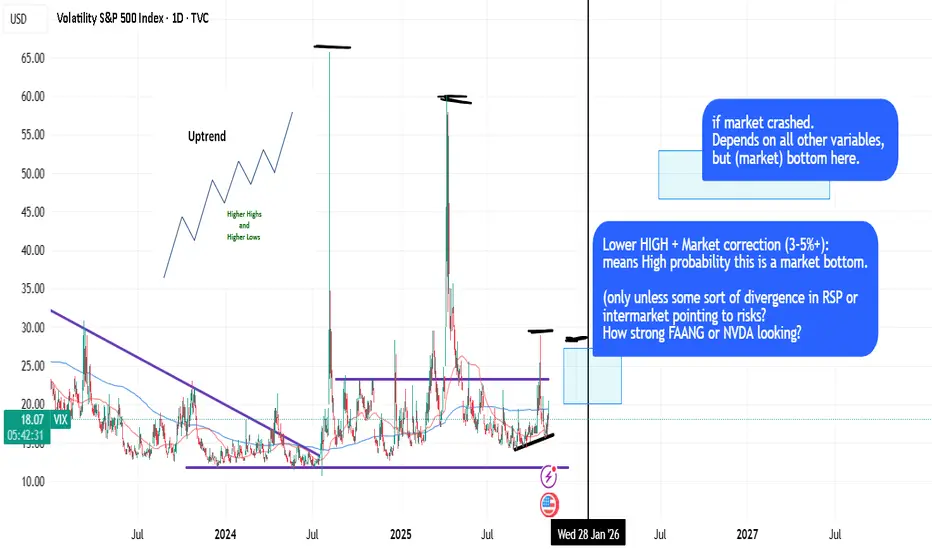
VIX and SPX myths.There's truth about VIX longterm bottoms and SPX tops, but believing that concept can come biting you back.
Stock performance will correlate with SPX in relative terms? ie how much potential and lack of resistance. Stocks go in cycles. So probably this is a important concept to study and master.
QuantSignals Predicts Volatility CrushTicker: VIX
Current Price: 20.00
Trend: Bearish
Confidence: 75%
Volatility: 167.8%
Katy AI forecasts a significant volatility compression, projecting the VIX to drop toward 15.90, a -20.48% expected move.
📈 AI Price Predictions
30-Min Target: 20.06 (+0.30%)
Final Prediction: 15.90 (-20.48%)
The model shows a short-term stabilization before a sharp decline, consistent with volatility mean-reversion behavior.
🎯 Trade Signal
Direction: PUTS
Entry: 20.00
Target: 16.72
Stop Loss: 20.30
Expected Move: -20.48%
This setup aligns with a high-confidence bearish read, supported by AI trend direction and volatility compression indicators.
🔎 Strategy Notes
Trend consistency points to continued downside in volatility.
Tight stop-loss recommended due to VIX’s fast, nonlinear movements.
Works best for traders playing volatility normalization after elevated readings.
✅ Summary
Katy AI generated 1 high-confidence bearish signal out of 1 VIX analysis.
The setup favors PUTS, targeting a move toward 15.90–16.70 with strong model conviction.
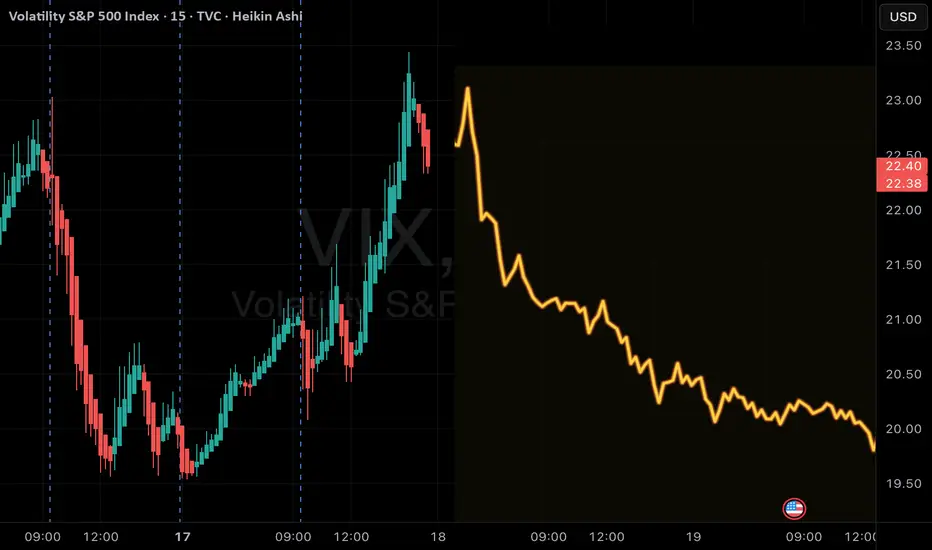
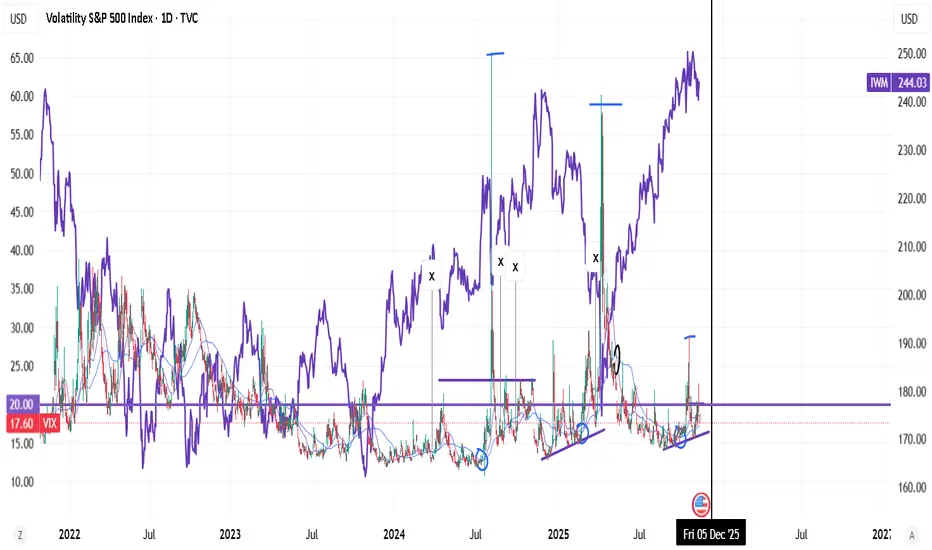
Upswingy VIX in patterns is bad for Small cap returns.Where VIX gets 10/20/50 upswings, goes in patterns (structure). it seems it's a bad period for small caps.
Also, rising $TNX. which is the case now .
x- stands for bullish weekly macds.
Using HLOW/LHIGH (Dow) + LOGIC to pinpoint probabilities.DOW Theory is the king of the stock market (Higher Lows, Lower Highs, uptrending, etc.) and it's quite basic concept to apply with logic.
Sometimes you can time the market (based on 50dma/200dma crosses, price extensions) and LHIGH dynamics and logic -> to pinpoint probabilities. Like, look at VIX dynamics during 2023/2024.
in short: DOW + LOGIC = PROBABILITY.
UVXY | Volatility Will Pop VERY Soon | LONGProShares Ultra VIX Short-Term Futures ETF seeks daily investment results, before fees and expenses, that correspond to one and one-half times (1.5x) the performance of the S&P 500 VIX Short-Term Futures Index for a single day. The index seeks to offer exposure to market volatility through publicly traded futures markets and is designed to measure the implied volatility of the S&P 500 over 30 days in the future.

VIX is telling you.....It's sometimes really simple.
And simple is powerfull.
When the VIX. just like a stock,
creates higher lows after higher lows
for at certain amount of X time/months,
sooner or later we get the explosion of the VIX.
Looking at a currently very overpriced stockmarket
right now, you don't need to be an expert to see what coming.
I didn't say exactly WHEN, but you KNOW it's coming.
It's only a question of time.
And that some event will become the needle that pricks the bubble.
Don't say you didn't see this coming, after is has happened.
They said the same back in 2009.
#VIX
#bearmarket

S&P 500 INDEX | Institutional Technical Analysis Masterpiece🔥 US500 S&P 500 INDEX | Institutional Technical Analysis Masterpiece | 6,843.7 🔥
📈 ELITE MULTI-TIMEFRAME BREAKDOWN | NOVEMBER 3-7, 2025 TRADING ROADMAP 📈
Current Level: 6,843.7 | Analysis Date: November 1, 2025, 00:54 UTC+4
Hello, TradingView community! 👋 The S&P 500 has been on an absolute tear, closing the week at a staggering 6,843.7 . The big question on everyone's mind is: Are we witnessing a final euphoric push before a correction, or is this simply a pause before the next leg up? This week, from November 3rd to 7th, will be critical.
Let's break down the multi-timeframe picture, blending classic theories with modern indicators to build a comprehensive trading plan for both intraday and swing traders. 🧠
═══════════════════════════════════════════════════════════════════
🎯 MARKET INTELLIGENCE EXECUTIVE SUMMARY
The S&P 500 stands at 6,843.7 , navigating a historic technical confluence zone that will determine the market's trajectory through year-end 2025. Our algorithmic and classical analysis fusion reveals bullish continuation potential with measured risk parameters. This week presents asymmetric opportunities as institutional positioning, technical patterns, and macro catalysts align for potentially explosive moves.
Critical Support Infrastructure: 🛡️
Immediate Floor: 6,820 - 6,830 (Algorithmic bid zone)
Secondary Base: 6,800 - 6,810 (Institutional accumulation)
Major Support: 6,750 - 6,770 (Weekly pivot nexus)
Ultimate Defense: 6,700 - 6,720 (Psychological fortress)
Resistance & Target Architecture: 🎯
First Ceiling: 6,860 - 6,870 (Intraday supply)
Secondary Wall: 6,900 - 6,910 (Round number magnet)
Breakout Zone: 6,950 - 6,970 (Pattern objective)
Major Extension: 7,000 - 7,020 (Psychological milestone)
═══════════════════════════════════════════════════════════════════
📊 WEEKLY TIMEFRAME (1W) - MACRO MARKET STRUCTURE
Elliott Wave Grand Architecture: 🌊
We're positioned in Minor Wave 3 of Intermediate Wave (5) within the secular bull market. The impulsive structure projects targets at 7,100-7,200 based on Fibonacci extensions. Critical validation: maintaining above 6,720 preserves the bullish count.
Primary Count: Wave 3 of (5) targeting 7,100
Alternative: Wave B of expanded flat, risk below 6,650
Invalidation: Weekly close below 6,600
Time projection: Completion by late November
Wyckoff Accumulation Schematic: 📚
Phase D - Markup Beginning
- Preliminary Supply (PSY): 6,920 tested
- Buying Climax (BC): 6,950 rejection
- Automatic Reaction (AR): 6,750 hold
- Last Point of Support (LPS): Current 6,843
- Sign of Strength (SOS): Pending above 6,870
Ichimoku Cloud Mastery: ☁️
Tenkan-sen: 6,815 (9-period support)
Kijun-sen: 6,780 (26-period base)
Senkou A: 6,850 (cloud top resistance)
Senkou B: 6,720 (cloud bottom support)
Chikou Span: Clear above price (bullish)
Cloud status: Thick and ascending
Advanced Harmonic Patterns: 🦋
Developing Bullish Gartley with precision ratios:
- XA leg: 6,500 to 6,950 (450 points)
- AB retracement: 0.618 at 6,672 ✅
- BC extension: Testing 0.786 at 6,845 (current)
- D completion: 0.786 XA at 6,850-6,870
- Target upon completion: 7,050-7,100
═══════════════════════════════════════════════════════════════════
📉 DAILY TIMEFRAME (1D) - SWING TRADING COMMAND CENTER
Japanese Candlestick Mastery: 🕯️
Yesterday's Doji Star at resistance signals equilibrium. Today's action critical:
- Close above 6,860 = Three White Soldiers continuation
- Close below 6,820 = Evening Star reversal warning
- Current bias: Neutral-bullish pending confirmation
Master Pattern Recognition:
Cup and Handle formation nearing completion:
- Cup low: 6,650 (October)
- Cup high: 6,920 (Recent peak)
- Handle forming: 6,820-6,870 range
- Breakout target: 7,190 (270-point measured move)
- Volume requirement: 25% above 20-day average
Bollinger Bands Configuration: 📊
Upper Band: 6,875 (immediate resistance)
Middle Band (20-SMA): 6,810 (dynamic support)
Lower Band: 6,745 (oversold boundary)
Band Width: Expanding (volatility increasing)
%B Indicator: 0.68 (upper half, bullish bias)
RSI Multi-Timeframe Analysis:
Daily RSI: 59 (room for upside)
Hidden bullish divergence vs price action
Support trend line from September intact
Resistance at 70 provides 11-point runway
═══════════════════════════════════════════════════════════════════
⚡ 4-HOUR TIMEFRAME (4H) - TACTICAL EXECUTION FRAMEWORK
Gann Theory Application: 📐
Current Gann Angles:
1x1: 6,825 (45-degree support)
2x1: 6,850 (current resistance)
1x2: 6,790 (major support)
Square of 9: 6,889 (next target)
Gann Box: 6,750-6,950 range
Time cycles: Nov 5 critical date
Dow Theory Confirmation Checklist: ✅
Primary Trend: Bullish (new highs achieved)
Secondary Trend: Consolidation/Correction
Volume Confirmation: Accumulation on dips
Breadth Analysis: 65% stocks above 50-DMA
Sector Rotation: Technology leading (bullish)
Transportation Confirmation: Pending
Moving Average Symphony:
- EMA 8: 6,838 (ultra-short support)
- EMA 21: 6,825 (short-term support)
- EMA 50: 6,810 (medium support)
- SMA 100: 6,785 (strong support)
- SMA 200: 6,750 (major trend support)
Pattern Alert: 🚨
Ascending Triangle resolution imminent:
- Horizontal resistance: 6,860-6,870
- Rising support: 6,820-6,830
- Apex convergence: November 4
- Breakout projection: 6,950+
═══════════════════════════════════════════════════════════════════
🎪 1-HOUR TIMEFRAME (1H) - PRECISION TRADING LABORATORY
Micro Pattern Development: 🔬
Double Bottom forming at 6,825:
- First bottom: 6,823 (10:00 UTC)
- Second bottom: 6,826 (14:00 UTC)
- Neckline resistance: 6,855
- Pattern target: 6,885 (30-point move)
VWAP Trading Matrix:
Daily VWAP: 6,841
Weekly VWAP: 6,825
Monthly VWAP: 6,795
Upper Band 1: 6,858 (first resistance)
Upper Band 2: 6,875 (second resistance)
Lower Band 1: 6,824 (first support)
Lower Band 2: 6,807 (second support)
Support & Resistance Precision Grid:
R4: 6,890 (Major resistance)
R3: 6,875 (Daily upper BB)
R2: 6,860 (Pattern neckline)
R1: 6,850 (Immediate resistance)
PIVOT: 6,843.7 (Current Price)
S1: 6,835 (Micro support)
S2: 6,825 (VWAP support)
S3: 6,810 (Major support)
S4: 6,795 (Monthly VWAP)
═══════════════════════════════════════════════════════════════════
⚡ 30-MINUTE TIMEFRAME (30M) - SCALPING COMMAND POST
Microstructure Analysis: 🎯
Bull Flag pattern developing:
- Pole: 6,810 to 6,855 (45 points)
- Flag consolidation: 6,835-6,845
- Breakout trigger: 6,846
- Target: 6,890 (45-point measured move)
Volume Profile Intelligence: 📊
POC (Point of Control): 6,837
VAH (Value Area High): 6,848
VAL (Value Area Low): 6,828
HVN (High Volume Node): 6,835-6,840
LVN (Low Volume Node): 6,855-6,860 (breakout zone)
Scalping Execution Zones:
Buy Zones:
• Zone 1: 6,835-6,838 (POC test)
• Zone 2: 6,828-6,831 (VAL support)
• Zone 3: 6,820-6,823 (Strong bid)
Sell Zones:
• Zone 1: 6,848-6,851 (VAH resistance)
• Zone 2: 6,858-6,861 (Supply zone)
• Zone 3: 6,868-6,871 (Major resistance)
═══════════════════════════════════════════════════════════════════
🏃 15-MINUTE & 5-MINUTE HYPERSPEED SCALPING
15-Minute Lightning Analysis: ⚡
Wedge pattern near apex:
- Upper trendline: 6,847
- Lower trendline: 6,839
- Breakout direction: 70% probability upward
- Quick target: 6,855 (+12 points)
- Stop: 6,835 (-8 points)
5-Minute Algorithmic Signals:
Long Entry Conditions:
RSI(5) < 30 AND Price > VWAP = BUY
MACD crossover AND Volume > Average = BUY
Price touches EMA(20) from above = BUY
Short Entry Conditions:
RSI(5) > 70 AND Price < VWAP = SELL
MACD crossunder AND High volume = SELL
Price rejected at resistance = SELL
Exit Rules:
Take profit: 8-10 points
Stop loss: 5-6 points
Time stop: 15 minutes max hold
Session Volatility Map: 🕐
Asian: 10-15 point range (quiet)
London Open: 20-30 point expansion
NY Premarket: 25-35 point volatility
NY Open: 40-50 point moves
NY Afternoon: 20-30 point consolidation
═══════════════════════════════════════════════════════════════════
📅 WEEKLY STRATEGIC FORECAST (NOVEMBER 3-7, 2025)
Monday, November 3: 🚀
Opening gap probability: 60% bullish
Strategy: Buy weakness to 6,830, target 6,870
Key levels: Support 6,820, Resistance 6,880
Expected range: 50 points
Tuesday, November 4: 🗳️
Election Day - Extreme volatility expected
Strategy: Straddle/strangle positions
Potential range: 6,750-6,920 (170 points!)
VIX spike likely above 25
Wednesday, November 5: 💥
Post-election directional resolution
Strategy: Trade the breakout aggressively
Bullish above 6,880 → Target 6,950
Bearish below 6,800 → Target 6,720
Thursday, November 6: 📊
FOMC minutes and economic data
Strategy: Fade first move, trade reversal
Expected consolidation: 6,850-6,900
Options gamma concentration: 6,875
Friday, November 7: 🎯
Weekly options expiration dynamics
Strategy: Theta decay trades around 6,850
Pin risk: 6,850 strike concentration
Weekly close above 6,870 = Bullish next week
═══════════════════════════════════════════════════════════════════
⚖️ INSTITUTIONAL RISK MANAGEMENT PROTOCOLS
Intraday Risk Framework: 🛡️
Position sizing: 0.5-1% risk per trade
Risk-Reward: Minimum 1:2.5 ratio
Daily loss limit: -2% portfolio max
Consecutive losses: 3 max, then pause
Profit trailing: 60% of maximum gain
Breakeven stop: At 10-point profit
Scaling strategy: 3 entries maximum
Swing Position Architecture: 💼
Core position: 50% at 6,820-6,830
Add-on levels: 25% at 6,800, 25% at 6,780
Stop loss: Below 6,750 (all positions)
Target 1: 6,900 (25% exit)
Target 2: 6,950 (35% exit)
Target 3: 7,000 (25% exit)
Runner: 7,050+ (15% hold)
═══════════════════════════════════════════════════════════════════
🔴 RISK SCENARIOS & CIRCUIT BREAKERS
Bearish Invalidation Levels: 🐻
15-min close below 6,835 = Micro caution
Hourly close below 6,820 = Intraday bearish
4H close below 6,800 = Swing bearish shift
Daily close below 6,750 = Trend reversal risk
Weekly close below 6,700 = Major bear signal
Tail Risk Considerations: 🦢
• Geopolitical shock (100+ point gap risk)
• Fed policy surprise (2-3% moves)
• Tech earnings disasters (sector rotation)
• Credit event contagion (systemic risk)
• AI bubble concerns (valuation reset)
═══════════════════════════════════════════════════════════════════
💎 ELITE CONFLUENCE TRADING ZONES
Premium Buy Zone: ✅
6,820-6,830
(Multi-timeframe support + Fibonacci 61.8% + VWAP + Moving average cluster)
Optimal Sell Zone: ❌
6,870-6,880
(Resistance confluence + Pattern targets + Round number + Options barrier)
Breakout Trigger: 🚀
6,870-6,875
(Triangle apex + Bollinger Band + Volume breakout zone)
═══════════════════════════════════════════════════════════════════
🏆 MASTER TRADER'S FINAL VERDICT
The S&P 500 at 6,843.7 presents a high-conviction bullish opportunity with exceptional risk-reward dynamics. Technical confluence across multiple timeframes, combined with constructive market internals and seasonal factors, supports upside continuation toward 6,900-6,950 initially, with 7,000+ potential.
Top 3 Highest Probability Trades: 🎯
Swing Long: 6,820-6,830 → Target: 6,950 (RR 1:4)
Breakout Long: Above 6,870 → Target: 6,920 (RR 1:3)
Scalp Long: VWAP 6,841 → Target: 6,855 (RR 1:2.5)
Trading Wisdom: 🧠
Position for probability, not possibility. Size for survival, not home runs. The best traders are risk managers who happen to trade.
"Markets can remain irrational longer than you can remain solvent. Trade the chart, not the opinion!" 💡
═══════════════════════════════════════════════════════════════════
📍 ACTIONABLE INTELLIGENCE SUMMARY
Bull market intact above 6,750. Accumulate dips toward 6,820. Target 7,000 by month-end. Risk management is paramount during election week volatility.
Trade with discipline. Prosper with patience. 💰
═══════════════════════════════════════════════════════════════════
#SPX #SP500 #US500 #TechnicalAnalysis #Trading #StockMarket #Indices #DayTrading #SwingTrading #ElliottWave #Wyckoff #HarmonicPatterns #OptionsTrading #VIX #MarketStructure #OrderFlow #InstitutionalTrading #AlgorithmicTrading #TradingView #MarketForecast #SPY #ES_F
🔔 Follow for Institutional-Grade Analysis | Precision • Discipline • Profits 📊
Disclaimer: This analysis is educational only. Trading carries substantial risk of loss. Past performance does not guarantee future results. Always conduct independent research and employ proper risk management.
