GBPCAD buy has just alerted 📲📳Trade details for current trade are shown on the chart.
We are working the 15M time frame on this strategy.
We're looking for the green line which is take profit target.
Little long arrow is entry point and purple line is stop loss.
Trade history can be seen at the foot of this trade idea too for full transparency.
------------------------------------------
I try and share as many ideas as I can as and when I have time. My trades are automated so I am not sat in front of a screen daily.
Jumping on random trade ideas 'willy-nilly' on Trading View trying to find that one trade that you can retire from is not a sustainable way to trade. You might get lucky, but it will always end one way.
------------------------------------------
Please hit the 👍 LIKE button if you like my ideas🙏
Also follow my profile, then you will receive a notification whenever I post a trading idea - so you don't miss them. 🙌
No one likes missing out, do they?
Also, see my 'related ideas' below to see more just like this.
The stats for this pair are shown below too.
Thank you.
Darren
15minchart

GBPAUD long valid and running 💪📈Another pair that's had a cracking week.
Trade details are shown on the chart.
We are working the 15M time frame on this strategy.
We're looking for the green line which is take profit target.
Little blue arrow is entry point and purple line is stop loss.
Previous trade shown on chart which hit TP and was covered in the idea below.
Lets see if this trade can repeat previous idea and find TP but markets will go where they want as traders we need to be comfortable with any trade out come.
I take comfort from knowing I'm trading a back tested proven strategy,
Trade history can be seen at the foot of this trade idea too for full transparency.
------------------------------------------
I try and share as many ideas as I can as and when I have time. My trades are automated so I am not sat in front of a screen daily.
Jumping on random trade ideas 'willy-nilly' on Trading View trying to find that one trade that you can retire from is not a sustainable way to trade. You might get lucky, but it will always end one way.
------------------------------------------
Please hit the 👍 LIKE button if you like my ideas🙏
Also follow my profile, then you will receive a notification whenever I post a trading idea - so you don't miss them. 🙌
No one likes missing out, do they?
Also, see my 'related ideas' below to see more just like this.
The stats for this pair are shown below too.
Thank you.
Darren

HDFC BANK 15MINNSE:HDFCBANK
yesterday HDFC BANK formed the symmetrical triangle in 15 min chart .
Ready for breakout buy above 1518 nd sell below 1510

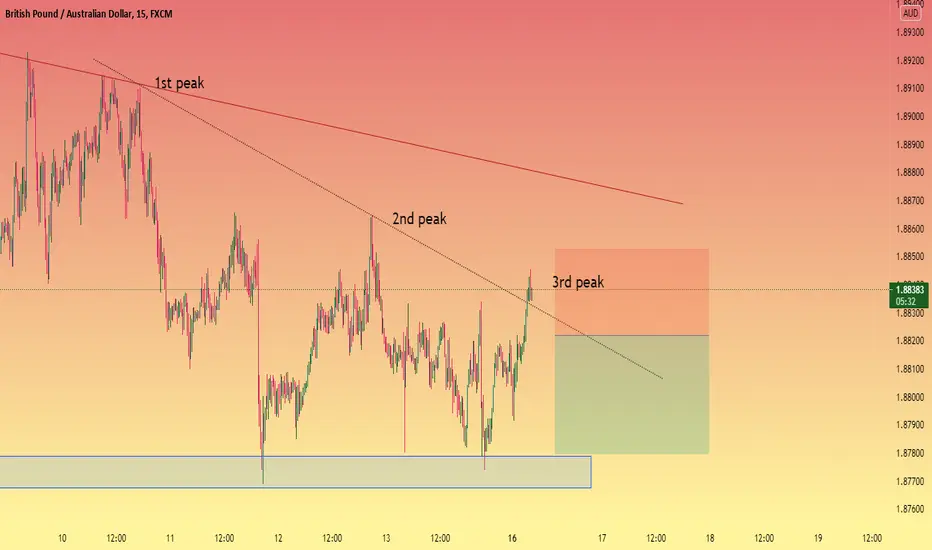
GBPAUD intraday 15 minute, get ready for sell entrythe price move below the minor trendline and now make a third peaks, watch if the price make an impulse bearish and fall down bellow 1.18217 then the next target will be on 1.87800 with the SL 1.18526 FX:GBPAUD
Theta in BULL pennant... don't miss this oneTHETA formed a nice bull pennant, continuation pattern that signals this could have more upside in near future... Set alarms for this one and don't miss it... BTC sudden dump could ruin this...


USDCAD: Bull run, over new support.USDCAD: USDCAD broke resistance line at 1.2175, and respected
nicely, started fresh bull rally, now became support level.
i tried to draw bullish trend channel (without higher low),
looking for long setup 1.2182,on lower level or trend channel.
it looks good for long setup, at newly formed support: 1.2175
(it could be big bet for marathon)
*trade channel based on hourly chart.
Technical- Based on S/R and trend channel :
- Next Resistance: 1.2246
- Support: 1.2175 (best buying price)
! leave feedback please.
Image-

ETHUSD: Broke bull trend lineETHUSD: ETHUSD formed bullish rally from 2480, and 2630 looks like resistance.
it retraced from resistance level again, and fresh bearish rally
started from here, broke 1 hr bullish trend line,
As per classic trend line breakout, looking for short setup at R: 2630
!!strong close above that price should be bullish move
*trade channel based on hourly chart.
Technical- Based on S/R and trend channel :
- Resistance: 2630, bearish rally point
- support: 2480
! leave feedback please.
Image-

BTCUSD: shorting in bull runBTCUSD: BTCUSD is in bull run, and 41k served as strong resistance. it retraced
from resistance level again. now looking for short setup on same price 41000.
if it made strong close above 41000, should be bullish move
! trade channel based on hourly chart.
Technical- Based on S/R and trend channel :
- Resistance: 41000, look for short setup near that.
- Support: 38700
! leave feedback please.
Image-

BTC to 47-50K ¿? Bullish Pennant formation in 15M TFCan BTC go to 47-50K zone? Well see if this pennant broke on the upside
Wait for confirmation, trade safe, market is volatile.

HCLTECH Partially Moving Downward for Sell Position( in 15 Mint)- Partially Moving Downward in 15 Mint Candel.
- Good Position for Sell call in Intraday.

US30 4.28.21 AnalysisHey everyone, This is my first published chart markup for US30. Feel free to any advice, questions, or comments. Thanks
Market analysis: Bearish.
Price is currently in my golden zone area. I am looking for price to possibly come back to the 50%, then selling off down to the 1.
Currently price is playing around my 38.2 cont. zone. so keeping my eyes on it right now. If price closes below my 38.2% and shows me a sell candle, that may be a good sell entry for me. If not then waiting for 50 or 618 retracement.
Background Info:
My trading team and I are currently doing a 3 pair challenge where we pick 1 fx pair, energy/metal and indice pair. us30 being mines.
First I want to start off by saying this is a indice pair which moves very fast for me. When I trade indices, I like to do quick snipe entries and exits. Trailing SL.
I markup support and resis. lines on the 1hr chart and then place my fib. on a 15min chart.
Looking for entries off the 15 or 5min chart.


#btc.d #15M #bitcoindominance #btcdominanceHi guys..its the latest analyze chart of BTC.D in 15M time frame .if you are interested any crypto that you want analyze with me and any questions please do not hesitate and comment below the chart!
if u like it press like-comment and folow me.thx

Today's Bitcoin Update | 15MBitcoin Update
Yesterday I told you that I expecting upside BO and we did see higher prices.
Today we have gap up opening and with another leg up. So expecting a Bull Trending Day again.
Since the open strength is good. Price is staying above the EMA and which is a good sign. Currently, There is a chance of testing the Breakout, Yesterday's High and EMA test. Price is struggling at Today's High currently, so the test to EMA, 36400 is expected. Might take a buy from that point but needs to get there first.
In scenario of weakening of Bull trend till the end of day then we might test the Open of the Day as Support, 3505.
Currently Wait to Long, Price might go sideways testing 36400. Scalp Inside the Trading Range (Sideways). Add onto you position if price breaks Today's High again.

(Bullish) ASCENDING TRIANGLE on Bitcoin 15 Minute chart.COINBASE:BTCUSD
The ascending triangle is a bullish continuation pattern and is characterized by a rising lower trendline and a flat upper trendline that acts as support. This pattern indicates that buyers are more aggressive than sellers as price continues to make higher lows. The pattern completes itself when price breaks out of the triangle in the direction of the overall trend.


US30: BUY OR SELL 612-808PIPS15 MINUTES TIME FRAME. CONSOLIDATION: 200 EMA AND PRICE HORIZONTAL TREND. WAIT FOR BREAK OF STRUCTURE AND RETEST (1 OR 5 MINUTES TIME FRAME) IF BUYING PUT STOP LOSS BELOW 200EMA AND ABOVE IF SELLING.

