200

USDCAD VERY GOOD LONG OPPORTUNITYUSDCAD has broken its downtrend line... It also has been hit a strong support level....Clear BUY/LONG signal.....

NZDUSD LONG OPPORTUNITYNZD/USD is in a upper trend. It also reached the 0.382 of a Fibonacci retracement as support.... After reaching that level, a bullish candle is forming....

Back @ That Top Resistance Line AgainAfter a ridiculous day, BTC has somewhat settled.
Xi said the magic words,
Trump continues to be less qualified then a carton of curdled milk to run our country
and our our (coincidentally) 4 month exactly lower trend line held intact.
Both the Upper Trend Line and an extension of the lower triangles support line were broken,
However our massive pull back has us position above the 200sma and the extended top resistance line from our previous triangle.
BTC most likely grinds away at the purple resistance line for day or 2 before volume forces another large move.
The Closer the 200 gets to that purple trend line the more likely we flag and continue higher,
Next resistance being the 10k psych and 10.9k from our last local high before the break down.

I love a good shorting opportunity when I see one!Manna has fallen from the sky; The Leprichaun has paid us all a visit, and the pot is overflowing

Z1P late 2019 analysisRecent reports from UBS may have contributed to the 20% crash in mid October allowing for a perfect buying opportunity. This position should probably be held for less than 3 months as the RBA is set to reform laws around the BNPL market.

Australia 200 long stop @ 6465 target @ 6712
if the trade moves against us 2nd position @ 6544 and 3rd position @ 6529

Bitcoin Dominance at Critical Level 70% Weekly Look#BitcoinDominance recently fell below the critical 70% level coinciding with the 200 MA Weekly Moving Average. Lets see if it can rally back above before sunday close or below the MA.

CSL at resistance will it retrace back to the fib levels?CSL is at resistance and looking to drop bigtime down to the retracement levels. The cyan box below is a possible long spot for csl

Profit Target Zone for TelstraTelstra has stayed true to the Fibonacci and support zones. We can expect to hit the .618 Fib zone then possibly retrace downwards back to support.

KNOWN CRYPTO CAVE 50 DAY 200 DAY TEST TEST KNOWN CRYPTO CAVE 50 DAY 200 DAY TEST TEST
Just checking to see if this works, haven't don this much before :)

#XRPUSDT Up or Down From Here?- Bullish break of the 200 DAY MA on great volume.
- Currently consolidating nicely above cluster of daily candle closes back in Dec. '18 and April '19
- Possible Bull Flag Formation short to -mid term and ascending triangle pattern.
- Still possibility to Retest 200 Day MA confirm as support if BTC Dumps

EURUSD: Triangle, Doji and Triple BottomTechnical: FX:EURUSD now playing in descending channel, triple bottom, Doji, playing below of 200 SMA. Let's see is it can break it.
Fundamental: ECB minute coming, will it need to see will there more hawkish or dovish


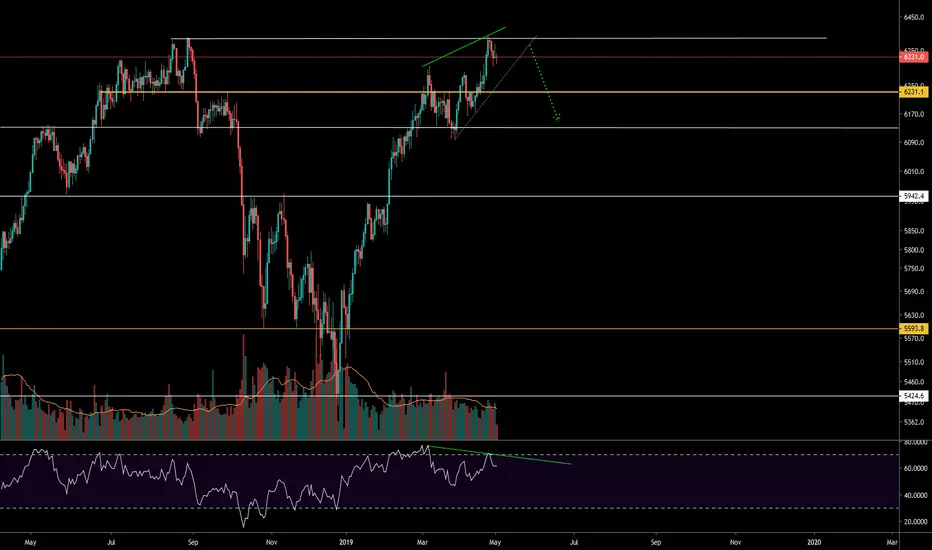
ASX 200 (AUSTRALIA) - Bearish Divergence + Double TopRemain cautious on the long-side given bearish divergence & the double top. Look to buy any pullbacks.
A positive China Trade Deal or interest rate cuts may see ASX 200 reach new ATHs.
200 DMA Failure Confirms Bear MarketNow that the indexes have broken out of the last major down channel (drawn in blue), the 200 day moving average (in purple) is the next major resistance. The S&P 500 has failed to hold above the 200 DMA three times since Oct 2018. Holding above the 200 DMA is the real test of being in a bull market or not--bull markets hold over the 200 DMA for extended periods while bear markets are rejected at the 200 DMA. Having another major market turn at the 200 DMA, (especially without having retested Dec lows or even built any significant resistance points on the way up) is going to look very BAD in my opinion. But the market is so over extended now I don't see how it can rally over the 200 day MA and hold.
So the market moves up, whistling bullishly, oblivious to the bear market confirmation it has primed itself for. This rally has been impossible to short, but going long now would be similarly doomed. So short at the next break under the 200 day MA, and watch as the market collapses.

Bitcoin Wave C & Wave 3 + Entry SignalsWe have a minimum wave c to 4253. Typical wave 3 to 5311 (Possible). This is a return to MA. Entry signals on Ergot and Bob Rooker indicators (Free indicators I've published here on TV). Ichimoku also in agreement. Let's see how it goes.

GBPUSD upside break underwayThe British pound has broken above the key 1.3095 resistance level against the US dollar after reports surfaced that the Irish DUP party now support British PM Theresa May’s amended Brexit deal. If the GBPUSD pair holds above the 1.3095 level, buyers could start to test towards the 1.3170 level. The overall short-term upside target for buyers is likely to be the August 2018 trading high, which is located close to the 1.3300 level.
The GBPUSD pair is strongly bullish while trading above the 1.3095 level, key technical resistance is now found at the 1.3170 and 1.3300 levels.
If the GBPUSD pair trades back under the 1.3095 level, a decline towards the 1.3030 and 1.2990 levels may occur.

EURUSD heavily bearish below 1.1300The euro currency is under heavy downside pressure against the US dollar on Friday after ECB President Mario Draghi struck a more dovish tone towards the eurozone economy at yesterday’s ECB policy meeting. A clear break below the 1.1300 level exposes the EURUSD pair to further technical selling towards at least the 1.1260 level. A bearish head and shoulders pattern is starting to emerge across the lower time frames.
The EURUSD pair is strongly bearish while trading below the 1.1300 level, key technical support is found at the 1.1260 and 1.1214 levels.
If the EURUSD pair moves above the 1.1360 level, buyers may test towards the 1.1380 and 1.1410 resistance levels.

ETHUSD remains vulnerable to lossesEthereum remains under downside pressure on Friday, amidst declining trading volumes and historically low trading ranges. Until a sustained break from the $110.00 to $125.00 price range occurs, narrowing trading conditions are likely to persist for the second largest cryptocurrency. The $92.00 level is likely to be sellers immediate target if the $110.00 level is broken.
The ETHUSD pair is only bullish while trading above the $125.00 level, key resistance remains at the 140.00 and $158.00 levels.\u2028
If ETHUSD pair trades below the $110.00 level, key support is found at the $100.00 and 92.00 levels.

EURUSD awaiting key manufacturing dataThe euro is starting to move higher against the US dollar in early Thursday trade, ahead of the release of key eurozone PMI manufacturing data later this morning. Weaker than expected PMI data from the French and German economies will likely reverse the EURUSD pairs recent recovery, with the 1.1335 level the key support level to watch. The 1.1410 level is the immediate resistance bulls need to break to encourage further technical buying.
The EURUSD pair is only bearish while trading below the 1.1360 level, key technical support is found at the 1.1335 and 1.1300 levels.
If the EURUSD pair holds above the 1.1380 level, buyers may test towards the 1.1410 and 1.1450 resistance levels.

GBPUSD bulls attacking major resistanceThe British pound has surged to its highest trading level against the US dollar since November 2018, after bulls easily broke through the 1.3030 resistance barrier on Wednesday. The GBPUSD pair now trades above its 200-day moving average and faces a key challenge from the 1.3095 resistance level. If bulls can move price above the 1.3095 level, further upside towards the 1.3170 level seems possible.
The GBPUSD pair is strongly bullish while trading above the 1.3030 level, key technical resistance is now found at the 1.3095 and 1.3170 levels.
If the GBPUSD pair falls under the 1.3030 level, a decline towards the 1.2990 and 1.2940 levels may occur.

BTCUSD sellers fail to capitalizeBitcoin is once again testing towards the $3,660 resistance level, after sellers failed to capitalize on the early week drop below the key $3,485 support level. The broader cryptocurrency market enjoyed a decent rally on Wednesday, although the BTCUSD pair added only marginal gains on the day. A break of the $3,300 to $3,960 price range is needed before the next short-term trend can be established.
The BTCUSD pair is only bearish while trading below the $3,485 level, key technical support remains at the $3,300 and $3,100 levels.
If the BTCUSD pair breaks above the $3,660 level, key resistance is then found at the $3,960 and $4,220 levels.
