Btc 105kClick bait title. Harmonic 5/0 pattern. Continuation pattern of downtrend. 74k there is a gap only one not filled on btc chart. So guessing 74k is big decision until closed.
5-0 Pattern

Sark into the 5-0Shark appears to have been completed at the 113 area of our top of the old high and reversed. Let’s see if we can get into the 5-0 toward 47200.

The Grayscale Ethereum Trust at Risk of Exacerbated DeclineETPs such as Grayscale's ETHE here utilizes APs (Authorized Participants) which are essentially broker dealers and large financial institutions such as banks, hedge funds and other investment firms to maintain liquidity of the Exchange Traded Product. These APs capitalize on the spread between the ETHE shares and the underlying product, in this case Ethereum, to make a yield through arbitrage.
Put simply, if demand for ETHE begins to rises above current supply, Authorized Participants can create new shares by depositing actual ETH with Grayscale. In return, Grayscale grants the AP newly minted ETHE shares. The AP then is able to list these shares on the secondary market where retail traders can buy them.
Historically these APs were able to mint new ETHE through this process of depositing ETH to Grayscale but they weren't able to redeem their ETHE shares back to ETH, however with the very recent onset of In-kind redemption and creation being permitted by the SEC , we are more likely to see a huge shift in the trend of redemptions.
Now that the SEC has enabled these in-kind redemptions, we could see these APs opt to redeem their ETHE shares for ETH just so they could sell said ETH on the open market or use it as liquidity for privately negotiated block trades on CME futures market during times of stress.
Say if there were sudden inflationary shocks, bond yields rose, or we had systemic banking risks, or even margin risk due to the underperformance of other sectors these institutions may have exposure to, we would likely see them let go of their riskiest assets first before resorting to selling other assets such as stocks and equities, especially those within the defensive categories. This would put Grayscales ETPs in direct danger of collapse as they lose liquidity from their APs and more importantly so it would put these underlying assets at risk of significant decline as the APs continue redeeming, adding supply to the open market, and selling.
This would not only result in negative pressure being put on the underlying assets but will also most likely result in Grayscales ETPs falling a significant amount more than the underlying due to the drainage off liquidity and the resulting widening of spreads. Asa result I think the end game for a lot of these crypto adjacent ETPs and Stocks will be that they go bust especially the leveraged products even including stocks like MSTR which effectively act as a leveraged exposure ETF to Bitcoin. In spite of this negative view I do have some optimism for XRP but overall I am quite bearish on the crypto market and all of the adjacent products being created from it.
In short: ETH along with BTC, which started out to as something to separate itself from the fiat banking system is now completely integrated and at the mercy of the fiat banking system along with all the macroeconomic risks that come with it.
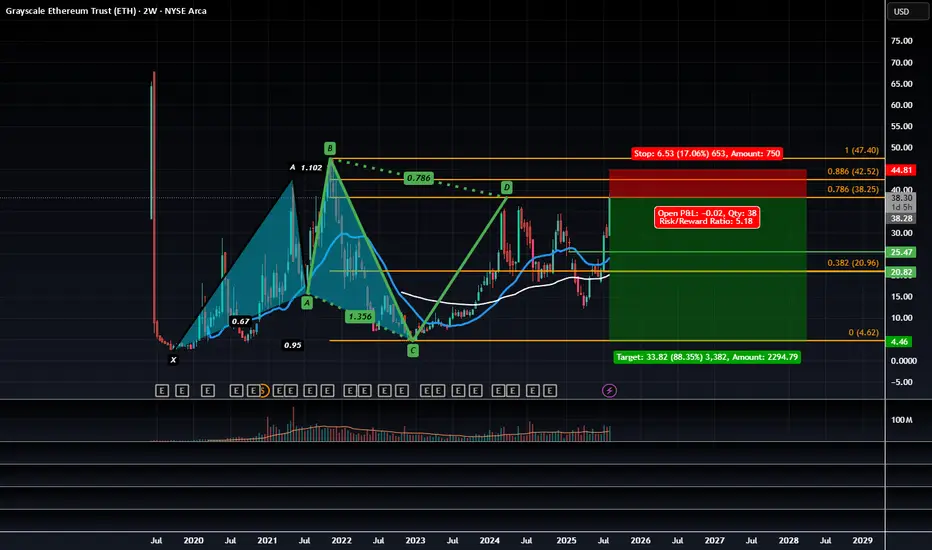
Technical Outlook for the Grayscale Ethereum ETP:
We have a Bearish 5-0 that is completing at the 0.786 retrace we've recently made higher highs but that was likely on the onset of the SEC news release from a couple days ago being interpreted at a bullish capacity, however as the news settles I think it will be more of a negative outcome and us trading to the PCZ off that news provides a good opportunity to sell call spreads and buy puts on ETHE here.
Ethereum Struggles to Complete above the 0.786 Bearish 5-0 ZoneWhile on the intra-bar price action on ETH has gotten pretty excited above the 0.786 it is still worth considering that ETH has not completed any bars above the 0.786 since the breakout and that at a moments noticed much of the current price action above the main 0.786 PCZ could later find itself being filtered out of the Renko charts as a whole depending on how many Average True Ranges above the 0.786 PCZ ETH possible move.
Based on the fact that the current candle is simply still in the projection phase I'd caution longs here and remain accumulative of longer dated puts. There is also a 2x leveraged ETF of ETH called ETHU which has OTM monthly call options trading at 20-40 dollar premiums. I'd consider farming off of those premiums in the form of Bear Vertical Spreads as a way to hedge off the costs of holding the long puts.
Overall, we are still trading at the PCZ of the Bearish 5-0 which seems to also be in the similar shape of a Bearish Head and Shoulders pattern; the measure move of which could take ETH down to around $355 upon the break of $1,600

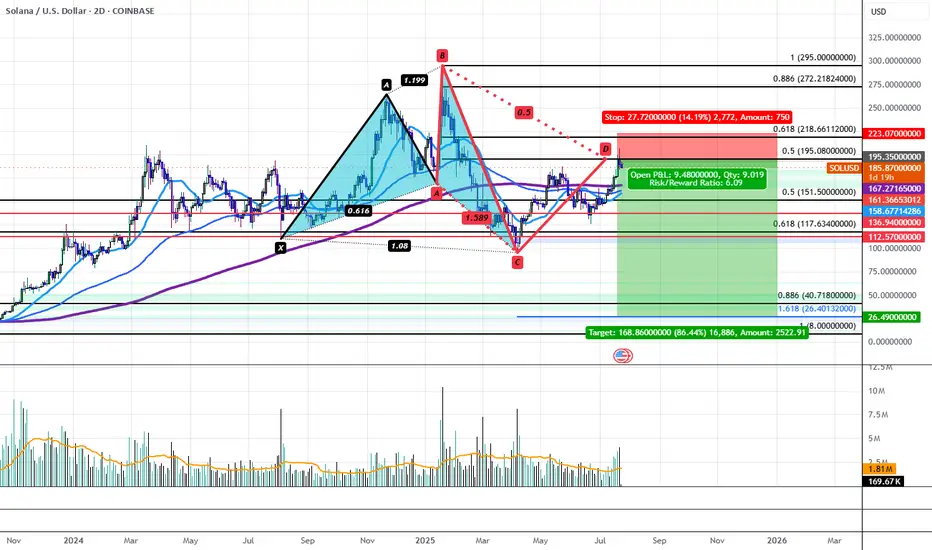
Solana's Bearish 5-0 is Locking in a Bearish Reversal to $26.40Solana has recently run up to Horizontal Resistance Zone of $195-$210 aligning with the PCZ of a Bearish 5-0 and has begun to impulse downwards with volume to back it. This could be the start of a greater move down that would take SOL back to the low of the distributive range at $95.16. If the level breaks, we would then target a drop down to the $40.72-$26.40 confluence area aligning with the all-time 0.886 retrace as well as the 1.618 extension from previous swing low to high. Only at these levels could we even possibly begin to consider Bullish Entries on Solana.
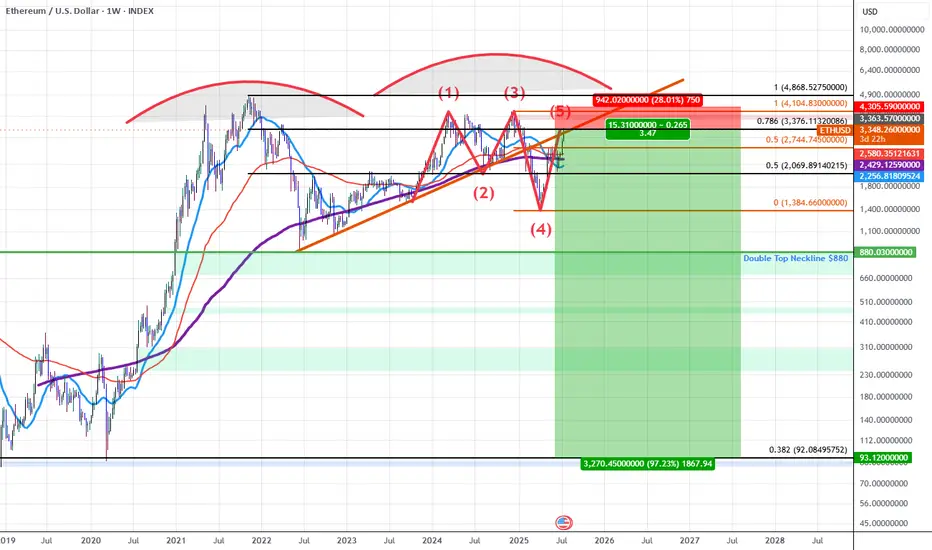
ETHUSD: Double Top into A Bearish 5-0 Breakdown (Extended)Updated Commentary: ETH has extended a bit further than projected as the Pattern Completed at the 0.618 but ETH gapped into the 0.786 instead. The gap up aligned with an upside gap fill on the CME futures as well as a gap fill on the grayscale ETH futures ETF $ETHE. The easier move from here to simply add to the ETH shorts and adjust the stop to be above the previous highs while sizing up at the 0.786 and playing off this gap higher as an anomaly. Beyond this, my view on ETH at the current 0.786 retrace remains the same as the original Idea posted as ETH rose into the initial 0.618 PCZ the details of which I will also include once again below as it still remains relevant.
ETH for the last 5 years has been developing a Double Topping pattern which has put in a series of lower highs during the most recent 2nd run up. As we've confirmed these lower highs we've broken down below trendline and are finding resistance at the trendline which happens to have confluence with the PCZ of a Bearish 5-0 wave formation near a 0.786 retrace.
As we begin to find weakness and Bearish price action begins I suspect price will make it's way towards the neckline of the double top aligning with the $880 price level if ETH breaks below that level there will be no significant support until it reaches the all-time 0.382 retrace down at around $92.10.
In short it seems ETH is in the early stages of a macro breakdown which could result in value declines greater than 80%.
I also suspect that we will see many of the assets that ran up significantly going into this week to sharply reverse those run-ups as this week comes to a close and the new week begins mainly due to the effects of OpEx, this includes: Bitcoin, MSTR, SOL, XLC, META, and BTBT. Long-dated Put accumulation on these assets at these levels is far easier to manage than naked short positions and that's how I will go about positioning here.

GBPJPY: Bullish 5-0 Setup on the 4-Hourly ChartFrom a higher-timeframe perspective, GBPJPY might seem like it's perfect for a shorting opportunity, but that doesn't mean there aren't great opportunities to go long as well.
Right now, on the 4-hourly chart, I've spotted an interesting Bullish 5-0 setup. To many traders, this might look like an invalid entry. But here’s the catch—if you know how to interpret candlestick patterns correctly, this is exactly the kind of setup that can pay off.
Here’s the Plan:
Bullish 5-0 Pattern Entry: Keep an eye on candlestick confirmations at the current zone.
Risk Management: Identify the key levels clearly—once price reaches these levels, shift your stops to entry to achieve a risk-free trade.
Key Reminder:
It’s not always about being right in direction; it’s about spotting clear entry setups, managing your risk effectively, and protecting your capital.
👉 Golden Rule: Secure a risk-free trade as soon as possible!
Have you traded the Bullish 5-0 before? Do you have similar experiences spotting opportunities against the broader trend?
Let’s discuss below! Happy trading, everyone! 🚀

Swimming Amongst SharksStarting with the boring range in February, BTC consolidated after making new ATHs on the day of President Trump's second term inauguration.
After a slow month of sideways action in February, we finally reached the apex of a symmetrical triangle and proceeded to dump, attempting at closing the breakaway CME gap @ ~76.5k. It quickly and violently bounced to 95k where we spent the next 51 days making new lows and ranging in the 80k region.
When we take a closer look at the fibonacci retracements of all of these moves, they are very technical.
When pulling a standard fibonacci retracement XA, we find that B falls perfectly within the golden pocket. Roughly 2 weeks later, we find ourselves at new range lows offering a very nice SFP reaction at point C which falls at the 1.272 fib expansion of AB.
In hindsight, this would have been the perfect place to get into a long position. But, unfortunately, I was looking for new lows around ~70k as this is where the 1.618 level was from a fib expansion of AB. This was during the time when tariffs were first being announced, causing major volatility across all markets. People were panic selling and calling for an economic crisis because of Donald Trump's tweets causing erratic behavior in markets.
We rally for the next 36 days offering no significant pullbacks to be able to get in on a long as it always seemed that we could get in on weakness as the rally produced a lot of SPs.
Now the BC expansion shows that we are nearing the end of this rally if this shark harmonic is to play out.
Waiting on confirmation of point D, but it is very possible that the high is in, and we start fulfilling this shark harmonic.
This would fall perfectly in line with the old adage "Sell in May and go away." or at least, first signs of weakness in May, and don't get chopped up.
There has also been a couple of potential events that could be classified as "black swan" that would affect the markets negatively like Coinbase announcing a user data leak, and Moody's downgrading of U.S debt.
Overall, we could see this shark harmonic be part of a HTF trend, coiling up before the next big move that breaks out near the end of summertime.
Always important to remember to practice proper risk management and that no trade is still a trade.

De.FiDEFIUSDT has now in the Major POC Zone and the price is at a Lower Low after accumulating for almost a year and will continue to accumulate in the next month, but for now, the price movement shows a 5 drive pattern plus the indicator shows a very significant volume for the past few months.
In addition, Decentralized Finance is now attracting the attention of retail investors because of the potential for governments to create regulations that integrate TradFi and DeFi to drive economic growth by utilizing technological advances.

XAU/USD $$$
This zone. The new zone is valid and with confirmation from the lower timeframe we can enter. If this zone is broken, gold can fall to the lower 4-hour area.
Price: 2763.500 and 2758

Nifty has technical potential to reach 20,300 by end of June'25With the current situation of Nifty and Global market, Nifty has formed 5-0 pattern.
There are following conditions that can lead Nifty towards 20,300 by end of June'25. There is a gap of 4th Dec'23 and potentially it can be filled.
Target1; 21840 If Nifty close below 23250 on Week Time Frame
Target2; 21000 and it will be strong support
Target3; 20300 to fill gap of 4th December 2023

SDL NZ On medium to long term buy watchlistCurrently in a restructure, small cap stock with good fundamentals i.e. profitable and current ration of 2.0
is a software based company so has the ability to scale quickly without large investment
Will be eyeing up a position around $0.42, with first target around $1.50 and possible exit around $2.45
This is a monthly chart so is a long term trade...
Option B could be sell enough to get original money back at $1.50 and reinvest elsewhere while holding the rest till $2.45 to cash in

EURUSDSave the idea! big pennant and small pennant plus 5 drive also confirm. hold sell from here in my opinion

A golden move by EURUSDA golden move by EURUSD almost half pennant pattern nearly completed waiting for the remaining parts and there is a beautiful 5-drive pattern complete and waiting for a short triangle breakout and everything goes in the same directions

Usd/jpy - 5-0 formation
I mentioned the possibility of a bullish cypher in the long term, but before that, the price may show an upward movement again with a 5-0 in the smaller time frame.

5-0 RetardioBullish 5-0 pattern forming on the 4 hour chart for Retardio. Looks like a good risk/reward trade to me.

IPL Investore Property Limited Thought it was interesting to see a Nen star pattern on a monthly chart
Personally the upside is not large enough as there are a couple of fundamental negatives which are putting me off this stock
Posting out of interest only...

$GCT Boom or bust time?NASDAQ:GCT I decided to become a creator today for NASDAQ:GCT #TradingView, which it is an avocatiton to foresee and extrapolate a price.

⚠️Bitcoin Analysis (Mix of Patterns)⚠️👋Hi, everyone. First of all, I apologize for the chart being busy, but I think all the lines and zones are needed to better understand it.
🏃♂️Bitcoin is moving in two descending channels : a ⚫️Black Descending Channel⚫️ and a 🟣Purple Descending Channel🟣 . Also, it is currently moving in the 🔴 Resistance zone($66,050-$64,520) 🔴and near the Upper line of the descending channel and 50_SMA(Daily) and Time Reversal Zone(TRZ) .
📈If we want to look at the chart from the point of view of the Classical and Harmonic patterns , Bitcoin has succeeded in breaking the lower line of the Symmetrical Triangle Pattern , and it seems that a Bearish 5-0 Harmonic Pattern is forming near the upper line of the 🟣descending channel🟣.
💡Before concluding, let's take a look at the Market Cap USDT Dominance% (USDT.D%) chart.
💡 USDT.D% broke the 🔴 Resistance zone(4.72%-4.53%) 🔴 as I expected and is currently pulling back to this zone, the pullback structure seems to be forming with the Falling Wedge Pattern , I expect USDT.D% to rising again and this It will cause another decline in the cryptocurrency market .👇
🔔I expect Bitcoin to start falling again based on the above explanation.
❗️⚠️Note⚠️❗️: An important point you should always remember is capital management and lack of greed.
Bitcoin Analyze ( BTCUSDT ), 4-hour time frame ⏰.
Do not forget to put Stop loss for your positions (For every position you want to open).
Please follow your strategy; this is just my Idea, and I will gladly see your ideas in this post.
Please do not forget the ✅' like '✅ button 🙏😊 & Share it with your friends; thanks, and Trade safe.


SPX500USD: Bullish 5-0 at 0.618 RetraceThe SPX is trading within a Broadening Top near the Demand Line of the pattern, aligning with the 0.618 Retrace after developing a Bullish 5-0 Harmonic Wave Structure. If it plays out we should get a Higher High within the range, which could take us to the Fibonacci Extensions above the current highs.

Buying Opportunity on NZDUSDThis week, I'm eyeing a potential buying opportunity on NZDUSD, and here's my trade plan:
1. Bullish 5-0 Pattern on Weekly Chart: The NZDUSD is currently in the zone of the Bullish 5-0 Pattern on the Weekly Chart, signaling a potential buying opportunity.
2. 4-hourly Chart Setup: The 4-hourly chart presents a candlestick confirmation at the Potential Reversal Zone (PRZ), indicating a possible entry point for long positions.
3. Confirmation with 3-Bar Reversal: Despite the candlestick confirmation at the PRZ, I remain cautious and will wait for further confirmation. I'm looking for a 3-bar reversal pattern, where the next candle closes above 0.6089 and retests the level at 0.6083 before considering a buying opportunity.
By waiting for the 3-bar reversal pattern, I aim to ensure a stronger confirmation of the bullish momentum before entering the trade.
What are your thoughts on NZDUSD? Feel free to share your trade plans and insights below!
Wishing everyone profitable trading ahead!
