ETH potential Ada & EveDouble bottom on the daily looks real on inverted chart. Neckline is 1700$
3174$ Will be tested as support. If this level does not hold we will retest 2200$.
Adam

Adam & Eve Bottom on BTCUSDThe pattern was formed at 15min on BTCUSD, with confirmation close to $56.600. Target price for the next movement after the confirmation will be around $58.800, following the 70% price rule for breakouts of this pattern

RUNEUSDT Adam & Eve Rune has formed Adam&Eve double bottom. After double bottoms generally a bullish trend starts but in Rune case double bottom pattern failed because market don't have enough momentum to break its resistance and as a result Adam&Eve double tops are formed but bearish trend isn't started yet after double top because market is in its support zone and testing both its support and resistance to start a new trend.
So now we have to wait for the next market move if the support is broken then we will face a bearish trend and wait for the next buying zone.
But if market break its resistance and makes its support at that zone as shown with red dotted line in chart then it will be the next buying point.

$ADA / USD -- Looking to confirm Adam n' Eve PatternHello Traders,
Cardano is doing everything she can at the moment to break resistance above $2.30-$2.40.
Breaking above the $2.36 & closing above would in my eyes, signify a potential move up to the $2.50-$2.75 range, before hitting another set of resistance.
The market as a whole right now has had a sentiment shift for the better, but as always, it's fickle, so set Stop losses and take some profits.
Good luck!

SLP broke out$SLP broke out from falling wedge and now head down to confirm broken resistance as support.
buy now.
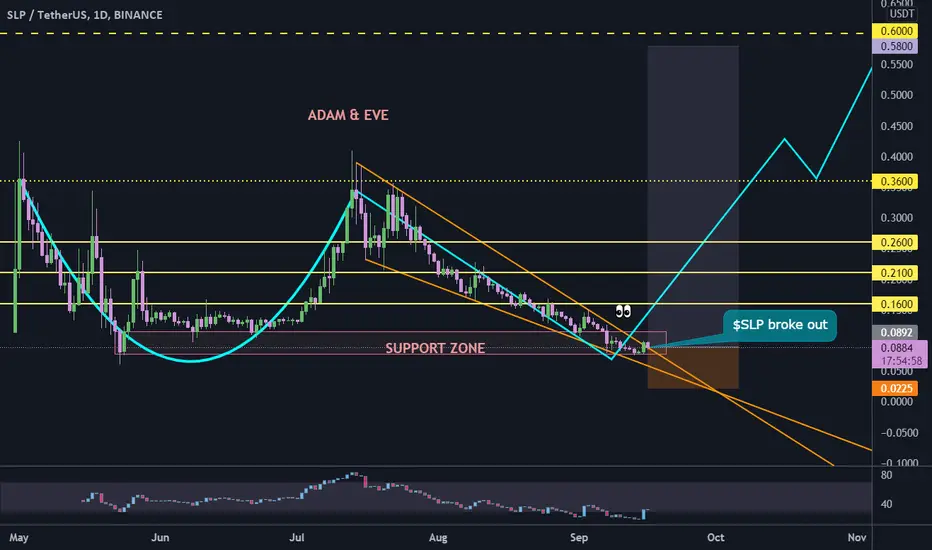
SLP falling wedge#SLPUSDT
$SLP is trading inside a falling wedge, wait for break out then buy.
I think it can make an Adam and Eve pattern!!


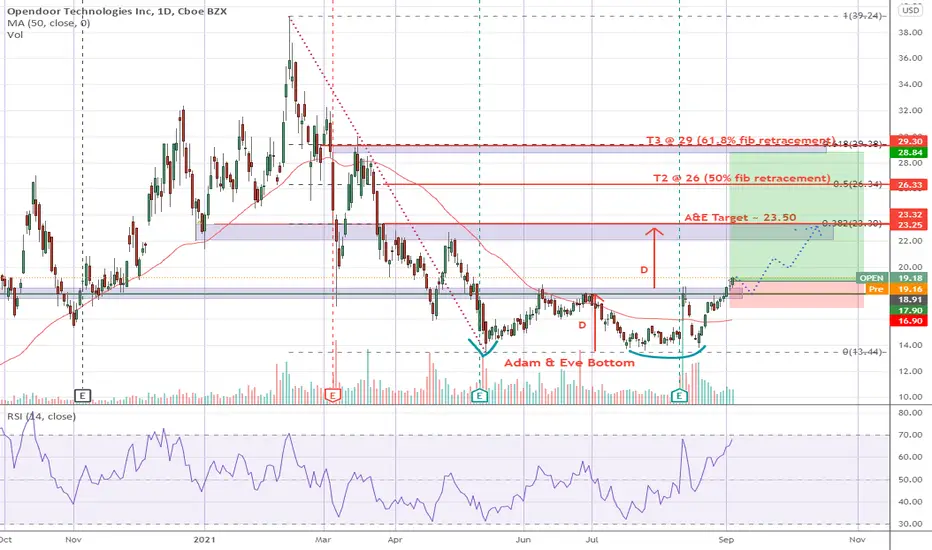
OPEN - Adam and Eve breakupAdam and Eve is a kind of double bottom. The entry is triggered as it breaks above the neckline of the pattern.
The expected A&E price target will be the equi-distance from the low of the A&E pattern to the neckline, projected up from the neckline ("D" on the chart), which brings it to about 23.50.
Initial stop loss will be placed just below 17 and I will trail the stop up when trade goes our way.
Disclaimer: TA is about improving our odds of a successful trade (not a guarantee). This is just my own analysis and opinion for discussion and is not a trade advice. Kindly do your own due diligence and trade according to your own risk tolerance and don't forget that money management is important! Thank you. Do give me a thumbs up if you agree. Feel free to let me know what you think! :)
PRE Adam&EveINSANE run up, 670% in just 2days. It funny correction of just 25%... We could use both of these facts. The herd will continue to pump it, or we will see a massive dump... Adam&Eve at this point looks so interesting that I had to draw this. I am eager to see the next move. Careful with this one. Good luck traders

$PLTR needs a weekly close over 25.94I am mega bullish on the stock. But I want confirmation on bullishness, and the best confirmations are closes above bear candles' high. We are forming an Adam and Eve bottoming pattern.
There is still a chance we make a handle, depending on the market price action. Or price just breaks 27.5 without any pullback. In which case I already have a position at an average $24.08
Both daily and weekly chart are on TD D-Wave 3. For those trading waves, entries are at wave 2 or at the break of high of wave 1.

ETC LONG SETUP | MIDDLE-LONG TERMNFI just for education.
Entry Price : 66.82$
Targets : 81.76$ - 88.25$ - 122.90$
If there is decline from 81.76$ take profit.
SL : 65$

$PLTR making an Adam and Eve bottomThis formation coincides with Wyckoff Accumulation Schematic #2. I have a position average $23.64

ATOM BULLISH - Adam & Eve pattern formation 1DVery bullish Adam and Eve pattern formation on the 1D for ATOM. Could see $17 soon…

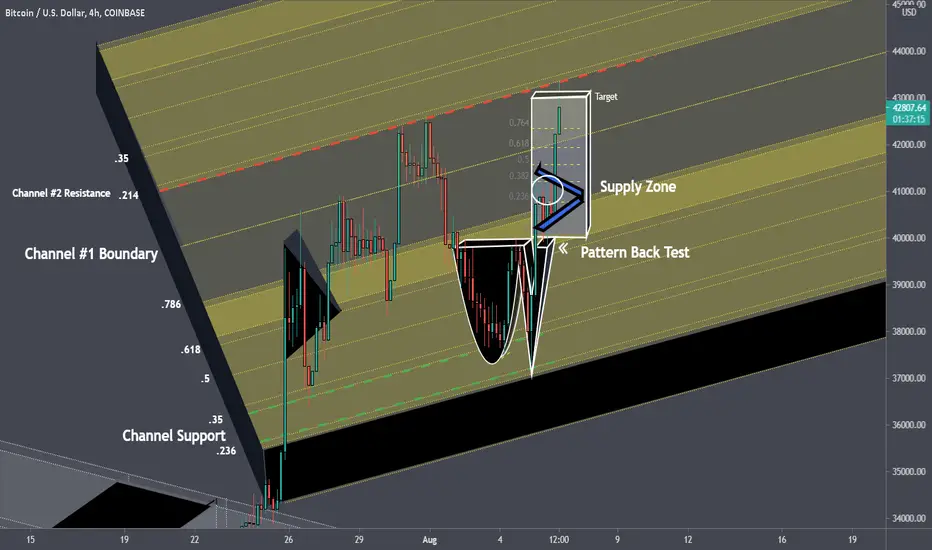
BTC - Inverted Adam and Eve Confirmedprice broke out of the supply zone to find resistance at Channel #2's .214. This is the new line in the sand and a triple top from the Channel perspective.
AAVE adam & eve or triangle#AAVEBTC
Weekly chart with adam & eve pattern
or triangle!
now price touched the resistance and backed down, but just one day till the end of this candle.
let's see 👀
$LINK: Pitchfork still providing clear S/R levelsHey yall. I think $LINK is looking really good here! We've seen a pretty clear A&E bottom with higher lows being created! As you can see the blue 1.0 pitchfork prong that acted as such strong support is now acting as a clear resistance! If we go back to re-test that 19.50 levels where we previously held and failed, I'd expect a bounce to above 20 and to continue our way back up!
Fundamentally SWIFT news and the amount of integrations and partnerships only continues to grow for Chainlink. Smartcon is coming. Super linear staking is coming. Any $LINK price under 50 dollars is a gift. I've been buying these last few weeks. Long term plan still intact.

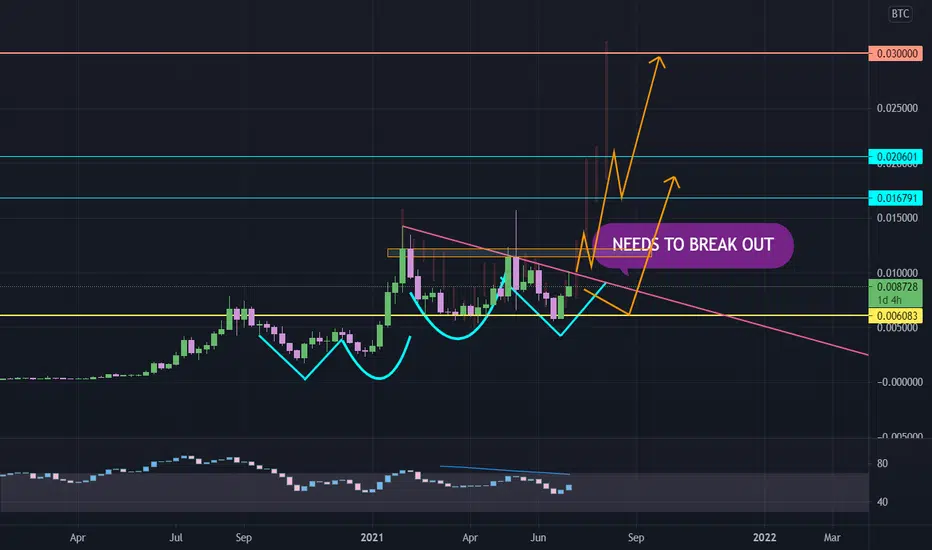
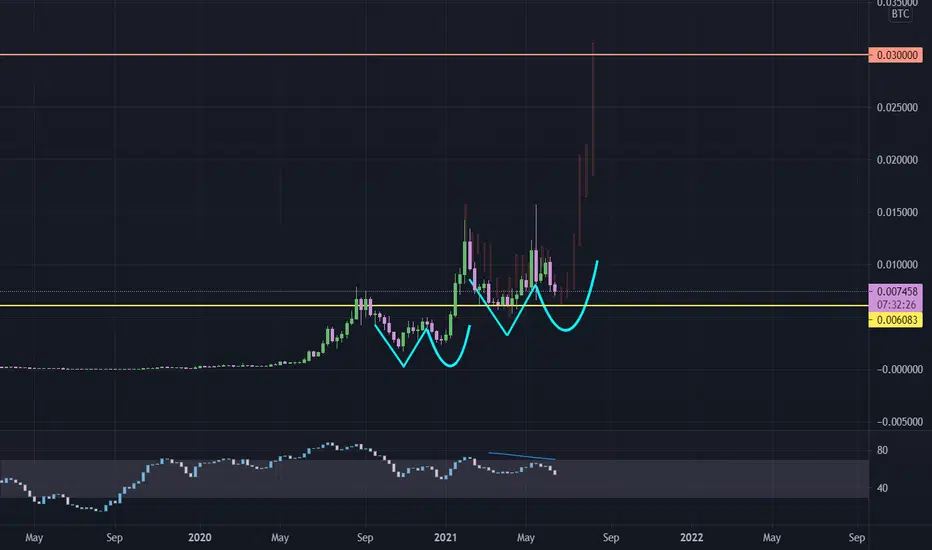
AAVEBTC adam and eve pattern#AAVEBTC
adam & eve pattern can increase price 300% to 0.03 sats
unless price won't close weekly below 0.006083 sats
Adam & Eve Double BottomsAdam & Eve Double Bottoms: Bull Market Results
Overall performance rank (1 is best): 17 out of 39
Break even failure rate: 12%
Average rise: 43%
Throwback rate: 67%
Percentage meeting price target: 69%
The double bottom confirms as a true double bottom once price closes above the peak between the two valleys. See the figure to the right. Without confirmation you do not have an Adam & Eve double bottom, just squiggles on a chart.
Source: (thepatternsite)

Fetch Adam and Eve HypotheticalsAdam is usually identified as a sharper price point
While Eve is more rounded
In this chart you can see two consecutive Adam's and then two consecutive Eve's
Interesting honestly
This current Eve formation will likely pose a reversal to the upside

AVAXBTC created an inverse Adam&Eve Pattern 🦐AVAXBTC created an inverse Adam&Eve Pattern, and the price broke the daily support. The price wants to test the next blue (daily) support.
According to Plancton's strategy (check our Academy), we can set a nice order
–––––
Follow the Shrimp 🦐
Keep in mind.
🟣 Purple structure -> Monthly structure.
🔴 Red structure -> Weekly structure.
🔵 Blue structure -> Daily structure.
🟡 Yellow structure -> 4h structure.
⚫️ Black structure -> <4h structure.
Here is the Plancton0618 technical analysis, please comment below if you have any question.
The ENTRY in the market will be taken only if the condition of the Plancton0618 strategy will trigger.

SKLZ - Will this Adam & Eve work out?Congrats if you had entered near it's Adam and Eve's bottom @ 12.50 (a 76% gain by now!). I am still bullish on it at the moment due to the mini bull flag that has formed in the past few days and finally a close above it's neckline @ 12.50 yesterday.
Let's see if the A&E target of $30 will materialise! Stop loss @ 18.90 for now.
Disclaimer: TA is about improving our odds of a successful trade (not a guarantee). This is just my own analysis and opinion for discussion and is not a trade advice. Kindly do your own due diligence and trade according to your own risk tolerance and don't forget that money management is important! Thank you. Do give me a thumbs up if you agree. Feel free to let me know what you think! :)

Adam&Eve , a hopeful outcome daily candle formed a "Adam & Eve" Pattern , as shown on the chart a breakout was made on yesterday candle and closed above the resistance line ,the next should be a retest of the new support at the previous resistance line . after holding a rebound should start the new uptrend .
--
ofc this isn't a done deal , we still need btc to climb .
so trade carefully and GL

Adam-Eve formation and resistance levelsHi traders,
It is shown in the chart that price may form an adam-eve formation. We are currently in a support level. Good point to enter.
Stay safe.
