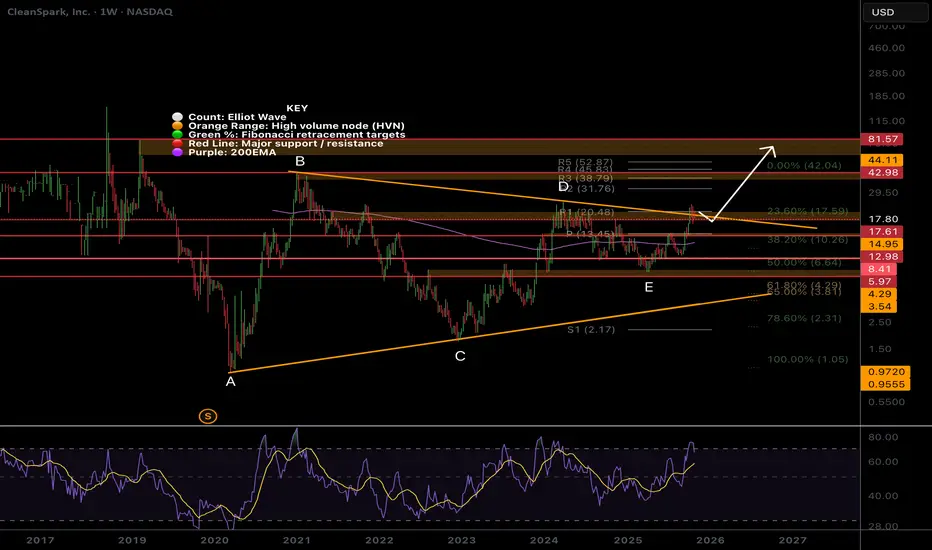
CLSK, Still much higher to goTheres a lot of fear in my comments across platforms due to the candle sizes. Participants need to understand the volatility of their holdings or face repeated mistakes and stress due to fear.
Price is attempting to breakout of the macro triangle upper boundary but was rejected. Breaking above wave D at $24 is key to trigger the next thrust I’m looking for towards $42 then $80 all time High Volume Node. Triangles are penultimate patterns found before a final strong move.
Price has momentum above the weekly pivot 200EMA but currently trapped in a High Volume Node where we expect price to stall before continuing upwards.
🎯 Terminal target for the business cycle could see prices hit $80- the all time High Volume Node
📈 Weekly RSI is oversold with no divergence and can remain here for months as price keeps increasing.
👉 Analysis is invalidated below wave E, keeping the triangle alive
AI
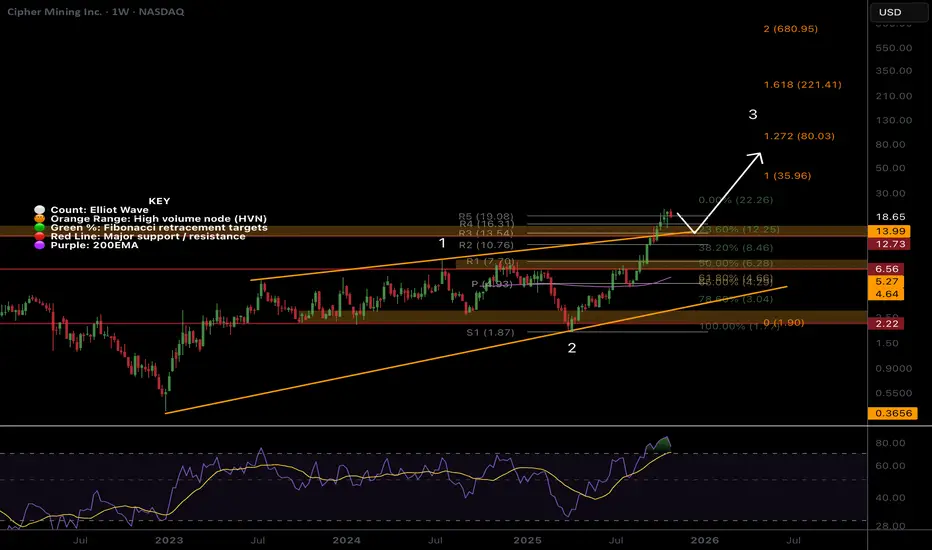
CIFR shallow pullback still on the cards!Price is in a macro wave 3, the strongest and most powerful move described as a “wonder to behold” by Ellioticians. When price is in a wave 3, pullbacks are shallow and few. Investors get overconfident and excited adding positioning without correct risk, swept up in the big move, aggravated by influencers and the media.
Testing the previous all time high at the 0.236 Fibonacci retracement and upper trend-line will be a strong support area and a place to look for a long, $14. While breaking out again into all time high could see price continuing its strong uptrend, this is doubtful as we have run the weekly pivots. Further downside has a target of the previous all time high and R1 pivot at $8.
📈 Weekly RSI is oversold with no divergence and can remain here for months as price keeps increasing.
👉 Analysis is invalidated below the weekly pivot and 200EMA ~$5
BTDR Nothing changedHuge daily candles are perfectly normal behaviour and nothing to be afraid of, we stay zoomed out to observe the larger trend to keep our emotions check. It is feature of these type of assets and is why we can make so much money from them when using the right risk management strategy.
Our first profit target has been hit at $25 all time High Volume Node where price is finding a range as some exit. Price has done 10x since the 2023 bottom. Once this range has worked itself out price is expected to continue upwards into price discovery. A retracement to the weekly pivot should be expected, where I will add to my positions and look for a long.
The macro structure is bullish in an Elliot wave ABC as there are many series of 3 wave structures. Wave (3) of C of (C) is underway with a target of the 1.618 Fibonacci extension $41.17. Price can significantly overextend in volatile assets with momentum and it’s these extremities we look to take secondary profit.
🎯 Terminal target for the business cycle is still the channel upper boundary and R3 weekly pivot at $55. A break out above this would be very bullish and could see prices as high as $80+
📈 Weekly RSI has months left of upside potential.
👉 Analysis is invalidated below wave B and 200EMA, $11.

Getty Images | GETY | Long at $2.29Bull Thesis
Data is "knowledge" for AI.
Getty Images NYSE:GETY holds immense importance in the generative AI race due to its control over a vast, high-quality library of over 500 million licensed images and metadata.
By licensing content (e.g., via deals with Nvidia), NYSE:GETY monetizes its assets, promotes responsible AI, and challenges open-source models.
Standardized license deals will boost AI's commercial viability and prevent a "wild west" of IP theft, ultimately accelerating safe deployment in industries like advertising and media.
The merger with Shutterstock will only help NYSE:GETY be the ultimate leader in this licensed data space.
Bear Thesis
The "wild west" of IP theft continues for years and the company's debt / poor fundamentals build until and ultimate collapse or acquisition.
Action
The bull thesis makes the most sense given the amount of data NYSE:GETY has and the future of data licensing deals. Now, I would love the price to go lower to accumulate more shares (under $2 is not out of the question in the near-term). But, at $2.29, NYSE:GETY is in a personal buy zone, and a starter position was made. More shares will be gathered in the $1 range if the earnings and revenue growth projections continue to look promising beyond 2025: www.tradingview.com
Targets into 2028:
$3.07 (+34.1%)
$5.00 (+118.3%)

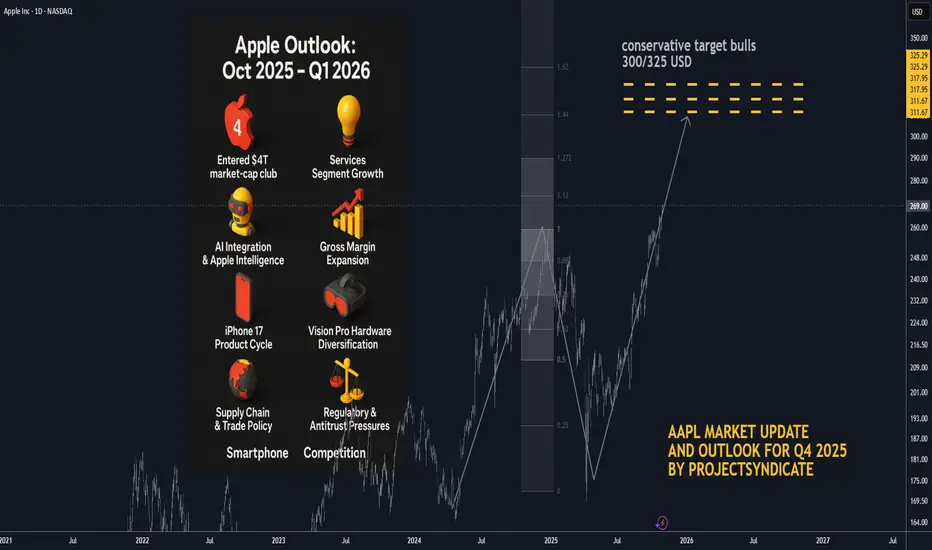
AAPL: Q1 2026 Target and Updated Outlook BULLS🍏 Apple Outlook: Oct 2025 – Q1 2026
🧠 Status and Tape Read. Apple (AAPL) has entered the $4 T market-cap club on Oct 28–29 2025, propelled by strong iPhone 17 sell-through and Services momentum. Shares pushed toward the $270 area intraday before easing, marking a powerful reversal from mid-year consolidation. Near-term, positioning is elevated into Thursday’s print; options imply ~±4% move on earnings.
📈 Path into Q1’26. Our base case shifts from a prolonged correction to a higher-low / buy-the-dip regime: dips toward the mid-$240s–$250s should attract sponsorship unless Services rolls over or China iPhone demand fades. A constructive tape through Q1’26 hinges on (1) Apple Intelligence engagement metrics, (2) iPhone 17 replacement/Android switcher rates, and (3) regulatory overhang.
📰 What’s New and recent headlines
🏆 Apple hits $4 T market value for the first time, joining Nvidia and Microsoft. Drivers: iPhone 17 traction and Services strength; stock up sharply since spring.
🗓️ Earnings set for Thu, Oct 30 (after-close); Street looking for growth in revenue/EPS; Services eyed >$100 B annual run-rate.
🔼 Loop Capital upgraded AAPL to Buy with $315 PT ahead of the move, citing iPhone cycle acceleration.
🧾 “Who Bought 8 Million Shares?”
🧺 JPMorgan Large Cap Growth Fund (SEEGX) increased its Apple position by ~8.15 million shares to ~32.9 million shares, per latest fund tracking.
⚙️ Catalysts Shaping Apple’s Stock Price in 2025–26
🤖 AI Integration & Apple Intelligence — Strength: 9/10
Rollout of on-device Apple Intelligence and upgraded Siri remains the core narrative into 2026. Look for user engagement datapoints and third-party app integrations at/after earnings. A positive read-through would validate the iPhone super-cycle argument.
💡 Services Segment Growth — Strength: 8.5/10
Consensus expects Services to push past a $100 B annual clip; durability watched versus regulatory pressure (DMA in EU, global app store scrutiny). A sustained >13% YoY growth print keeps multiple support intact.
📊 Gross Margin Expansion & Cost Efficiencies — Strength: 8/10
Management has guided 46–47% GM for FQ4 (tariff headwind embedded). Mix shift to Services + component deflation support FY26 margin resilience.
📱 iPhone 17 Product Cycle — Strength: 8/10 (↑ from 7.5)
Early sell-through outpacing prior gen in the U.S. and China within first days; the iPhone 17 (incl. “Air”) is the incremental driver restoring unit momentum.
🥽 Vision Pro & Hardware Diversification — Strength: 7/10
Next-gen devices + Apple Intelligence tie-ins create optionality; still niche near-term but adds ecosystem gravity.
💵 Capital Returns — Strength: 7/10
$110 B buyback authorization remains a floor; watch cadence vs. stock at ATHs and post-print cash deployment commentary.
🌏 Supply Chain & Trade Policy — Strength: 6.5/10
China exposure/tariffs remain a swing factor; Apple has been absorbing some costs rather than pushing through prices on key models.
⚖️ Regulatory & Antitrust Pressures — Strength: 6/10
DMA compliance and global app store cases could trim Services take-rate; monitor any remedial changes called out on the call.
📈 Macro & Rates — Strength: 5/10
“Higher for longer” limits multiple expansion; any disinflation/soft-landing upside would expand P/E support.
🥊 Smartphone Competition — Strength: 5/10
Android OEM velocity still high in EM; Apple’s cycle needs sustained switcher share to outrun.
💼 Earnings Set-Up: FQ4 reporting Thu Oct 30 2025
📅 Consensus into print:
• Revenue: ~$101–104 B (TipRanks ref: $102.2 B)
• EPS: ~$1.74–$1.82 (TipRanks ref: $1.78)
• Gross Margin guide: 46–47% (company indication)
• Services: watch for >$100 B annualized pace confirmation
• Implied move: options pricing ~±4%
🎧 Watch items on the call: Apple Intelligence activation/MAUs, iPhone 17 channel inventory, China mix, Services take-rate headwinds (EU), GM puts/takes (tariffs), cap-return cadence.
🎯 Street Positioning & Targets
🔼 Loop Capital: Buy, PT $315 (Oct 20/21 2025).
📊 General take: Many houses remain Overweight; focus turning to 2026 EPS power and AI monetization path.
🧭 Tactical View 0–3 Months
📈 Into/after print: Choppy but constructive. Chasing at ATHs is risky; prefer buy-on-weakness zones near $248–255 with stop discipline. A bullish guide/Services beat could sustain a breakout; a light AI engagement update or China wobble likely gets faded back into the mid-$250s.
⚠️ Risk-case: Regulatory headline or guide below mid-single-digit growth could quickly compress P/E and retest the $240s.
🚀 Bull-case: Clean beat/raise + AI usage KPIs → re-rate toward $290–300 into holiday.
🏁 Quick Milestone Recap
🥇 $4 Trillion Market Cap achieved on Oct 28–29 2025, making Apple the third public company (after Nvidia, Microsoft) to reach the level; iPhone 17 momentum and Services strength cited across coverage.
early signalThis Signal is being submitted early as I am in the process of moving house.
Use the numbers along the price yaxis and time xaxis for the signal details

AI bubble is just startingKeeping it very simple.
It looks like Tech just broke out of the trend to the upside similar to 2nd Stage trend of the Internet bubble.
Compounding factors
-debt cycle turned spiral
-AI circle economy/ Ponzi

Nvidia Just Under Major SupportNvidia seems to have been pulled down by the Dow just like Apple as both are just under major support. I'm sorry for my previous Nvidia chart that drew support near 140, I recognize where I screwed up, but this chart should be good. Fortunately actual 117 support wasn't that far below and my NVDA isn't too in the red.
NVDA has the lowest revenue multiple in years right now. I know it's well off it's long term trend line, but it's growth rate is unlike anything it's ever been so expecting a steeper trend line to appear makes a lot of sense. Eventually I would imagine we'll get back to that trend line, but not anytime soon.
The Dow hitting major support should finally lift NVDA and the others that have been dragged down like AAPL and AMZN.
Good luck!

Gold Market Update: Correction Mode 3750/3500 USD possible🟡 Where We Are Right now
After ripping to fresh records, gold snapped hard — WSJ logged the steepest one-day loss in years last week and a follow-through weekly drop as longs unwound.
Analysts across Kitco and others frame this as a technical/positioning correction after a parabolic run, with a fight around the $4k handle and scope to probe $3,750 → $3,500 if selling persists.
Sentiment/flows flipped: GLD and other gold ETFs saw notable outflows into the selloff after heavy YTD inflows. That flow reversal is consistent with a near-term correction phase.
🔻 Why the Market Is Correcting Now
1️⃣ Positioning & Froth Unwinds
The rally attracted outsized speculative length; once momentum cracked, forced de-risking kicked in. WSJ called out “long unwind” dynamics; Kitco says the correction could persist for months as near-term drivers fade.
2️⃣ $4k Failed on First Retest; Technical Break Triggered Stops
Kitco flagged a “fight for $4k” with downside risk if that shelf gives. Once sub-4k prints hit, systematic sellers likely accelerated.
3️⃣ Flow Flip in ETFs
After massive 2025 inflows, GLD posted a sharp daily outflow during the drop — classic late-cycle reversal behavior for a momentum move.
4️⃣ Macro Balance Less Supportive at the Margin
Even with long-term tailwinds (deficits/geopolitics), the recent leg higher ran ahead of fundamentals. Kitco and others note easing physical tightness and cooling central-bank buying pace compared with earlier in the year, removing a key prop for spot.
⚙️ Near-Term Levels That Matter (Tactical)
$4,000 → Battle zone. Regaining and holding above turns near-term tone neutral.
$3,750 → First meaningful downside target; aligns with multiple analysts’ “healthy pullback” zone.
$3,500 → Deeper correction magnet if flows/positioning continue to bleed; widely discussed as a plausible washout level.
🔮 4–8 Week Catalyst Map (What Can Push Price)
🏛️ Macro / Policy
Treasury Quarterly Refunding (Nov 5): Mix/size guidance can sway the long-end, USD, and real yields — key for gold. A heavier bill tilt (and steady coupons) is less threatening than a surprise coupon ramp.
Fed Communication Cadence: With the Oct 28–29 FOMC just occurred, watch minutes (Nov 19) + any guidance shifts. A less-dovish tone or firmer real yields = near-term headwind; growth scares or easing bias = support.
US Data Prints: CPI/PCE, NFP, ISM — anything that re-prices the path of real rates. (Direction of real yields remains the single most important macro input.)
💰 Flows & Positioning
ETF Flows (GLD/IAU): Continued outflows would confirm distribution; a turn back to net inflows often leads price inflections.
COT Positioning: If spec length compresses materially, downside fuel diminishes — setting up a cleaner base. (Track weekly CFTC updates.)
🪙 Physical / Seasonal
India Demand (festive/wedding season) and China retail demand can stabilize spot if discounts narrow and premiums re-emerge, but Kitco notes near-term tightness has eased versus the squeeze earlier in the rally.
📈 Base Case Outlook (Next 4–8 Weeks)
Trend: We’re in a bull-market correction — momentum currently with sellers — inside a bigger, intact secular uptrend. WSJ + Kitco both frame it as a technical consolidation after a near-vertical ascent.
Range Expectation: $3,500–$4,100 with whipsaws around $4k. The market likely tests $3,750 and could overshoot to $3,500 on negative macro surprises or persistent outflows before attempting a higher-low base.
Bull Re-acceleration Triggers:
(a) USD/real-yield rollover post-Refunding/Fed minutes
(b) A visible reversal in ETF flows
(c) Stabilization in Asia physical premiums
(d) Fresh geopolitical shocks
Bear Extension Risks:
(a) Firmer real yields / stronger USD
(b) Deeper ETF outflows and CTA/systematic supply
(c) Evidence of slower central-bank demand than H1
(d) Soft physical uptake into dips
⚔️ Trade / Hedge Tactics
If Underweight/Flat:
Stagger bids $3,760 → $3,520, scale size smaller into weakness; insist on confirmation (stops above prior day’s high) before adding.
If Long From Higher:
Respect $3,750 — below it, tighten or partially hedge (short miners, long USD vs. FX beta, or buy short-dated puts) targeting $3,500 as a potential flush.
If Momentum Trader:
Let $4,000 decide regime. Sustained reclaims with rising on-balance volume/ETF creations = green light for a bounce to $4,080–$4,150; failure = fade rallies into $3,950–$3,980.
🧭 What I’m Watching Day-to-Day
1️⃣ Treasury refunding headlines (Nov 5) and term-premium reaction.
2️⃣ Fed minutes (Nov 19) and any shift in balance-of-risks language.
3️⃣ GLD/IAU flow tape (creations/redemptions).
4️⃣ Kitco/WSJ desk color on physical tightness and dealer inventories.

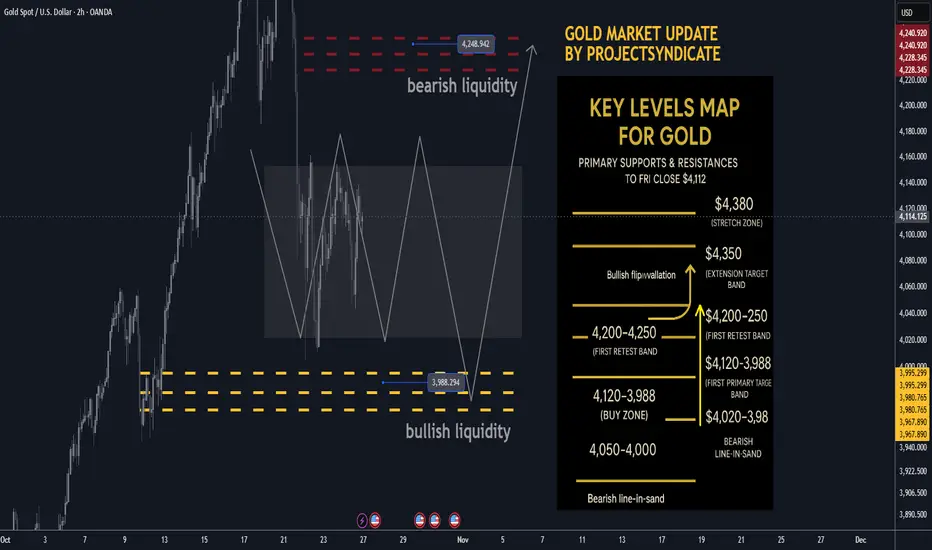
Gold next week Key S/R Levels and Outlook for Traders🔥 GOLD WEEKLY SNAPSHOT — BY PROJECTSYNDICATE
🏆 High/Close: $4,380 → ~$4,112 — lower close within range; momentum cooled but holding the $4,000 handle.
📈 Trend: Uptrend intact > $4,000; oversold into $4.1k—setup favors reflex bounce.
🛡 Supports: $4,120–$4,080 → $4,020–$3,988 (bullish liquidity) → $4,000/3,980 must hold.
🚧 Resistances: $4,200 / $4,250 (bearish liquidity) / $4,300 → stretch $4,350–$4,380.
🧭 Bias next week: Buy-the-dip $4,020–$3,988; momentum regain above $4,200 targets $4,250 → $4,300–$4,350. Invalidation < $3,980 risks a deeper flush to $3,950.
🌍 Macro tailwinds:
• Policy: Easing real yields supportive on dips.
• FX: Softer USD tone = constructive backdrop.
• Flows: Central-bank buying + tactical ETF interest underpin $4k.
• Geopolitics: Trade/tariff & regional tensions keep safety bids alive.
🎯 Street view: Select houses still float $5,000/oz by 2026 on policy easing & reserve-diversification narratives.
________________________________________
🔝 Key Resistance Zones
• $4,200–$4,230 immediate supply from the weekly close
• $4,250 bearish liquidity / primary target
• $4,300–$4,350 extension band
• $4,380 prior spike high / stretch
🛡 Support Zones
• $4,120–$4,080 first retest band below close
• $4,020–$3,988 buy zone (bullish liquidity)
• $4,000 / $3,980 must-hold shelf
________________________________________
⚖️ Base Case Scenario
Expect pullbacks into $4,120–$4,080 and $4,020–$3,988 to attract buyers, rotating price back toward $4,200 then $4,250. Acceptance above $4,250 invites a drive into $4,300–$4,350.
🚀 Breakout Trigger
A sustained push/acceptance > ~$4,250 unlocks $4,300 → $4,350, with room toward $4,380 if momentum persists.
💡 Market Drivers
• Real-yield drift lower (supportive carry backdrop)
• USD softness aiding metals
• Ongoing CB accumulation; ETF flows stabilizing on dips
• Headline risk (trade/geopolitics) sustaining safe-haven demand
🔓 Bull / Bear Trigger Lines
• Bullish above: $4,020–$4,100 (buyers defend pullbacks)
• Bearish below: $3,980 (risk expands; threatens $3,950)
🧭 Strategy
Buy low from bullish liquidity (~$3,988) with a target at $4,250; oversold conditions favor a strong bounce. Add on strength above $4,200 toward $4,300–$4,350. Keep risk tight below $3,980–$4,000 to invalidate.
From Fallen Giant to Trillion-Dollar Titan — "BlackBerry"From fallen giant to future trillion-dollar titan.
The world forgot BlackBerry… but smart money didn’t. 👀📈
Once the undisputed king of smartphones, BlackBerry (BB) collapsed under the weight of innovation it helped create. But while the world moved on, BlackBerry quietly evolved — transforming from a phone maker into a global cybersecurity, AI, and IoT powerhouse .
Now, the charts and fundamentals whisper the same story: the comeback may already be in motion. 📈🔥
🧠 The New BlackBerry: The Silent Infrastructure of the Digital Age
🔒 Cybersecurity Backbone:
BlackBerry’ s Cylance AI secures over 250M+ endpoints worldwide — protecting enterprises, governments, and critical systems. As AI-driven cyber threats rise, BB’s advanced detection tech is becoming a necessity, not a luxury.
🚗 Automotive Intelligence (QNX):
Over 235M vehicles already run on BlackBerry QNX , trusted by automakers like BMW, Ford, Toyota, and Volkswagen. QNX isn’t just car software — it’s the operating system for the connected vehicle future . With autonomous mobility on the rise, every car is a potential BlackBerry endpoint.
☁️ IoT Expansion with AWS:
Through BlackBerry IVY , co-developed with Amazon Web Services, BB is redefining how vehicles and smart devices share data securely. As the world connects billions of devices, BB could become the security standard behind the Internet of Everything. 🌐
⚡ The Technical Confluence — Smart Money & Wave Theory Alignment
🌀 Elliott Wave 2 correction nearing completion — exhaustion where disbelief reigns.
⚡ Wave 3 ignition potential: historically the most powerful and extended wave.
💰 Smart Money footprints: liquidity sweeps, BOS, and accumulation in key zones hint at institutional accumulation.
📏 Fibonacci 0.786 retracement and 1.618–2.618 extensions align perfectly with historical reversal levels — high-conviction confluence for a generational setup.
This is the phase where patience pays and noise fades .
💎 The Macro Mirror — History Doesn’t Repeat, But It Rhymes
Every great tech story began in disbelief:
NVIDIA (NVDA) was once a $3 stock before AI made it a trillion-dollar icon.
Tesla (TSLA) was ridiculed before redefining transportation.
Palantir (PLTR) quietly built data infrastructure before Wall Street caught up.
Now BlackBerry stands at a similar inflection — undervalued, under-owned, and misunderstood .
It’s no longer about phones — it’s about owning the digital nervous system of the future .
📅 Accumulation: 2024–2028
🚀 Expansion: 2029–2044
🌕 Euphoria: 2045+
"The world once held BlackBerry in its hand. Soon, it might hold the world in its network."🌍✨
Traders!
💬 What do you think — is BlackBerry quietly preparing to shock the world again? — Team FIBCOS
#BlackBerry #ElliottWave #BB #SmartMoney #Fibonacci #IoT #Cybersecurity #AI #LongTermInvesting #TechRebirth #TradingView #ComebackStory

Qualcomm new AI chips*Qualcomm made new AI chips called AI200 and AI250:
- After this news, Qualcomm’s stock price went up by 12%.
- These chips help Qualcomm join the AI data center market and compete with big companies like Nvidia.
- Qualcomm’s profits are strong, and it is managing costs well.
- The company got its first customer, called HUMAIN, for these AI products.
- Experts think Qualcomm has good future potential, even if some numbers are mixed.
And technically
We are around the middle of a long-term channel
and regarding the mid-term chart,
We have 3 great zones to enter the market,
both for investing and trading

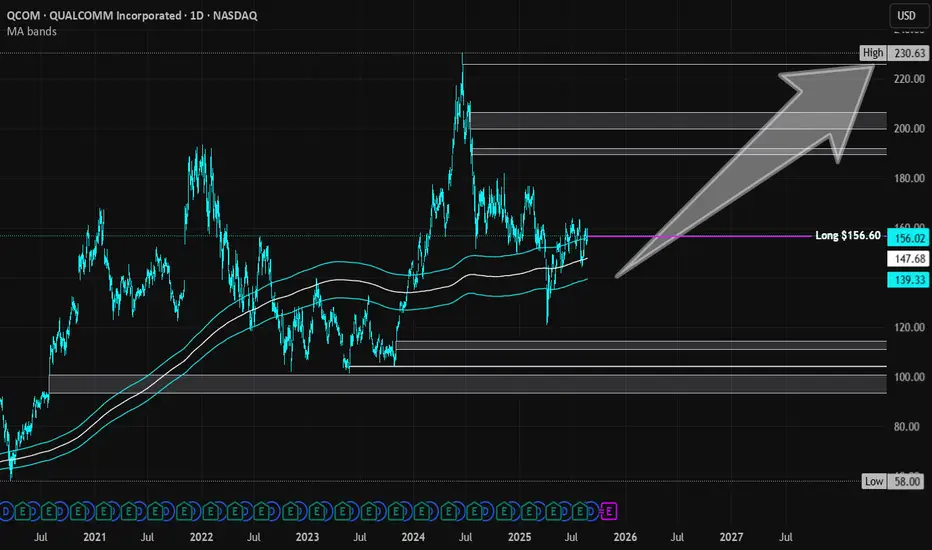
Qualcomm Inc | QCOM | Long at $156.60Qualcomm NASDAQ:QCOM is a global leader in wireless technology, focusing on 5G chipsets, AI-capable Snapdragon processors, and connectivity solutions for smartphones, IoT, and automotive. Revenue through 3 quarters of 2025 is ~$40B. Revenue growth is anticipated to be 10-12%, year over year (2026: ~$45B; 2027: ~$50B; 2028: ~$56B). 5G adoption, AI chip demand, and automotive needs should continue to drive the stock price. Earnings per share are projected to grow 12-14%, year over year (2026: ~$11.20; 2027: ~$12.80; 2028: ~$14.70). Thus, the future looks quite bright for NASDAQ:QCOM .
Regarding price, it is currently trading at a PE of 15x and has a 2.25% dividend. The price is resting just above my historical simple moving average channel. I do anticipate it to drop into the channel (down in the high $130's-$140's) in the near-term due to typical September selloffs. However, I plan on adding more in the zone. A major bear case would be a major drop into the $90's to fill the price gaps on the daily chart before moving higher. I do not think this will happen unless a major catalyst in the market emerges - but always be prepared. Regardless, it is a strong company providing products and services that are in high demand. Currently fairly valued, I believe it become undervalued as the demand for 5G and new phone chips with AI capabilities emerges.
Thus, at $156.60, NASDAQ:QCOM is in a personal buy zone with a likely near-term drop into the $130's and $140's.
Targets into 2028:
$191.00 (+22.0%)
$225.00 (+43.7%)
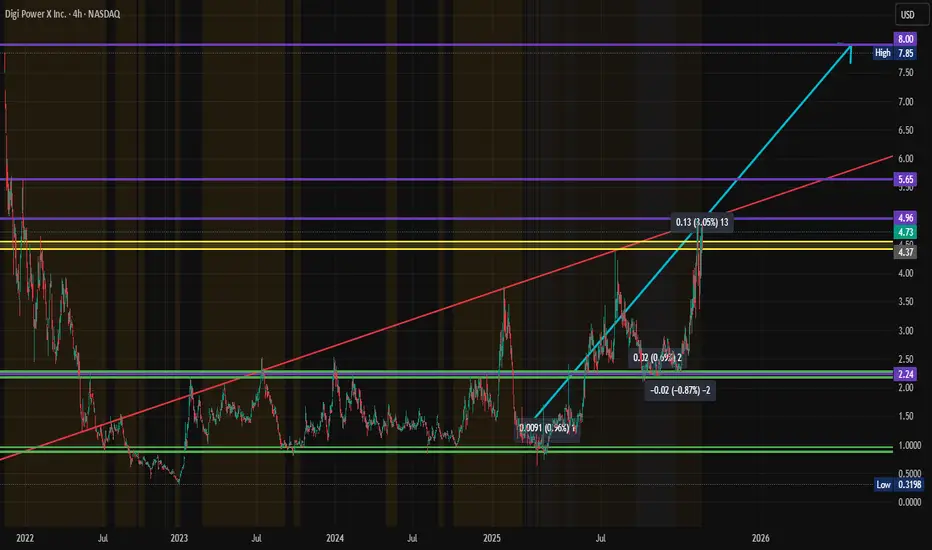
$DGXX - Digi Power X - $8PTNASDAQ:DGXX has been churning through this $4.42-$4.56 Level of Resistance, continuing on to push through the Higher $4.96 Levels. We're currently on pace to hit $5.65 and on to the $8.00 PT.
RECENT NEWS:
MIAMI, Oct. 21, 2025 (GLOBE NEWSWIRE) -- Digi Power X Inc. (“Digi Power X” or the “Company”) (Nasdaq: DGXX / TSXV: DGX), a U.S. developer of Tier III-grade high-performance computing (“HPC”) infrastructure, announced today that it is expanding its AI data center capacity with the addition of five new ARMS-200 GPU modules, scheduled to come online at its Columbiana, Alabama facility in March 2026.
MARA Strong breakout incomingNASDAQ:MARA is stalling at the weekly pivot as expected but is above the 200EMA. Wave (II) appears complete at the 0.5 Fibonacci retracement with a swing below the lower boundary trend-line.
Wave 3 of (III) appears to be underway so I am looking for an aggressive breakout to the upside once we clear the current resistance. The R1 pivot is the first target at $30 where the last bit of major resistance before the stronger breakout should come in, the High Volume Node.
Wave (III) has a target of $83 at the next major High Volume Node resistance, just above the R5 pivot.
Analysis is invalidated if we fall below $10. RSI is at the EQ with plenty of room for upside
Safe trading

IREN Exhausted? PUllback time?IREN wave (3) ran incredibly and I am looking for a deeper pullback as people begin to take profit. I have closed my positions at a 10x and am waiting for re-entry. The weekly pivots have been ran, RSI is at max overbought but can remain here for months (as it has done).
Initial downside targets for wave (4) is the 0.236 Fib retracement at $39 followed by the 0.382, $26.43. Expect shorts to pile in adding to any downside momentum.
In the long term I believe we have much higher to go towards $100 in wave (5).
Safe trading

CLSK, nothing changed, $40+ incoming, 2x minNASDAQ:CLSK is low cap asset and is prone to large volatile swing like we are seeing but also gives way to opportunities.
Price is attempting to breakout the macro triangle upper boundary was rejected at first. Breaking above wave D at $24 is key to trigger the thrust I'm looking for towards $42 and $80 all time High Volume Node after that.
Price has momentum above the weekly pivot 200EMA but currently trapped in a High Volume Node where we expect price to stall before continuing upwards.
RSI can stay in overbought for months.
Participants are still afraid of this asset coming against them and its volatility, a reflection of the broader sentiment of FEAR in retail that is still persisting at all time high. Ridiculous bear market PTSD.
A recipe for MUCH higher. until market wide confidence takes hold.
Safe trading

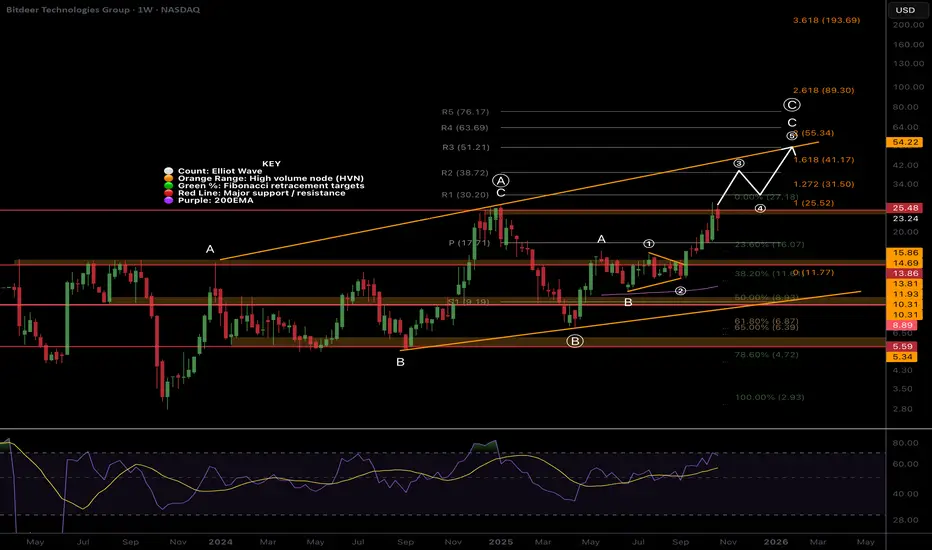
Bitdeer BTDR Macro Outlook. Nothing changed, Min 2x to come $54NASDAQ:BTDR is a low-cap volatile asset so traders and investors should expect wild pullbacks like we are seeing and is feature of these type of assets and is why we can make so much money from them when using the right strategy.
The macro structure is bullish in an Elliot wave ABC as there are many series of 3 wave structures.
Wave (3) of C of (C) is underway with a minimum target of the 1.618 Fibonacci extension $41.17 but price can significantly overextend in these assets.
Terminal target is the channel upper boundary and R3 weekly pivot at $55. A break out above this would be very bullish and could see prices as high as $80+
RSI has months left of upside. Analysis is only invalidated below the 200EMA.
Safe trading
the second transition was a fail. no excuses I've had a great run of AI models walking the market around like an obedient dog, including the first transition of this forecast
This time the second transition did not
time to reset the win streak? or do we still keep the first transition as a win?

Adobe at major support - Target $603Adobe has been ranging for years to finally let the long term trend catch up. $603 is the target for and it will likely form support above there. Finally Adobe should break out of this range.
This is not a fast trade btw.
Good luck!

480 soon, then 900?It's a buy if it hits 480. Most likely it will reach 900.
Happy trading!!
Not a financial advice.

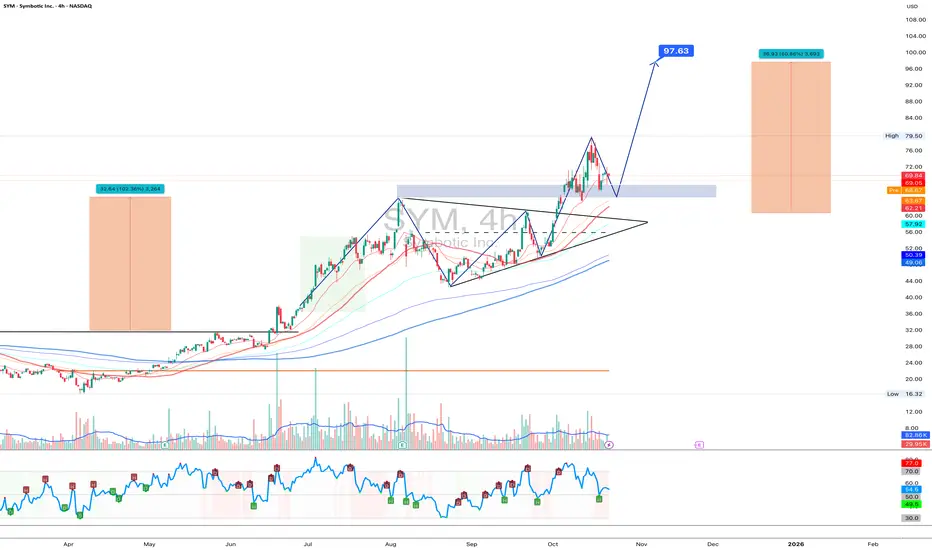
SYM 1D - AI with a real upgrade?Symbotic Inc. shows a clean setup: after a strong rally and breakout from a triangle, the stock is now retesting the $68–70 support zone. The 50-day moving average aligns perfectly here, strengthening the buyers’ defense.
If this level holds, the bullish structure stays intact. The first target sits around $79.50, and the second - at $97.63, matching the prior measured move. A dip below $68 could trigger a deeper pullback toward $62 before buyers regroup.
On the fundamental side, Symbotic keeps expanding its robotic warehouse automation systems - a sector still booming thanks to the AI wave. After a 100%+ rally this year, the stock deserves a coffee break before the next sprint.
Tactical plan: watch $69 carefully - if buyers defend, the uptrend continues; if not, give the robots a reboot and wait for the next entry.
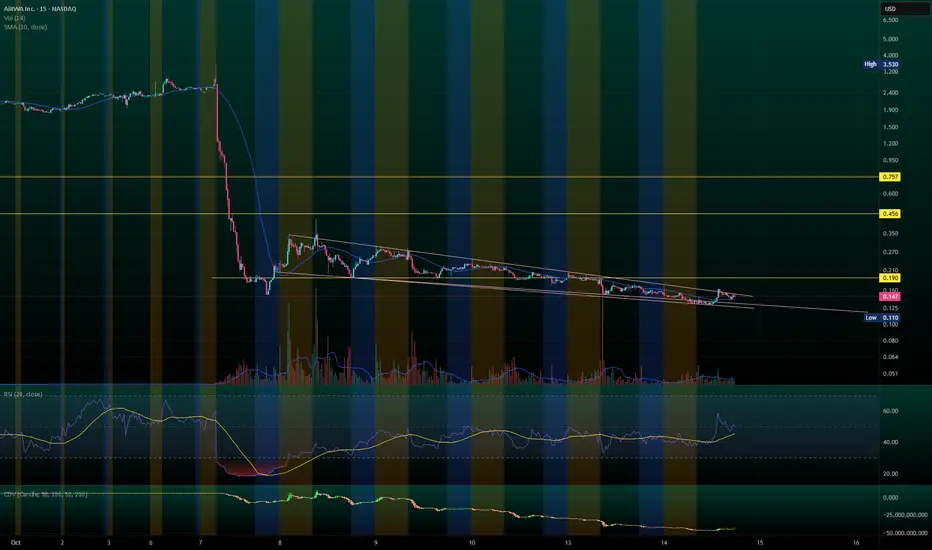
YYAI oversoldHard to say what has happened in the past week, but see below. In any case, I believe PA is about to reverse.
NASDAQ:YYAI Facts:
- YYAI has authorization to issue $200 m ATM shares
- YYAI has agreed to fund their new venture for $250 mil along with a second $250 mil from JuCoin
- YYAI has received $30 mil in SOL (see my other posts)
- If YYAI issued shares totaling more than approximately 20% of outstanding shares, they would need to file an 8-k within 4 business days of issuance, or else face legal problems
- There has been no 8-k and we are on day 5 post-dumparoo
- YYAI daily volume has gone 1000x from typical days (why?)
- YYAI short volume has been 5-10x the current outstanding shares
- YYAI is down 94% from two weeks ago
The question remains, was there dilution, if so how much? If no 8-k this week, can assume there was none or little (or worse, company is fraudulent).
If no 8-k the dump is from a massive coordinated short attack.
If dump was a massive coordinated short attack, price will likely rebound, unless attack continues.