GOOGLE Is this the market Top??Google (GOOG) is now looking almost exactly like the November 2021 Top of the previous Bull Cycle. That was the one that made the first Higher High on its historic 12-year Channel Up.
The distinct signal is a double Higher Highs hit (November 24 2025 and today) similar to Aug - Nov 2021. This is a legitimate technical reason to expect that the 2023 - 2025 Bull Cycle has topped. The 1W RSI has even printed the same kind of peak formation it did in August 2021, completing an impressive rally from its oversold bottom at 32.00 (green circle), similar to the oversold bottom of the COVID flash-crash in March 2020.
So if this the start of a new Bear Cycle in 2026, same as the one in 2022, how low can the stock go before it bottoms and becomes a buy opportunity again?
We will answer that by going back to the multi-year Channel Up, where you can see that the 1W MA200 (orange trend-line) has acted as the ultimate Support, thus best buy entry, during the last three major market corrections: the March 2020 COVID crash, the October 2022 Inflation Crisis bottom and the April 2025 (almost) Tariff War. Before that, it was the 1W MA100 (green trend-line) that gave two excellent buy opportunities back-to-back.
As a result, even though the 2022 Bearish Leg correction bottomed on the 0.5 Fibonacci retracement level, this time we will 'limit' the new Bear Cycle to those MA trend-lines, the MA100 and MA200. If the price is contained on the MA100, its current trajectory shows a potential 'fair' contact around $235. If the market fails to rebound there, we expect a Q4 2026 bottom on the 1W MA200 around $195.
Regardless of that, we will also be looking at the 1W RSI. As we already mentioned, since the 2020 COVID crash, and those 3 in total major corrections that the Alphabet stock had, when the RSI hit the 32.00 level, it presented an objective buy opportunity, even though in 2022 it dipped even lower. As a result, if the 1W RSI hits 32.00 again before reaching any of the above Targets, we will be placing a buy regardless.
---
** Please LIKE 👍, FOLLOW ✅, SHARE 🙌 and COMMENT ✍ if you enjoy this idea! Also share your ideas and charts in the comments section below! This is best way to keep it relevant, support us, keep the content here free and allow the idea to reach as many people as possible. **
---
💸💸💸💸💸💸
👇 👇 👇 👇 👇 👇
Aistocks

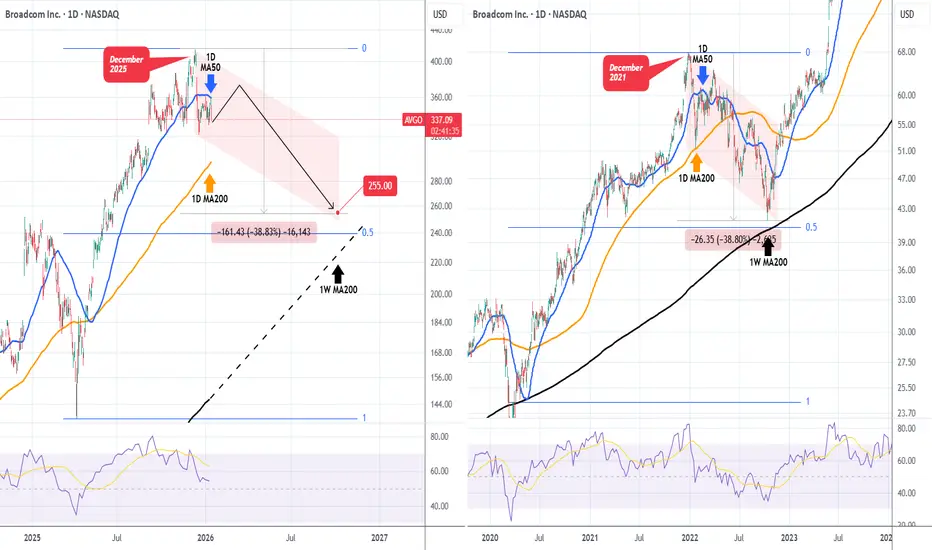
BROADCOM under its 1D MA50, targeting $255.Broadcom Inc. (AVGO) is already 1 month into its new Bear Cycle as following its December 10 2025 All Time High (ATH), it has dropped below its 1D MA50 (blue trend-line), being unable to break above it again yesterday on its 2nd test in the last 2 weeks.
This is almost identical to the 2022 Bear Cycle, which also started after the December 2021 High. Even their 1W RSI sequences are not all that different. Technically, the price is now aiming at the 1D MA200 (orange trend-line) but the long-term target is the 1W MA200 (black trend-line), which is where the 2022 Cycle bottomed after a -38.80% total decline, almost reaching the 0.5 Fibonacci retracement level from the 1W MA200.
As a result, it is highly likely to see a symmetrical Bear Cycle, targeting $255 by late 2026.
---
** Please LIKE 👍, FOLLOW ✅, SHARE 🙌 and COMMENT ✍ if you enjoy this idea! Also share your ideas and charts in the comments section below! This is best way to keep it relevant, support us, keep the content here free and allow the idea to reach as many people as possible. **
---
💸💸💸💸💸💸
👇 👇 👇 👇 👇 👇
Options Blueprint Series [Intermediate]: Breakout With A Buffer1. Market Context: Strength at the Surface, Fragility Underneath
The NASDAQ-100 futures market currently occupies a rare and structurally important zone. Price is trading above a prior all-time high, yet remains below the most recent all-time high, with only a relatively modest distance separating current price from historical extremes.
From a purely technical standpoint, this positioning can be interpreted as constructive. Markets that hold above former highs often retain the potential to transition into renewed expansion and price discovery. However, context matters. This strength exists alongside broader signals of vulnerability across U.S. equity markets—signals that have been explored in prior work and that suggest upside continuation is not guaranteed.
This creates a dual-risk environment:
Upside risk: missing participation if the NASDAQ resumes trending higher.
Downside risk: absorbing full exposure if price fails near historical extremes.
In such conditions, directional certainty is low, but volatility risk is high. This is where outright futures exposure may be less efficient, and where options structures can offer a more robust framework.
2. The Problem With Linear Exposure at Elevated Levels
Holding NASDAQ-100 futures outright implies linear exposure:
Every point higher benefits the position.
Every point lower damages it.
Near historical highs, that symmetry becomes problematic. A trader must be correct not only on direction, but also on timing. Even a structurally bullish thesis can fail if volatility expands or if price retraces before resuming higher.
Linear exposure forces a binary outcome:
Be early and absorb drawdowns.
Be late and miss opportunity.
The goal of this blueprint is to avoid that binary trap by reshaping exposure, not eliminating it.
3. Why Options Are Better Suited for This Environment
Options allow traders to separate direction from risk. Rather than committing capital to a single path, options structures can be designed to:
Define maximum loss in advance
Shift break-even points away from current price
Allow time and volatility to work in favor of the position
Importantly, this blueprint does not rely on forecasting. It assumes uncertainty and builds around it.
The objective is not to predict whether the NASDAQ will break higher or fail lower. The objective is to remain functional across multiple outcomes.
4. Instruments Used: NQ and MNQ Options
This structure applies to:
NASDAQ-100 E-mini futures options (NQ)
NASDAQ-100 Micro E-mini futures options (MNQ)
The logic is identical across both contracts. The difference lies in scale:
NQ offers larger notional exposure and fewer contracts.
MNQ allows finer position sizing, particularly useful when structuring multi-leg options strategies.
Both instruments support the same conceptual framework.
5. Introducing the “Breakout With A Buffer” Concept
The core idea behind this blueprint is simple:
Do not chase price near highs
Do not stand aside entirely
Create a buffer below price while retaining upside access
This is achieved by combining:
A bull put spread placed well below current price
A long call positioned above current price
Together, these components transform uncertainty into a structured payoff.
6. Strategy Construction: Step by Step
The structure consists of three legs:
Short put at approximately 22,000
Long put at approximately 21,000
Long call at approximately 28,750
The bull put spread generates a net credit. That credit is then used to fund the long call.
This matters. Rather than paying outright for upside exposure, the structure monetizes downside stability to finance it.
7. Why a Bull Put Spread and Not a Naked Put
Selling naked puts would introduce undefined downside risk, which contradicts the purpose of this blueprint.
The long put:
Caps downside exposure
Converts the position into a defined-risk structure
Clarifies the maximum loss from the outset
This is not about maximizing credit. It is about controlling tail risk.
8. Strike Selection: Structural, Not Arbitrary
The selected put strikes align with:
The prior all-time high region
A visible concentration of UFOs (UnFilled Orders) acting as structural support
UnFilled Orders represent areas where institutional activity previously absorbed selling pressure. Positioning the put spread near such zones introduces a structural buffer, rather than relying on random distance.
The call strike, by contrast, is intentionally placed far above current price. This avoids overpaying for near-term momentum and instead positions for a regime where price transitions into sustained expansion.
9. Why This Is Not a Collar or a Covered Strategy
It is important to distinguish this blueprint from more common approaches:
Collars require long underlying exposure.
Covered calls cap upside and remain fully exposed to downside.
Outright calls depend heavily on timing and volatility expansion.
This structure does none of those things. It:
Does not require owning futures
Does not cap upside
Does not rely on immediate directional movement
Instead, it converts time and uncertainty into functional components of the trade.
10. Risk Profile: Defined, Asymmetric, Intentional
The resulting payoff has several key characteristics:
Maximum risk is limited to the width of the put spread (approximately 1,000 NASDAQ points), adjusted for net credit.
Break-even is pushed far below current price, near the 22,000 area.
Moderate upside benefits from both time decay on the put spread and directional exposure through the call.
Strong upside allows the long call to dominate the payoff.
This asymmetry is intentional. The structure sacrifices linear gains in exchange for survivability.
11. Scenario Analysis
At the time of constructing this case study, NASDAQ-100 futures trade near 25,900.
Possible outcomes:
Gradual advance: The put spread decays, the call gains sensitivity.
Strong breakout: The call drives returns.
Sideways consolidation: Time decay works in favor of the structure.
Moderate decline: The buffer absorbs volatility.
Deep decline below support: The defined maximum loss is realized.
Every outcome is known in advance. That clarity is the edge.
12. Volatility Considerations
This structure is volatility-aware:
Short puts benefit from volatility contraction.
Long calls benefit from volatility expansion during upside moves.
Rather than betting on volatility direction, the structure balances exposure across regimes.
13. NQ vs MNQ Implementation
For NQ:
Fewer contracts
Larger notional exposure
Greater margin efficiency per leg
For MNQ:
More granular sizing
Easier scaling
Reduced psychological pressure per contract
The strategy logic remains unchanged.
14. Contract Specifications
NQ Tick size: 0.25 points = $5
MNQ Tick size: 0.25 points = $0.50
Options multipliers mirror the futures contracts. Margin requirements vary by broker and volatility regime, currently:
NQ margin requirement = $33,500 per contract
MNQ margin requirement = $3,350 per contract
15. Risk Management Is the Strategy
Defined risk does not remove responsibility. This blueprint requires:
Proper sizing
Acceptance of worst-case outcomes
Discipline in structure selection
Options do not eliminate uncertainty. They make it visible.
16. Key Takeaways
Elevated markets demand adaptive exposure.
Options allow participation without blind commitment.
The Breakout With A Buffer blueprint prioritizes risk clarity first, opportunity second.
This framework is reusable whenever markets hover near historical extremes amid conflicting signals.
Data Consideration
When charting futures, the data provided could be delayed. Traders working with the ticker symbols discussed in this idea may prefer to use CME Group real-time data plan on TradingView: www.tradingview.com - This consideration is particularly important for shorter-term traders, whereas it may be less critical for those focused on longer-term trading strategies.
General Disclaimer
The trade ideas presented herein are solely for illustrative purposes forming a part of a case study intended to demonstrate key principles in risk management within the context of the specific market scenarios discussed. These ideas are not to be interpreted as investment recommendations or financial advice. They do not endorse or promote any specific trading strategies, financial products, or services. The information provided is based on data believed to be reliable; however, its accuracy or completeness cannot be guaranteed. Trading in financial markets involves risks, including the potential loss of principal. Each individual should conduct their own research and consult with professional financial advisors before making any investment decisions. The author or publisher of this content bears no responsibility for any actions taken based on the information provided or for any resultant financial or other losses.

META printing identical pattern as the 2022 Bear Cycle.Meta Platforms (META) is on the 5th straight week of sideways price action within the 1W MA50 (blue trend-line) and 1W MA100 (green trend-line). If we exclude the marginal break of December 08, this is the 11th straight week within this range.
Following the mid-August All Time High (ATH), the stock has technically entered a strong downtrend, the strongest since February - March 2025 and its only Support is the 1W MA100.
This looks identical with the start of the previous Bear Cycle. The Bull Cycles that preceded both peaked on the month of August (2021 and 2025 respectively) and right now (January) we are in a similar position as January 2022, with the 1W MA100 supporting, while the 1W RSI is just below 45.00. On top of that, add the fact that the current 1W RSI has been has been under a huge Lower Highs Bearish Divergence since March 04 2024.
With both patterns involving also a Higher Lows support, which after it broke in 2022 led to a Bear Cycle bottom just below the 1.236 Fibonacci extension, we expect META to repeat this if the 1W MA100 breaks and target $360 (Fib 1.236) towards the end of the year. Notice that this would make a perfect contact with the 1M MA100 (black trend-line).
It has to be noted at this stage that the 2022 Bear Cycle was extremely strong due to the dismal fundamentals. It wasn't just the macroeconomic environment (Inflation Crisis, Ukr-Rus war) but also the Metaverse disappointment. It is highly unlikely to get another such strong Bear Cycle, unless a similar bearish catalyst emerges.
---
** Please LIKE 👍, FOLLOW ✅, SHARE 🙌 and COMMENT ✍ if you enjoy this idea! Also share your ideas and charts in the comments section below! This is best way to keep it relevant, support us, keep the content here free and allow the idea to reach as many people as possible. **
---
💸💸💸💸💸💸
👇 👇 👇 👇 👇 👇

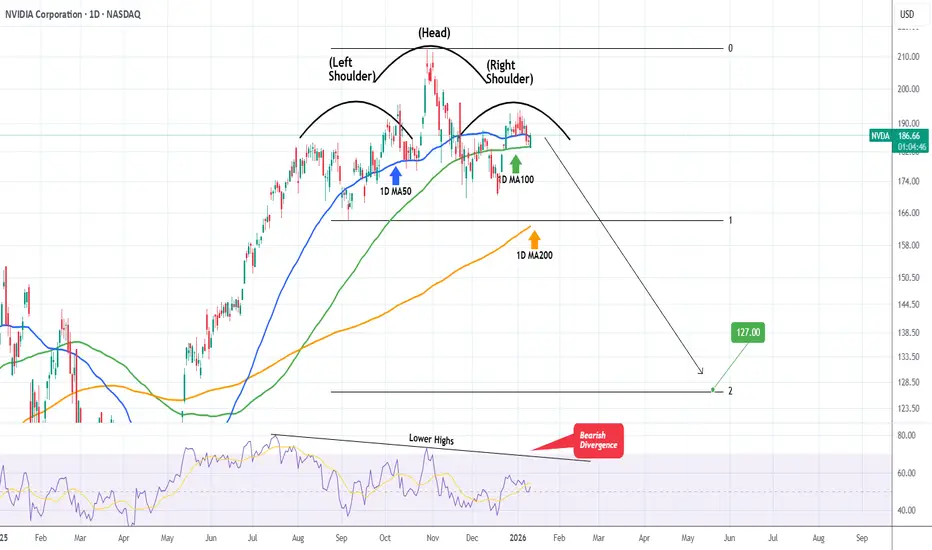
NVIDIA Huge Head & Shoulders forming. $127 technical Target.NVIDIA Corporation (NVDA) is in the process of completing the Right Shoulder of a Head and Shoulders (H&S) pattern, having turned sideways since the October 29 2025 High (ATH).
With the 1D RSI on Lower Highs, i.e. a Bearish Divergence since July 17 2025, it is possible that within a month's time max, the stock will break its Support and the H&S will target its technical extension, the 2.0 Fibonacci at $127.00.
---
** Please LIKE 👍, FOLLOW ✅, SHARE 🙌 and COMMENT ✍ if you enjoy this idea! Also share your ideas and charts in the comments section below! This is best way to keep it relevant, support us, keep the content here free and allow the idea to reach as many people as possible. **
---
💸💸💸💸💸💸
👇 👇 👇 👇 👇 👇
AI Stocks — Bubble? Yes. About to Burst? Not Yet.There is a lot of discussion across the web about a potential bubble in AI-related stocks. While I do agree that we are, indeed, in a bubble, I strongly disagree with the idea that it is about to burst.
To cut through the noise, it’s better to step back from individual names and look at the index, which offers a clearer view of the broader picture.
🔎 The Bigger Technical Picture
As seen on the chart:
- After the early-April drop, triggered by the tariff-related headlines, the index resumed a healthy and well-structured uptrend
- Since that low, price has almost doubled, a clear sign of strong and persistent demand
- The correction that began in early November stopped just above the former resistance and the psychological 3000 level
- From there, price resumed higher and is now testing the previous resistance / ATH zone
This type of behavior — old resistance acting as support, followed by a renewed push higher — is textbook bullish structure, even in an overextended market.
⚖️ Valuation vs. Reality
There is no doubt that:
- Price is very extended
- From a fundamental standpoint, valuations is overpriced
- A lot of “phenomenal” future expectations from the AI sector are already priced in
That said, markets do not top simply because something is expensive.
📌 Conclusion
In my view, this is not yet the moment for the bubble to burst.
As long as price structure remains intact, there may still be room to the upside, potentially toward:
➡️ 4500, if not even higher
Timing a top in a momentum-driven market is one of the hardest things to do — and often the most expensive.
As John Maynard Keynes, the father of modern macroeconomics, famously said:
“The market can stay irrational longer than you can stay solvent.”
A reminder worth keeping in mind — especially in environments like this. 🚀

MICRON scripted blue-print. More than -50% sell-off expected.Micron Technology (MU) is on an amazing long-term rally since the April 2025 Low, currently on the 6th straight green month (1M candle) and 8th in the last 9 months. Its historic price action however shows that this remarkable uptrend may be coming to an end as the price is approaching the top of its 17-year Channel Up (started after the 2008 U.S. Housing Crisis).
Technically, this post April 2025 rally, is the Bullish Leg of this Channel Up and it already broke above the 0.786 Channel Fibonacci, a level that has only broken 3 times in total, with the last being in June 2018.
At the same time, it is close to completing a +601.35% rise, which despite being unusually high, Micron has done such rally 3 times in the past. The remarkable feat is that all those rallies where exactly +601.35%!
Last but not least, the 1M RSI is massively overbought and is approaching Resistance 2 (89.00), which was last seen on the June 2014 High.
All those factors collectively, force a huge bearish dynamic long-term. At best, we may see this rally exhaust near $440 on the short-term, thus fulfilling the +601.35% Bullish Leg blue-print but on the long-term the value of selling give much higher return.
And as far as a potential Target for this upcoming Bear Cycle is concerned, the 0.236 Channel Fibonacci level is the strongest candidate as virtually all major corrections since 2011 have hit that trend-line before the market bottomed. As this chart shows, the 0.236 Fib level has been touched 6 times since 2011, with the market hitting at least its 1M MA50 (blue trend-line) in the process on a minimum -50% decline. The 1M MA100 (green trend-line) has been its true long-term Support since July 2016.
As a result, it is highly probable that Micron drops below the 1M MA50 and hits the 0.236 Fib at around $140 before the market bottoms and turns into a long-term Buy again. At the same time, it is useful to keep an eye on the 1M RSI and Support Zone 1. This has given the last 3 major Buy Signals since December 2018. As a result, if the stock hits that level before reaching $140, we will turn into long-term buyers regardless of the price.
---
** Please LIKE 👍, FOLLOW ✅, SHARE 🙌 and COMMENT ✍ if you enjoy this idea! Also share your ideas and charts in the comments section below! This is best way to keep it relevant, support us, keep the content here free and allow the idea to reach as many people as possible. **
---
💸💸💸💸💸💸
👇 👇 👇 👇 👇 👇

BESI Bullish ContinuationAfter a period of movement within this bull flag pattern, BESI looks ready for bullish continuation after retesting the upper trendline of the bull flag.
Fundamentally this adds up given the increasing demand in chips used for different technologies including AI.
What Besi Does:
- Designs & Builds Machines: They create the specialized equipment that semiconductor manufacturers use to build and package chips.
- Focuses on Advanced Packaging: Their technology supports traditional leadframe packaging, substrate-based packaging, and cutting-edge wafer-level packaging (like hybrid bonding) for complex chips.
- Provides Key Processes: Their equipment handles tasks like die bonding, molding the chip, trimming the leads, and marking the final package.
- Serves High-Growth Markets: They are crucial suppliers for consumer electronics, mobile internet devices, automotive systems, and increasingly, AI and high-performance computing.
I believe this will be a good stock to hold for 2026.

SMCI Loss of this Support can result into crash to $10.Supermicro Computer Inc. (SMCI) has been under heavy pressure since its March 2024 ATH and last month hit and held its 1M MA50 (blue trend-line). This is a key Support level, which even though it broke on the November 2024 crash, the price managed to recover and close the month back up above it. In fact, the last time SMCI closed a month below it was in March 2020 during the COVID flash-crash.
As a result, loss of this level can result into an accelerated sell-off, technically the second Bearish Leg of the long-term Channel Up, towards the 1M MA200 (orange trend-line). If it is as strong as the first Bearish Leg, then we should be expecting a -86% decline to $10.00, which would technically make contact with the 1M MA200.
Notice also how similar the current 1M RSI structure is with SMCI's last Channel Down correction in 2015 - 2018.
---
** Please LIKE 👍, FOLLOW ✅, SHARE 🙌 and COMMENT ✍ if you enjoy this idea! Also share your ideas and charts in the comments section below! This is best way to keep it relevant, support us, keep the content here free and allow the idea to reach as many people as possible. **
---
💸💸💸💸💸💸
👇 👇 👇 👇 👇 👇

Palantir - H&S - ShortExpecting something like this to play out coming weeks for Palantir. Went short on the top of the right shoulder (It is still in process of being a shoulder).

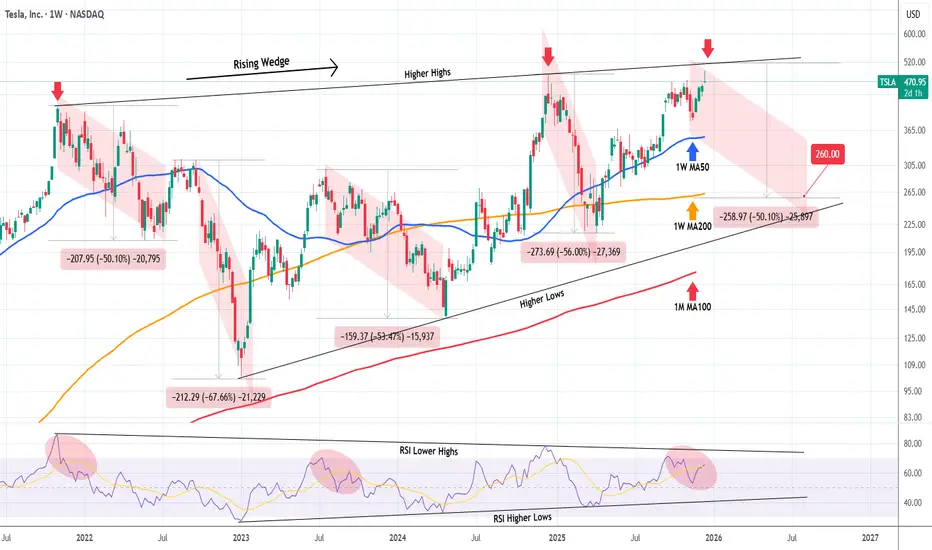
TESLA Did it just get rejected on its 4-year Resistance?Tesla (TSLA) has been trading within a Rising Wedge pattern since the November 01 2021 High. The current weekly (1W) candle almost hit this pattern's top (Higher Highs trend-line) yesterday and today got rejected.
That is the 4-year Higher Highs Resistance that initiated Tesla's last major correction of -56% during December 16 2024 - April 07 2025. Technically this pattern has provided another 3 such major correction events, with all declining by at least -50.10%.
With the 1W RSI also trading within its own Wedge, displaying a similar peak pattern, we expect the price to start a strong decline of at least 6 months. The minimum -50.10% decline projection from the Higher Highs trend-line, gives a $260.00 Target estimate. If the 1W RSI hits its Higher Lows (bottom) trend-line first, we can consider taking the profit on this one earlier.
---
** Please LIKE 👍, FOLLOW ✅, SHARE 🙌 and COMMENT ✍ if you enjoy this idea! Also share your ideas and charts in the comments section below! This is best way to keep it relevant, support us, keep the content here free and allow the idea to reach as many people as possible. **
---
💸💸💸💸💸💸
👇 👇 👇 👇 👇 👇
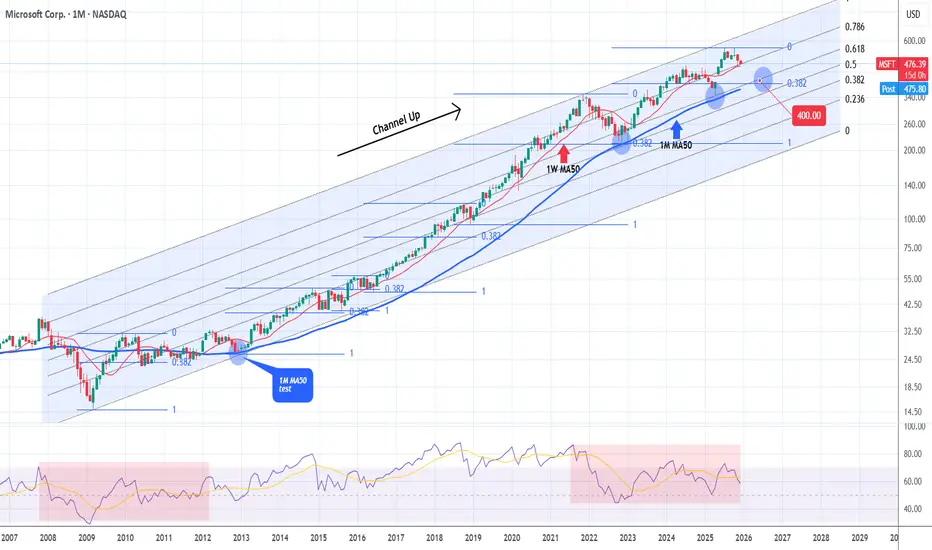
MICROSOFT testing the most important Support of the Cycle.Microsoft (MSFT) hit last month its 1W MA50 (red trend-line) and held. The rebound seems short-lived however as again half-way through December, the market is about to re-test that Support again.
This is a critical Support level for the Bull Cycle that started upon the November 2022 market bottom, as the last two times this broke, the price pulled-back to the 1M MA50 (blue trend-line).
That level has in fact been the ultimate long-term Support since 2012, the most important level of the Channel Up that started after the 2008 Housing Crisis.
We also see here that almost all of the strong bearish corrections within this pattern, hit the 0.382 Fibonacci retracement level and rebounded.
As a result, if 1W MA50 breaks again, we expect the subsequent correction / Bear Cycle to hit $400 at least.
---
** Please LIKE 👍, FOLLOW ✅, SHARE 🙌 and COMMENT ✍ if you enjoy this idea! Also share your ideas and charts in the comments section below! This is best way to keep it relevant, support us, keep the content here free and allow the idea to reach as many people as possible. **
---
💸💸💸💸💸💸
👇 👇 👇 👇 👇 👇
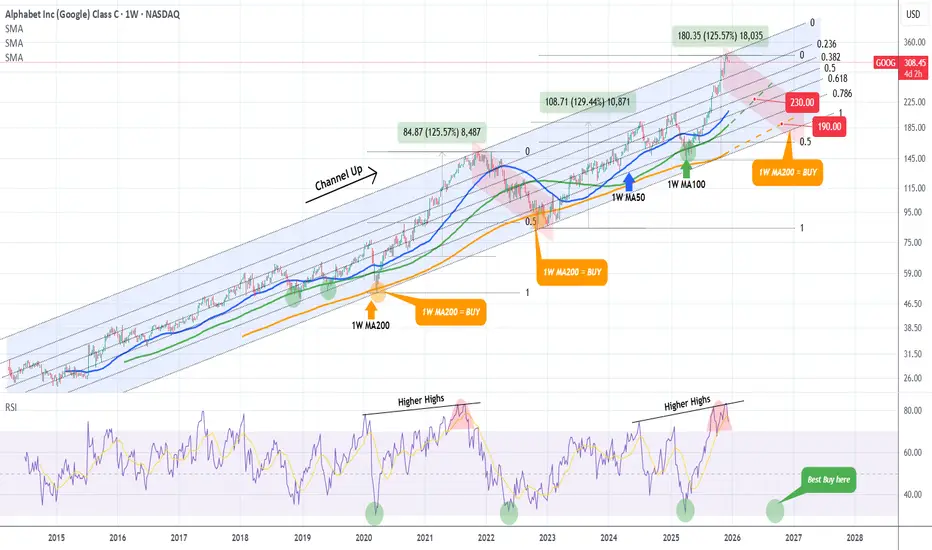
GOOGLE Bear Cycle has started and this is its ultimate blueprintWe made this chart on Google (GOOG) a little more than a month ago, warning of a potential market top on the Higher Highs trend-line of the multi-year Channel Up.
Well 3 weeks ago, the market hit that trend-line and we have a legitimate technical reason to expect that the Bull Cycle has topped. The 1W RSI has even printed the same kind of peak formation it did in September 2021.
We have extended the Channel Up on today's analysis all the way back to Google's IPO and the Fibonacci retracement levels serve absolute justice since the beginning to identify tops and bottoms.
You can see that the 1W MA200 (orange trend-line) has acted as the ultimate Support, thus best buy entry, on the last three major market corrections: the March 2020 COVID crash, the October 2022 Inflation Crisis bottom and the April 2025 (almost) Tariff War.
Before that, it was the 1W MA100 (green trend-line) that gave two excellent buy opportunities back-to-back.
As a result, even though the 2022 Bearish Leg correction bottomed on the 0.5 Fibonacci retracement level, this time we will 'limit' the new Bear Cycle to those MA trend-lines, the MA100 and MA200. If the price is contained on the MA100, its current trajectory shows a potential 'fair' contact around $230. If the market fails to rebound there, we expect a Q3 2026 bottom on the 1W MA200 around $190.
Regardless of that, we will also be looking closing at the 1W RSI. Since the 2020 COVID crash, and those 3 in total major corrections that the Alphabet stock had, when the RSI hit the 32.00 level, it presented an objective buy opportunity, even though in 2022 it dipped even lower.
---
** Please LIKE 👍, FOLLOW ✅, SHARE 🙌 and COMMENT ✍ if you enjoy this idea! Also share your ideas and charts in the comments section below! This is best way to keep it relevant, support us, keep the content here free and allow the idea to reach as many people as possible. **
---
💸💸💸💸💸💸
👇 👇 👇 👇 👇 👇
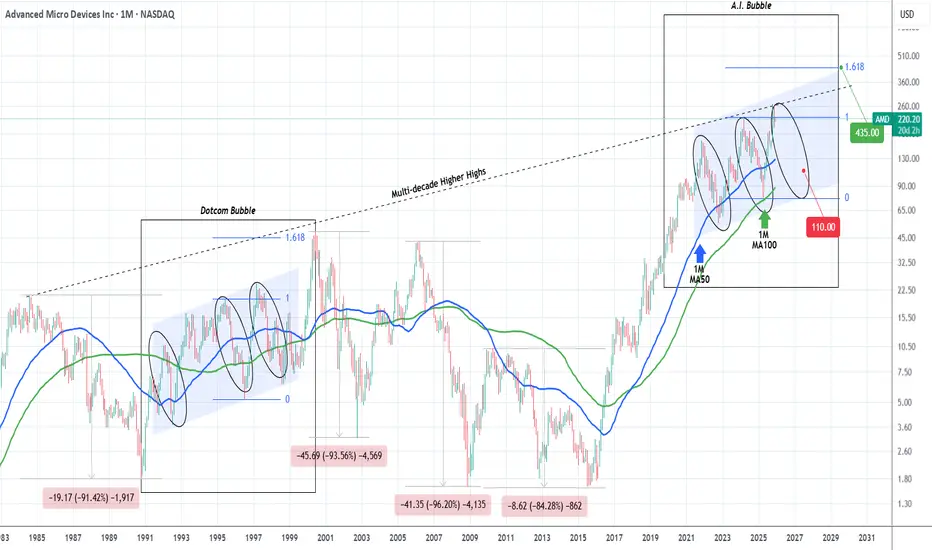
AMD started the A.I. Bubble's final Bear Cycle.2.5 months ago (October 27, see chart below), we gave a bold sell signal on Advanced Micro Devices (AMD), which at the time was against the prevailing bullish market sentiment but started to pay off immediately as the market topped and got rejected:
We still view that Top as the Higher High of its 6-year Channel Up, hence expecting the rejection to evolve into a technical Bearish Leg (Bear Cycle), targeting $110.00.
On today's analysis, we take the long-term horizon a step further as we go back to 1984 and the start of AMD's multi-decade Higher Highs trend-line, a Resistance level that has historically pushed the stock to its key market Tops.
On this 1M time-frame, we have pointed out the Dotcom (Internet) Bubble comparing it with the current A.I. Bubble. As you can see there are strong similarities between the two eras and more specifically the symmetry among their Bullish and Bearish Legs. As mentioned on the previous analysis, the current fractal has technically topped, and is now starting the new Bearish Leg towards $110 and the 1M MA100 (green trend-line).
During the Dotcom Bubble when that corresponding final Bearish Leg was completed, the market started is final parabolic rally that peaked marginally above the 1.618 Fibonacci extension and the Bubble burst.
For investors that have a long-term multi-year horizon, that translates for the A.I. Bubble into a $435 Target by 2030.
---
** Please LIKE 👍, FOLLOW ✅, SHARE 🙌 and COMMENT ✍ if you enjoy this idea! Also share your ideas and charts in the comments section below! This is best way to keep it relevant, support us, keep the content here free and allow the idea to reach as many people as possible. **
---
💸💸💸💸💸💸
👇 👇 👇 👇 👇 👇
TESLA Is December seasonality about to hit it hard?Tesla (TSLA) has been trading within a 3-year Channel Up and has been on a Bullish Leg since the April 07 market low. Not everything on its long-term outlook is positive though as December in the past 5 years, holds a bearish seasonality for the stock as it has aggressively declined.
A 1W MACD Bearish Cross was always present during these times and so is today. With the price trading under a familiar Lower Highs trend-line as in 2023, we see strong probabilities that Tesla starts a new long-term correction. The minimum drop on these corrections has been -50% so a repeat of that would put the price exactly at the bottom of the Channel Up at $236, with only the 1M MA100 (red trend-line) in support.
---
** Please LIKE 👍, FOLLOW ✅, SHARE 🙌 and COMMENT ✍ if you enjoy this idea! Also share your ideas and charts in the comments section below! This is best way to keep it relevant, support us, keep the content here free and allow the idea to reach as many people as possible. **
---
💸💸💸💸💸💸
👇 👇 👇 👇 👇 👇

AMAZON 's new Bear Cycle targets $125. And it can make you rich.Amazon Inc. (AMZN) has been trading within a massive 24-year Channel Up ever since its October 2001 bottom of the Dotcom crash. This pattern, as you can see, has been following a very distinct structure with its 1M MA100 (green trend-line) being the major Support level (and providing the most efficient buy opportunities) since November 2006.
What stands out here is the period from late 2020 until today and how it resembles the one from late 2003 to late 2007. Both traded under multi-year Higher Highs trend-lines and in October 2007 that formed a Top, causing a 2nd correction within that time-frame that bottomed once it hit the 1M MA100 within the Support Zone of the previous consolidation phase.
Today's fractal has already made the 1st correction in 2022, which not surprisingly also bottomed on the 1M MA100 and kick-started the rally towards the Higher Highs trend-line again. We are now at the point where there are high probabilities that the 2nd correction will take place.
If the market continues to follow the past pattern, we expect Amazon to bottom below the 1M MA100 this time and at the bottom of the Support Zone within the $130.00 - $125.00 range. This will make an ideal Higher Low right at the bottom of the 24-year Channel Up.
So what can make you rich on this? Making a long-term buy of course and keeping it until 2030 - 2032 as the new Bullish Leg that will start, will effectively be the new Bull Cycle. And as this chart shows, these Cycles have had similar rises, with the 'weakest' one being +1037%.
---
** Please LIKE 👍, FOLLOW ✅, SHARE 🙌 and COMMENT ✍ if you enjoy this idea! Also share your ideas and charts in the comments section below! This is best way to keep it relevant, support us, keep the content here free and allow the idea to reach as many people as possible. **
---
💸💸💸💸💸💸
👇 👇 👇 👇 👇 👇

NVIDIA This is how it can reach $100 and the Supports involved.NVIDIA Corporation (NVDA) had a strong red 1M candle last month, the first one after a rally of 7 straight green months. This is not the first time we present you this 12-year Channel Up, in fact we used this in late October to give a sell signal.
The reason is that Nvidia almost reached the top of that pattern, a technical Higher High, successive if you count the late 2024 one. Such Double Tops have been previously consistent with the start of strong corrections (Bearish Legs) which in both cases (2018 and 2022) bottomed on the 1W MA200 (orange trend-line).
The key element that we added on the chart this time is the (green) Support Zone, which stemmed every time from the last consolidation (blue circle) before the Top.
It is no surprise that this time it also falls on the 1W MA200 and a potential contact with the price towards Q3 2026 and beyond. Even then, it will still be above the 0.382 Fibonacci retracement level as in December 2018 and quite close to the bottom of the Channel Up for the first time since October 2022.
Our long-term Target and thus next long-term Buy Signal, remains $100.
---
** Please LIKE 👍, FOLLOW ✅, SHARE 🙌 and COMMENT ✍ if you enjoy this idea! Also share your ideas and charts in the comments section below! This is best way to keep it relevant, support us, keep the content here free and allow the idea to reach as many people as possible. **
---
💸💸💸💸💸💸
👇 👇 👇 👇 👇 👇

APPLE Just formed its Cycle Top. Best sell opportunity is here.Almost 3 months ago (September 19, see chart below), we gave a buy signal on Apple Inc. (AAPL), which recently hit our final $290 Target:
This week we go back to the long-term 1W time-frame as the Bullish Leg (green) since the April 07 bottom just hit the top (Higher Highs trend-line) of its 4-year Channel Up.
The 2023 Bullish Leg also peaked on its 1.236 Fibonacci extension and eventually corrected back to its 1W MA50 (blue trend-line), hitting its 0.382 Fibonacci retracement level at the same time. The 2022 and early 2025 Bearish Legs even broke below the 1W MA50 and bottomed after a minimum -32.05% decline. The April 2025 bottom even hit the 1W MA200 (orange trend-line).
All of those Channel Up (Cycle) Tops have taken place while the 1W RSI broke above the overbought level (70.00). This has already taken place since last week and we also se the 1W MACD to start reversing, which is something that has also happened every time after a Top.
Based on all the above evidence (1.236 Fib hit, Channel Up top hit, 1W RSI overbought, 1W MACD reversing), we expect Apple to start a long-term correction (Bear Cycle), technically the new Bearish Leg of the 4-year Channel Up and initially make contact with the 1W MA50 and the 0.382 Fibonacci retracement level at $236.00. If the price closes a 1W candle below the 1W MA50, then we expect a second Target to be fulfilled at the bottom of the Channel Up at $200, below the 1W MA200 but still almost -32.00% from the top.
The most efficient long-term buy signal is perhaps given by the 1W RSI again, when it hits the 33.20 Support. Use that to time your buy entry accordingly.
---
** Please LIKE 👍, FOLLOW ✅, SHARE 🙌 and COMMENT ✍ if you enjoy this idea! Also share your ideas and charts in the comments section below! This is best way to keep it relevant, support us, keep the content here free and allow the idea to reach as many people as possible. **
---
💸💸💸💸💸💸
👇 👇 👇 👇 👇 👇

AI Stocks Started Sneezing… and Indices May Have Caught a Chill?The NASDAQ (a.k.a. the AI theme park) just printed a much lower monthly low.
ES? It dipped… but only politely.
That mismatch matters. When tech acts tired, the broader market usually needs caffeine — or a correction.
The Indicators Are Whispering… and They Don’t Sound Bullish
The CCI is saying “lower highs,” while price is saying “higher highs.”
Classic divergence.
The MACD histogram is fading like holiday lights at 4 a.m.
Momentum? Not dead — just yawning.
Three Levels That Could Decide Whether Santa Shows Up
Think of December like a video game boss fight with three phases:
6,525.00 → First alarm bell. Break it and the mood changes.
6,239.50 → “Bear trap danger zone.” Plenty could happen here.
4,430.50 → The deep level nobody wants to talk about, but everyone should mark.
If ES finds its footing near 6,239.50, Santa still has a shot.
If not… well… Grinch season might come early.
ES & MES Contract Specs + Margins
E-mini S&P 500 Futures (ES)
Tick size: 0.25 index points = $12.50
Approx. margin (as of now): ~$22,400 per contract
Micro E-mini S&P 500 Futures (MES)
Tick size: 0.25 index points = $1.25
Approx. margin (as of now): ~$2,240 per contract
Margins vary by broker and can change with volatility, but these figures reflect current exchange-level requirements.
Risk Management: The Only Real Holiday Magic
ES and MES give traders the same view of the market but with different intensity levels.
December is emotional, fast, and occasionally rude — so size positions like someone who wants to enjoy the holidays, not stress through them.
Pick a zone → define the invalidation level → cap your dollar risk → choose ES or MES accordingly.
Simple. Calm. Holiday-friendly.
Final Thought
Santa hasn’t canceled the rally yet. But AI stocks aren’t exactly singing Christmas carols either.
If the tech giants recover, December could still sparkle.
If they don’t… the sleigh might need a repair shop.
Either way: chart levels > seasonal hope.
Trade safe — and maybe hide a cookie for the market, just in case.
Want More Depth?
If you’d like to go deeper into the building blocks of trading, check out our From Mystery to Mastery trilogy, three cornerstone articles that complement this one:
🔗 From Mystery to Mastery: Trading Essentials
🔗 From Mystery to Mastery: Futures Explained
🔗 From Mystery to Mastery: Options Explained
When charting futures, the data provided could be delayed. Traders working with the ticker symbols discussed in this idea may prefer to use CME Group real-time data plan on TradingView: www.tradingview.com - This consideration is particularly important for shorter-term traders, whereas it may be less critical for those focused on longer-term trading strategies.
General Disclaimer:
The trade ideas presented herein are solely for illustrative purposes forming a part of a case study intended to demonstrate key principles in risk management within the context of the specific market scenarios discussed. These ideas are not to be interpreted as investment recommendations or financial advice. They do not endorse or promote any specific trading strategies, financial products, or services. The information provided is based on data believed to be reliable; however, its accuracy or completeness cannot be guaranteed. Trading in financial markets involves risks, including the potential loss of principal. Each individual should conduct their own research and consult with professional financial advisors before making any investment decisions. The author or publisher of this content bears no responsibility for any actions taken based on the information provided or for any resultant financial or other losses.

AI Stocks Weakness Could Spoil this Year’s Santa RallyAs December begins, traders worldwide are dusting off the same old question: Will we get a Santa Claus rally this year?
But 2025’s setup looks a little different. The market’s cheer seems to depend heavily on whether AI-related stocks can keep delivering miracles—and lately, the charts are suggesting they may be running out of steam.
When Tech Sneezes, the Market Catches a Cold
A quick look across U.S. equity futures shows a revealing pattern.
The E-mini NASDAQ 100 Futures (NQ), home to most AI and semiconductor giants, has posted a significantly lower monthly low compared to the prior month.
Meanwhile, the E-mini S&P 500 Futures (ES) declined much less, hinting at relative resilience, but also possible lagging weakness.
This divergence—NQ leading down while ES holds up—is a subtle warning. When the market’s growth engine (tech) loses traction, broader indices often follow with a delay. That’s the tension December traders are staring at: are we seeing the early signs of exhaustion before the holidays, or just a healthy pause?
Bearish Divergences Whisper “Caution”
The technicals are backing that cautious tone.
On the ES chart, the Commodity Channel Index (CCI) has been carving lower highs even as prices printed higher highs. This is a textbook bearish divergence, often an early sign that bullish momentum is fading.
The MACD histogram echoes the same message: momentum has been contracting through November despite new price highs, suggesting that underlying strength is eroding. Such divergences don’t predict direction on their own, but they do raise the probability of a short-term correction—or at least a choppy path into year-end.
The Price Map: Three Levels that Could Define December
Let’s outline the key technical zones traders are watching:
6,525.00: the prior monthly low—this is the first line of defense for the Santa Rally narrative. A break below this level would likely shift sentiment fast, especially if NQ continues under pressure.
6,239.50: the floor of a relevant UFO (UnFilled Orders) support zone. If ES dips below the prior low, this zone may become a “bear trap.” Many traders might short aggressively once 6,525.00 gives way, but those unfilled buy orders could absorb supply and trigger a sharp bounce. If the rally emerges from here, Santa might still make his visit.
4,430.50: a deeper UFO support cluster roughly 35% below current prices. If price were to cut through 6,239.50 and stay below it, the market would be entering a different regime altogether—likely accompanied by broken trendlines, volatility spikes, and a more defensive tone.
Reading Between the Lines: What the Divergence Means
Historically, the Santa Rally is powered by optimism, lighter volumes, and portfolio rebalancing. But this time, AI and semiconductor names—the champions of the current bull leg—are leading weakness.
That doesn’t mean doom; it means fragility.
The ES market may still rebound, but it’s doing so under reduced participation from the very sectors that drove prior gains.
Sizing the Trade Without Crossing the Line
For traders eyeing this setup through ES (E-mini S&P 500 futures) or MES (Micro E-mini S&P 500) futures, here’s a compliant, educational way to think about risk and position sizing:
Identify the Setup Zone: e.g., around 6,525.00 as potential demand, or below 6,239.50 as short-term breakdown.
Define Your Stop: the level where the technical picture is invalidated.
Set a Dollar Risk Limit: for instance, risking 1% of total account equity.
Derive Position Size: Divide your dollar risk by the price distance between entry and stop (converted into points). Then choose between the standard E-mini (ES) or Micro E-mini (MES) to match your risk tolerance and account size.
This framework lets traders adapt leverage responsibly—without needing the specific contract specs or margin figures, which vary by broker and time.
Risk Management: December Can Be a Trap
December is famous for emotional trading. The combination of holiday expectations, thinner liquidity, and year-end positioning can turn routine pullbacks into exaggerated moves.
That’s why focusing on risk before reward is critical.
The UFO support levels serve as reference zones where institutional activity might reappear, but they’re not guarantees. Managing stops, scaling out partial profits, and staying flexible matters more than trying to guess the market’s next headline.
ES and MES: Same Story, Different Scale
The Micro E-mini (MES) contract is a smaller version of the E-mini (ES), designed for traders who want the same price exposure but with lower notional size.
Both track the same index, tick for tick.
For traders exploring this December setup, the MES allows participation while controlling exposure more granularly—especially useful if volatility picks up and margin requirements shift.
Key Contracts Specs and Margins:
E-mini S&P 500 Futures (ES) with a point value = $50 per point.
Micro E-mini S&P 500 Futures (MES) with a point value = $5 per point.
As of the current date, the margin requirements for E-mini S&P 500 Futures and for the Micro E-mini S&P 500 Futures are approximately $22,400 and $2,240 per contract respectively.
Always verify the latest margin schedules and specifications directly with your broker or the exchange before entering trades, as those details update regularly and depend on market conditions.
Santa’s Setup: Scenarios to Watch
Scenario A — Santa Delivers: Price tests or slightly breaks the 6,525.00 low, finds support near 6,239.5, and rebounds into late December. Bearish divergences resolve sideways, and risk assets stabilize.
Scenario B — The Grinch Arrives: The 6,239.50 zone fails to hold, breaking trendline supports. The market slides toward 4,430.50, shaking off complacent longs and erasing part of the 2024-5 rally.
Both paths are technically valid. The difference will come from whether AI-heavy sectors regain strength—or confirm that this bull leg has indeed lost its engine.
Educational Takeaway
Divergences (CCI and MACD) highlight when momentum and price disagree—a sign of fatigue.
Intermarket analysis (ES vs. NQ) reveals where weakness may originate.
UFO levels identify potential institutional footprints—where traps or reversals often occur.
Discipline and risk control matter more than predicting whether Santa shows up.
Final Thought
Whether December brings gifts or grief may depend less on seasonal hope and more on how traders interpret these divergences.
If AI stocks can find footing again, the rally could revive. But if they keep sliding, this might be the year Santa takes a break.
When charting futures, the data provided could be delayed. Traders working with the ticker symbols discussed in this idea may prefer to use CME Group real-time data plan on TradingView: www.tradingview.com - This consideration is particularly important for shorter-term traders, whereas it may be less critical for those focused on longer-term trading strategies.
General Disclaimer:
The trade ideas presented herein are solely for illustrative purposes forming a part of a case study intended to demonstrate key principles in risk management within the context of the specific market scenarios discussed. These ideas are not to be interpreted as investment recommendations or financial advice. They do not endorse or promote any specific trading strategies, financial products, or services. The information provided is based on data believed to be reliable; however, its accuracy or completeness cannot be guaranteed. Trading in financial markets involves risks, including the potential loss of principal. Each individual should conduct their own research and consult with professional financial advisors before making any investment decisions. The author or publisher of this content bears no responsibility for any actions taken based on the information provided or for any resultant financial or other losses.

NVIDIA Trading plan from $100 to $1000. Is it plausible?Exactly a month ago, we called the end of the rally on NVIDIA Corporation (NVDA), essentially the end of its multi-year Bull Cycle and the beginning of an aggressive Bear Cycle correction.
** The 10 year Channel Up **
So far this is paying dividends as the stock just completed a 4-week red streak. The essence of NVIDIA's trend has been a decade long Channel Up, as you can see on this chart and that's the basis of all the buy entries and sell exits we've made over the years.
** Bull and Bear Cycles **
Since early 2025, the stock started that Channel Up, whose first Bull Cycle (as well as the next ones with the exception of one breaking) was supported by the 1W MA50 (blue trend-line). Once that Bear Cycle (in the form of the Channel's Bullish Leg) ended, the subsequent Bear Cycle (Bearish Leg) broke below both the 1W MA50 and 1W MA100 (green trend-line) and bottomed exactly on its 1W MA200 (orange trend-line), marginally above the 0.382 Fibonacci retracement level.
The following Bull Cycle as well as the Bear Cycle followed the same structure only, the bottom was this time marginally below the 0.382 Fib. Then the Bull Cycle that just ended started, with only basic difference that its early 2025 correction broke below the 1W MA50 but found Support on the 1W MA100. Every Bull Cycle had such pre-Top correction (blue ellipse). Note also that this last Bull Cycle as been the strongest Leg on +1881% rise and the one before it, the 'weakest' at +1004%.
** The RSI **
Notice also that the 1W RSI has made the same Double Top rejection pattern on the Lower Highs Zone that both previous Bull Cycle Tops did. Strong confirmation therefore of the emerging Bear Cycle.
** The next bottom **
Technically, we expect the market to bottom yet again on the 1W MA200, which by a fair projection of its current trajectory, we expect that to be around $100. That would still be considerably above the 0.382 Fib, which can only get hit if the Bear Cycle falls very aggressively. Note here that historically within this Channel Up, the most optimal buy signal was given when the 1W RSI hit 42.00. Use that in combination with the 1W MA200.
** Future Targets **
So after the Bear Cycle bottoms, what Target can we pursue? Well the 'minimum' projection based on the 2.618 Fibonacci extension of the Bull Cycle that just ended is $700. At the same time, if it rises by again the 'minimum' % of the weakest +1004% Bullish Leg of the Channel, we are looking potentially at a 4-year Target of $1100. It is also worth noting the valuable use of the Sine Waves that have so far accurately grasped the peak formations of the Bull Cycles. We can use this to time our market exits in 2029.
Realistic or not subjectively, the $100 to $1000 path is what the pure technicals and historical data support and clearly show is a very likely probability for a long-term investment.
---
** Please LIKE 👍, FOLLOW ✅, SHARE 🙌 and COMMENT ✍ if you enjoy this idea! Also share your ideas and charts in the comments section below! This is best way to keep it relevant, support us, keep the content here free and allow the idea to reach as many people as possible. **
---
💸💸💸💸💸💸
👇 👇 👇 👇 👇 👇

PALANTIR Is there time to reach $250 before Bear Cycle begins?Palantir (PLTR) has been trading within a multi-year Channel Up throughout this Bull Cycle, which despite the recent correction just above the 1W MA200 (orange trend-line), it still stands.
The last time in fact that we had a similar 1W MA200 approach on such a 1D RSI pattern (RSI reaching 34.00) was on January 05 2024. What followed was a 1-month rally to the 1.618 Fibonacci extension.
As a result, if the market delivers a strong 'Santa Rally', we may see Palantir peak at $250.00 before a Bear Cycle begins.
---
** Please LIKE 👍, FOLLOW ✅, SHARE 🙌 and COMMENT ✍ if you enjoy this idea! Also share your ideas and charts in the comments section below! This is best way to keep it relevant, support us, keep the content here free and allow the idea to reach as many people as possible. **
---
💸💸💸💸💸💸
👇 👇 👇 👇 👇 👇

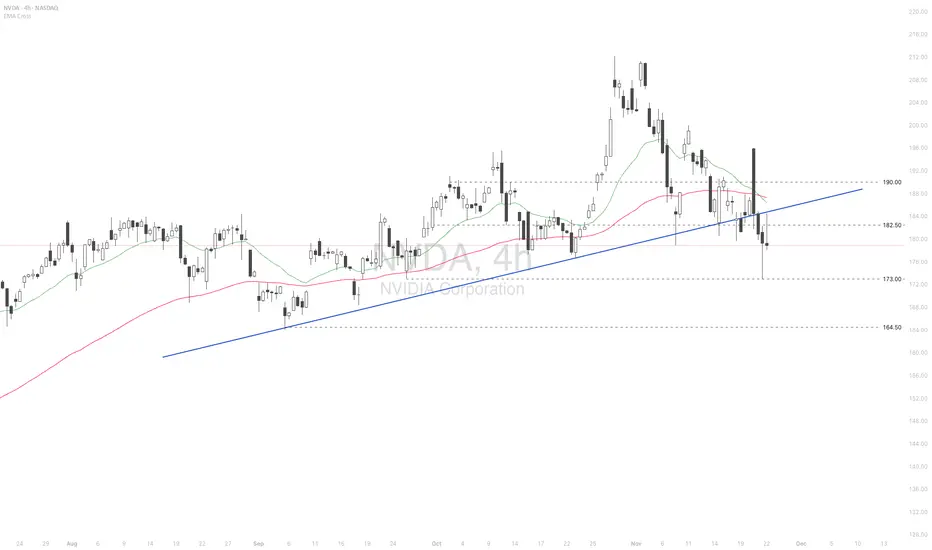
Nvidia loses steam despite exceptional 3Q performance
Nvidia (NVDA) posted a record-breaking 3Q performance, with revenue surging 62% YoY to 57 bln USD. Its 4Q guidance points to another 65% increase, reinforcing optimism that growth momentum will continue to accelerate. CFO Kress noted that the guidance does not include any contribution from China sales, while CEO Huang pushed back against recent AI-bubble concerns raised by Michael Burry.
Nevertheless, AI valuation risks remain elevated. Beyond strong earnings, the scale of AI infrastructure spending and the surge in bond issuance required to fund it continue to dampen investor sentiment.
Goldman Sachs (GS) has warned about the fragility in the private credit market. The firm highlighted that Blue Owl Capital, with more than 295 bln USD in AUM, over half of which is credit-exposed, has seen its share price fall nearly 30% since Sep. Major credit-heavy players such as KKR and Blackstone are also showing signs of pressure, underscoring how AI-driven anxiety is spilling into private credit.
NVDA briefly breached above the psychological level at 195.00 but surrendered all gains, falling back below 182.00. The price remains under the death-crossed EMAs, indicating a potential expansion of the bearish bias.
If NVDA breaks below the support at 173.00, the price could decline further toward the following support at 164.50.
Conversely, if NVDA breaches above the resistance at 182.50 and the ascending trendline, the price may advance toward the subsequent resistance at 190.00.