ETH downside target hit, bottom soon?Wave 2 is taking the form of a complex WXYXZ correction broadening wedge. Ugly, hard to trade or find any entries. This will cause a lot of stress. This is also potentially a wave 4, but my preferred count is 2 for now.
Wave 2 appears complete with a swing below the boundary at the High Volume Node. Price is below the saily 200EMA. The trend is down, so we should expect more down. Wave X printed a triangle, hinting at this move down being the final move before reversal.
📈 Daily RSI has reached oversold with unconfirmed bullish divergences.
👉 Continued downside has a target of the High Volume Node $2080, where I will be adding.
Safe trading
ALTS

Doge, bullish divergence on daily.Price was rejected at the daily pivot per the last report’s analysis. The downtrend is intact.
Wave (2) appears complete after the Oct 10th flash crash, just above the ‘alt-coin’ golden pocket, 0.786 Fibonacci retracement. The trend remains down, so further downside is the higher probability. Price needs to overcome the heavy resistance ahead before we can talk about being bullish long-term.
📈 Daily RSI has printed bullish divergence
👉 Continued downside has a target of the 0.618 Fibonacci retracement and High Volume Node $0.12
Safe trading

BNB, downtrend in tact.The downtrend is intact. Price completed macro wave (3) at the R1 pivot, retraced and lost the daily 200EMA, 0.236 Fibonacci retracement and S1 pivot, but the downtrend looks exhausted.
Wave 4 appears complete with a textbook ABC correction ending at strong support and the channel bottom. The downtrend is intact, so the probability is still to the downside until the structure flips or price recovers the daily 200EMA.
📈 Daily RSI has reached oversold with no divergences
👉 Continued downside has a target of the High Volume Node at $730
Safe trading

AAVE Local, bottoming soon?Locally, price continues bearish after falling out of the wedge, completing wave (B) of the macro triangle. Price action looks ready to reverse
Wave © appears complete after the big drop, black swan event- Oct 10th. I was looking for a dip back into the long lower wick, which we have and price is finding support. This suggests we grind higher from here, but we must get through the daily 200EMA, just above the High Volume Node resistance and daily pivot. This area will be tough to crack and was rejected on the first attempt.
📈 Daily RSI has printed bullish divergence from the oversold threshold- a bottoming signal.
👉 Continued downside has a next target of $114.
Safe trading

Algorand ALGO USDT Upcoming TAKE PROFIT POINTSHi Traders, Investors and Speculators of Charts📈📉
New Year 2026 loading....🥂🥳
Algorand is a decentralized network built to solve the Blockchain Trilemma of achieving speed, security, and decentralization simultaneously.
Algorand is designed to be a payments-focused network with rapid transactions and a strong focus on achieving near-instant finality which aims to be processing over 1,000 transactions per second (TPS) and achieving transaction finality in less than five seconds.
As a public smart contract blockchain that relies on staking, Algorand is also capable of hosting decentralized application (dApp) development and providing scalability. Rising gas fees on Ethereum have led many dApp developers and decentralized finance (DeFi) traders to look for alternative blockchain solutions. Algorand is capable of managing the high-throughput requirements of widespread global usage and a variety of use cases.
Technical Chart Analysis:
Algorand is still "in prison", but holding the 50d Moving Averages is the first step towards a new bullish cycle. Look at all of this upside potential!
Technical indicator Analysis:
If ALGO can get back ABOVE the 50d moving averages (0,18), that is when we can expect to see some serious bullish/parabolic price action.
You don't have to wait until then to trade algo. In the daily timeframe, there are some great setups for those who have a bit of patience, with low buy and high sells from 15% - 30% over a few weeks (in both shorts and longs).
Tis market is still moving, even though it doesn't neccesarily seem like it from a macro outlook.

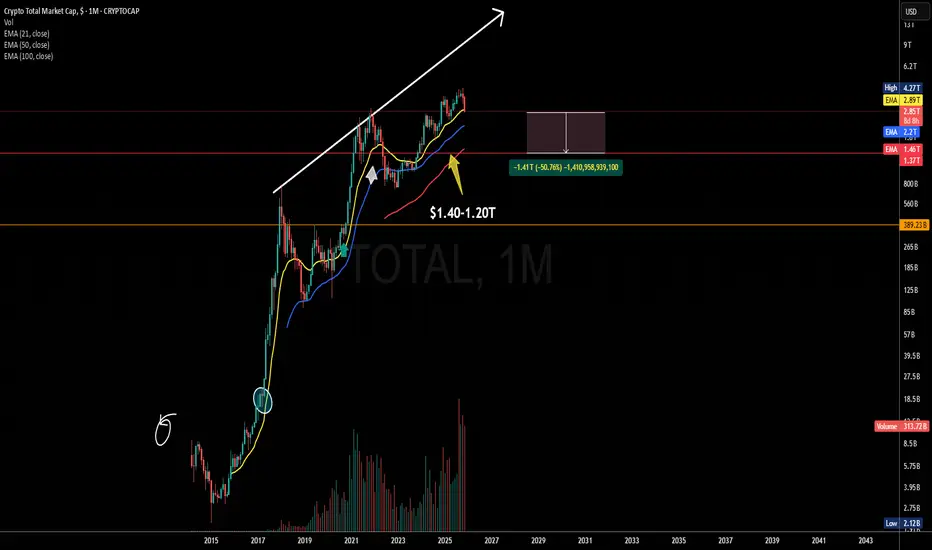
The Brutal Math of a Bitcoin CrashThis is the brutal math of a Bitcoin crash that each one of us needs to understand.
The total crypto market cap (TOTAL) is currently ~$2.85T.
Bitcoin's market cap is ~$1.70T.
If BTC drops 50%, it loses ~$850B in value.
This would drag TOTAL down to approximately $2.00T.
The terrifying part? This means the entire rest of the market—every single altcoin from Ethereum to the smallest micro-cap—would be left with a combined market cap of only ~$300-400B to share between them.
The result would be a bloodbath of catastrophic proportions for alts. Most would see declines far exceeding Bitcoin's 50%, with many high-beta coins facing -70%, -90%, or even total collapse as liquidity evaporates.
When the TOTAL drops violently, it reveals who's swimming naked.
GRASS - MORNING VIEW ON FIIIRE$GRASS - morning view was 🔥🔥🔥
+40% up from 0.470 to 0.660$ ✅
Key (final resistance) I shared has been hit nicely. 🎯
Solid rejection there,🔴 Meaning that we may see a sharp retracement/pull back toward the 0.480 - 0.500$ level next.
Congrats

MELANIA Main Trend. Memes with high hype and risk. July 17, 2025Main trend. Time frame 3 days (less is not necessary). Showed conditional levels (zones near them), and percentages of decrease from the maximum (note, I showed from the zone where the main retail of “affected investors” began to connect, that is, the maximum is much lower than on the chart).
Note that now a conditionally large volume “enters”, it is displayed on the price chart (this is important), a sideways squeeze has begun. Local impulse and rollback are now in the moment.
Also showed a large % (intentionally) for orientation, from minimum to maximum zones. On such hype assets, as a rule, medium-term - long-term holding (bought in the right zone) shows significant income.
All level zones are conditional, due to liquidity, but the price will most likely “play” after the breakdown of the downward trend in this range, another alt season (which many do not notice due to the slow breakdown of their opinions, news chaff, and inadequate goals). As for me, above these huge % (resistance zone, or up to 0.869, so as not to waste time), you should get rid of this meme, or its % from the previous position should already be minimal (5-10%).
There are hype zones, there are zones of potential gain (fading hype, interest, and a large % from the maximums). On such assets of "manual trading", where cryptocurrency has no value, it is always sold little by little (many do not understand this), but in order to sell, you sometimes need to make interest, and "instill hope" in previously deceived "investors" who want to get out at least at a loss (it is unlikely to happen). At the right time, 1-2 tweets - statements from the "powers that be" - are pumped up due to low liquidity by a huge percentage.
On such cryptocurrencies, you do not need to guess the “bottom” or maximums. Pricing is formed differently here, as there is no real supply/demand, utility, but only psychology and "hitting the jackpot" of gambling addicts. Be smarter. Diversify such assets, distribute the risk in advance. Make purchases/sales according to plan, without emotions.
When the price goes up, you think it will go much higher, but even if it does, you must sell a certain volume in certain planned zones, without any emotions or sense of lost profit.
Similarly, when the price goes down, people are driven by fear and refuse to buy, and these were probably the minimums of fear.
The average price of the set and reset is important. No minimums and maximums are needed. Be patient and consistent in your actions and plans.

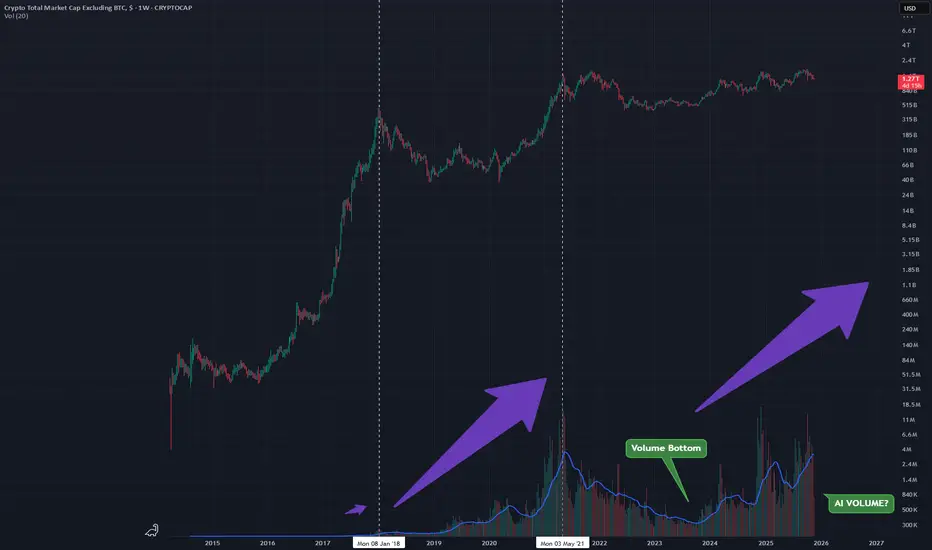
TOTAL2 - Looking at VolumeTrying to understand the patterns that volume shows on this Weekly chart
Peaks in volume correlate with peaks in price
as that volume is rising now we can expect price to rise to that peak
Honestly think all this is from AI hype and a long awaited alt rally.
Very bullish on alts!
BNB/USD Main Trend. 11 18 2025Logarithm. Time frame: 1 week.
🔵Main trend: lower zone of the ascending channel As previously shown on HBAR.
🟡🟣Secondary and local trends
There's a pullback to the breakout zone, that is, to the mirror level of the former resistance of the large bowl (currently strong support), meaning the price is retesting the key zone, which are the historical highs of the previous 2021 cycle. This is the same as the 72,000 zone for BTC in the past.
🟣🔄 A breakout of the local designated trend line (purple) is a local trend reversal. But, in general, it's important to understand that this is a retest of the previous breakout zone.
🟢🔄 Confirmation and holding of the price above this zone is astronomical, and any news is just fiction to justify a move into the next zone, already a distribution.
🔴🔄 Failure to hold this zone means a temporary immersion in the previous consolidation.
According to the general market trend (market phase) and the asset's liquidity (money in the project), a chart pattern is formed.
______________________________________________________________________
⚠️ Overall, I think Binance will lose "$ liquidity," that is, users, due to unfair speculative play (controlled by "Big Brother") and a prolonged lack of exchange functionality updates. Perhaps this won't happen immediately, but gradually. But I'm sure many would really prefer not to see this happen instantly. It's unlikely that the exchange itself will survive long-term competition from new exchanges with fresh functionality and "users who aren't offended."
1️⃣ It's worth remembering that the most liquid and popular exchanges in the 2017 cycle were Bittrex and Poloniex. Where are they now? Bittrex is a scam. Poloniex has completely lost liquidity.
2️⃣ In the 2021 cycle of highs, FTX and Binance. The former is a scam. The latter is still around.
0️⃣ The main villain is a scam (everyone understands what, who, and why), which always scams everything monetary for its own interests and monopolizes the "fresh mushrooms" of the market. There is one, which is equivalent to the main "market maker." The one who "created" and "destroyed" dinosaurs from the very beginning, including the MtGox exchange back in 2013, squeezing out "all the available circulating BTC" at the time. This has been his playing field since the very beginning of the crypto bubble.
You're on someone else's playing field, so remember that and accept their rules. You're playing by the rules of those who set the traps for you, bypassing them. These rules have little effect on the masters of the speculative game. Accept the game and the risks, or leave...
3️⃣👀What will happen this time? Which liquid exchange will be "killed" to destroy the dollar in a bear market and trigger a super-negative environment? One can only guess. There are several candidates (as well as highly liquid hyped cryptocurrencies) that could influence the overall trend and shape a certain, extremely pessimistic opinion among the majority. Don't guess, you might miss the mark.
🧠 Therefore, when trading and holding cryptocurrencies and USD, diversify your storage and trading locations.
1️⃣ Cold or hardware wallets (a portion of your funds, if you're a holder, is larger; if you're a trader, it's smaller).
2️⃣ + Liquid exchanges (3-4, two isn't enough, as if one goes to the "other world"), you'll lose 50% of your trading funds, and that's a lot. To recover, you need to increase your capital not by 50%, but by 100%. For hamsters, this is "simple," but for traders, it's not.
⚠️ A paragraph off-topic for trading? A reminder of the most important thing, the safety of your money, is not superfluous. What's the point of earning if you'll lose everything? This is not superfluous for smart people who work and earn, rather than paying the market for their emotions and chatting in chats about how rich and broke they are.
Risk must always be justified and controlled by you. This is the foundation of foundations. If this isn't the case, then you're building a speculative house on a clay foundation, trying only to guess the price. Sooner or later it will collapse, and the later it happens, the more painful it will be.

BTC Dominance Analysis – 1D📊
1. Main Trend
BTC.D is still moving within a large, ascending trend channel (yellow lines).
The price has currently rebounded from the lower band of the channel and is heading towards its center.
The long-term trend remains bullish, but short-term momentum is weakening.
📈 Key Levels on the Chart
Supports
59.20% – currently tested support + EMA 50 and SMA 50
→ a very important level. Its loss = downward pressure on BTC.D, favorable for altcoins.
58.24% – next strong support level
→ if 59.20% falls, a move to 58.24% is very likely.
57.05% – key structural support
→ breakout = the ascending trend is broken, altcoin season is off to a strong start.
Resistance
60.87% – local resistance from multiple candles + MA/EMA crossover
61.65% – strong upside target
64.68% – trend extreme (upper band of the channel)
→ if BTC moves solo, this level will be tested.
🔵 EMA / SMA 50/200
I can see a few key things in the screenshot:
The 50 EMA is below the 200 EMA – technically a death cross → a short-term bearish structure.
The price is exactly below the 200 EMA and stuck to the 50 EMA.
→ this is a typical consolidation zone before a breakout.
Conclusion:
If BTC.D breaks 60.8% → momentum returns to BTC's side.
If it falls below 59.20% → altcoins receive a signal to rebound.
🔴 MACD
The MACD is above 0, but the crossing line is bearish (the blue line crosses the signal from above).
The histogram turns red.
Conclusion:
Momentum is decreasing → a short-term bearish signal.
🟣 RSI
RSI is around 53, which is neutral.
A downward breakout of the MA onto the RSI → a weakening impulse.
Conclusion:
The RSI does not support a strong move either up or down — but the slight slope suggests a correction.
📌 SCENARIOS
🟢 Bullish (pro-BTC)
Condition: 60.8% breakout
➡️ Targets:
61.6%
64.6% (channel top)
This means:
➡️ BTC dominates the market
➡️ ALTs are bleeding or stagnating
🔴 Bearish (pro-alts)
Condition: 59.20% breakout
➡️ Bearish targets:
58.24%
57.05% → and this is where the real alt season begins
This means:
➡️ Alts are starting to pump harder
➡️ BTC is losing dominance
🟡 Neutral / sideway
BTC.D between 59.2% and 60.8%
→ range consolidation, lack of major market decision
→ typical for periods when the entire crypto market stands still and "waits"

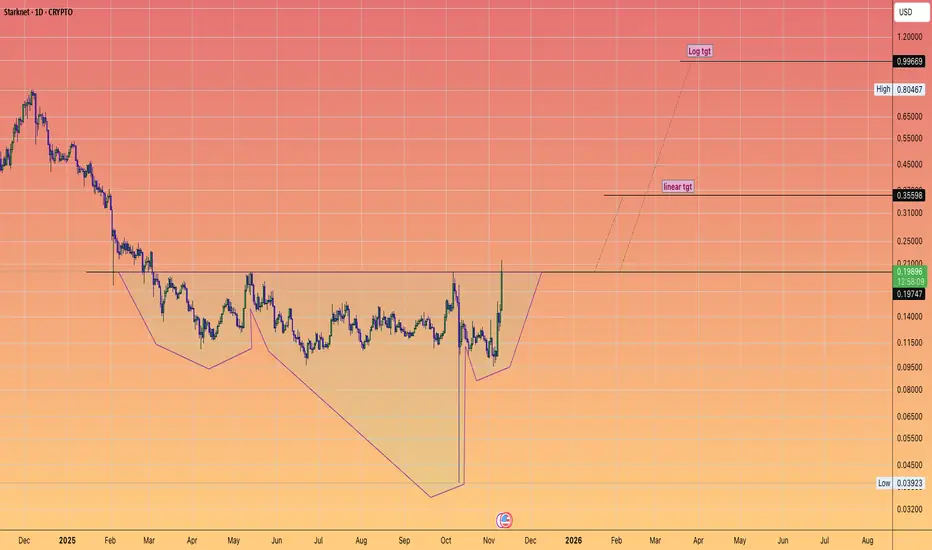
STARKNET went to zero (relatively speaking) But eyes $110/10 Was a Harrowing experience for many altcoin enthusiasts.
Which many are still dealing with the aftermath of psychologically and financially.
Those have been some of the best conditions that bring about the best returns in altcoins going forward.
When they have been beaten down to virtually zero
and when there is no one left to sell and only the strongest of hands remain.
Starknet is a good example of a coin that has reclaimed back all that damaging price action and is on the verge of a breakout.
There are many other #ALTS you could pick that have similar charts #DYOR
Starknet is just an example not saying this will be a fast horse or even remotely closest to being one of the fastest horses.
But the chart piqued my interest.
Share anything that peaks yours in the comments...
And I will be sure to have a look at it for you.
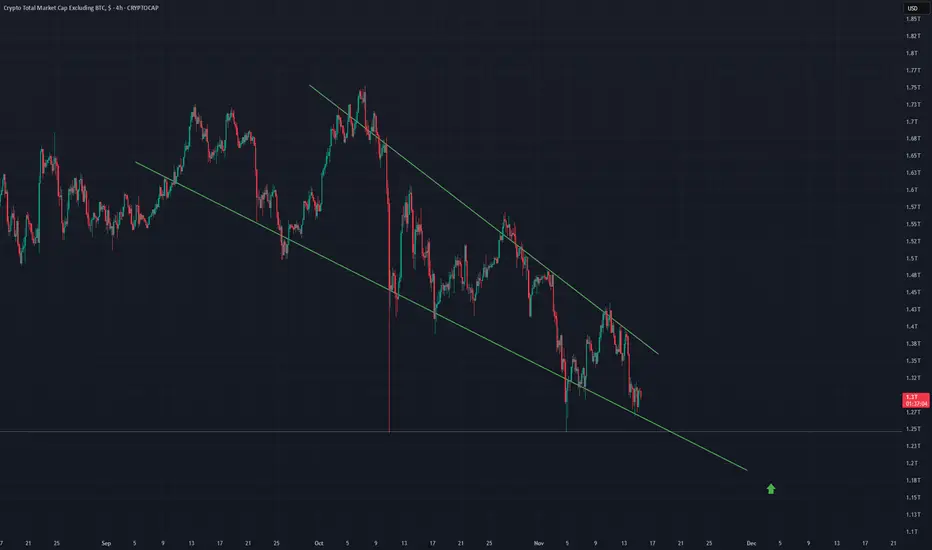
TOTAL2 - Falling Wedge A falling wedge during this downtrend on the 4Hr timeframe
These tend to break out bullishly once complete
TOTAL2 is the altcoin market which suggests an alt rally.
Lets see what happens once the formation completes.
BTC/USD: Pullback to 78-84K Zone, Then Bullish Reversal to 143-1Hey traders, Bitcoin's been on a tear, grinding past 95K today amid AI-fueled risk-on vibes and ETF inflows hitting record highs. But let's not get FOMO-blind—overbought signals are flashing, and a healthy retrace could set the stage for the next leg up. Here's my take: expect a dip to the 78-84K support cluster for a quick shakeout, followed by a bullish bounce targeting 143-153K by Q1 2026. This isn't a bear trap; it's fuel for the moonshot. Quick Setup (Daily/ Chart)Current Price: ~95,200
Key Driver: $1.2B in spot ETF buys last week, but whale profit-taking (e.g., 10K+ BTC dumps on-chain) screams "pause before blast-off." Broader macro: Fed's dovish tilt keeps the floor high.
The Dip: Why 78-84K?A classic ABC correction in this bull channel. We're likely in wave 4 of the grand Elliott impulse from the 2024 lows. Support confluence:78K: 0.618 Fib retrace from Oct ATH (92K) to recent low (68K); aligns with 200-day EMA (~77.5K).
84K: Psychological pivot + 50% Fib level; prior swing low from early Nov.
If we breach 84K hard? Invalidates—watch for 70K retest (unlikely, <20% prob). Volume profile shows thin selling there—perfect for absorption.
The Bounce: Bullish to 143-153KOnce we hold 78-84K, flip to longs. Expect a V-shaped reversal on capitulation volume, breaking the descending trendline from the mini-top at 98K.143K Target: 1.618 Fib extension of the dip wave; matches channel projection.
153K Upside: Measured move from 95K high—add 61.8% of the pullback range.
Catalysts: Holiday liquidity + potential Canary MOG ETF approval spillover (meme risk-on). Altcoin rotation could amplify.

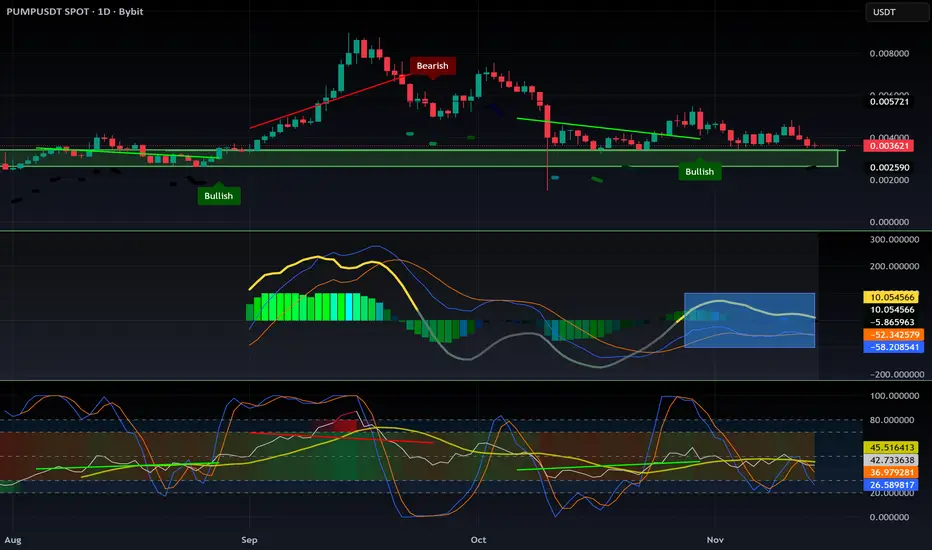
$PUMP: when to accumulate?There’s a strong support zone between $0.02900 and $0.03300.
At the current price, NYSE:PUMP already looks like an attractive buy in my opinion — but if it drops into the green box, I’ll definitely go long.
The lower it goes, the better the entry.
My plan is simple:
➡️ Enter
➡️ Take profit on a quick +10% move
➡️ Fire and forget
This asset is extremely volatile. There will be many more dips and plenty of trading opportunities — so stay cautious, get in and out fast, and don’t get greedy.
DYOR.
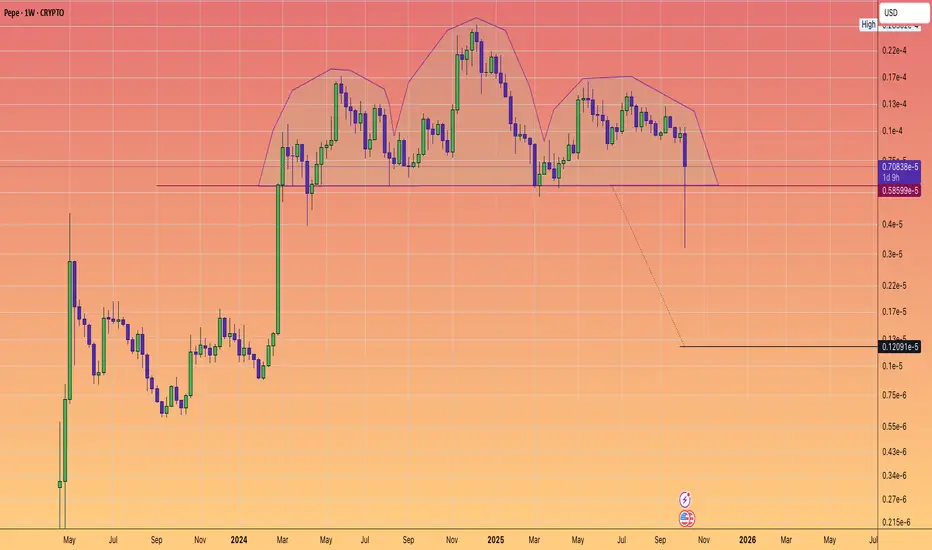
$PEPE: MAJOR HEAD and SHOULDERS BREAKDOWN WARNING.🐸🐸🐸
⚠️⚠️⚠️
Pattern formed, Big Move Ahead?
The weekly chart of #Pepe has confirmed a classic head and shoudlers pattern - a powerful bearish setup.
After over 1.5 years of building this structure, price decisively pierced the neckline with a sharp drop.
Suggesting that a weekly close below the neckline could trigger an accelerative towards the pattern target.
Key Levels
Neckline: $0.0000058599
Target: $0.0000012091
Why does it matter?
Head and shoulders are the most trusted reversal technical patterns. Coupled with declining and weakening sentiment. This pattern warns of more downside--- unless buyers can mount a quick rescue.
What's your strategy?
Are you shorting the breakdown, waiting for the target, or looking for a fake-out reversal?
Drop your thoughts/Analysis or questions in the comments!
DASH - BEARISH NASDAQ:DASH - bearish outlook 📉
Fallowing my yesterday's view: TP1 already ✅
58 - 57$ 🎯
52 - 50$ 🎯
44 - 45$ 🎯
#DASH #trading

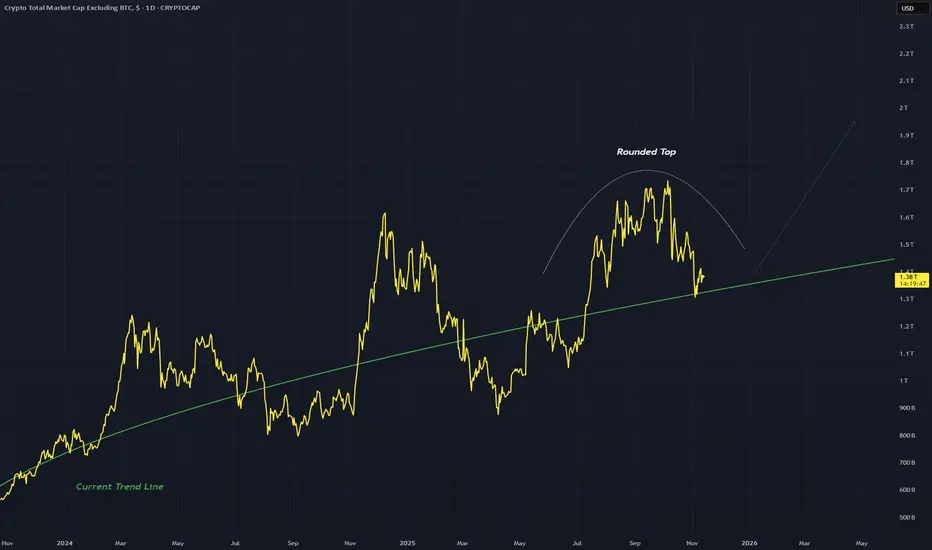
TOTAL2 - Daily Trend LineDrawn a trend line in green which i suspect to be respected following this rounded top structure and a breakout to the upside coming
Rounded tops usually follow with upward moves
Looking for big breakouts for alts!
Daily chart
XRP $17The Target 3 moon mission is preparing for launch.
The #Huntvolatility funnel is well underway.
Targets 1 and 2 have already been achieved and honoured.
In my humble opinion, we are poised to exceed many people's dream level of $10.
It's important to manage your risk as we ascend...
T3 may very well be exceeded.
However, it's crucial to adhere to your own trading strategy and financial objectives.
As we all know, the crypto market is extremely volatile.
Wishing everyone good luck.

BITCOIN in a LIVERMORE FunnelThe accumulation and distribution volume matches the positive and negative money flows of the first 5 waves in a Jesse Livermore stock cylinder.
Will wave 6 see a rush of positive money flow into #Bitcoin into the end of the year?
Let's see
If it does
then that will further cement this pattern of accumulation , sideways movement then breakout with continuation of buying power into the Bull market top.
Let's observe this in real time shall we?
Should be a fun few months ahead of us after a long period of churn.
S/O to @arvine11 for bringing up the Livermore stock trend analysis.

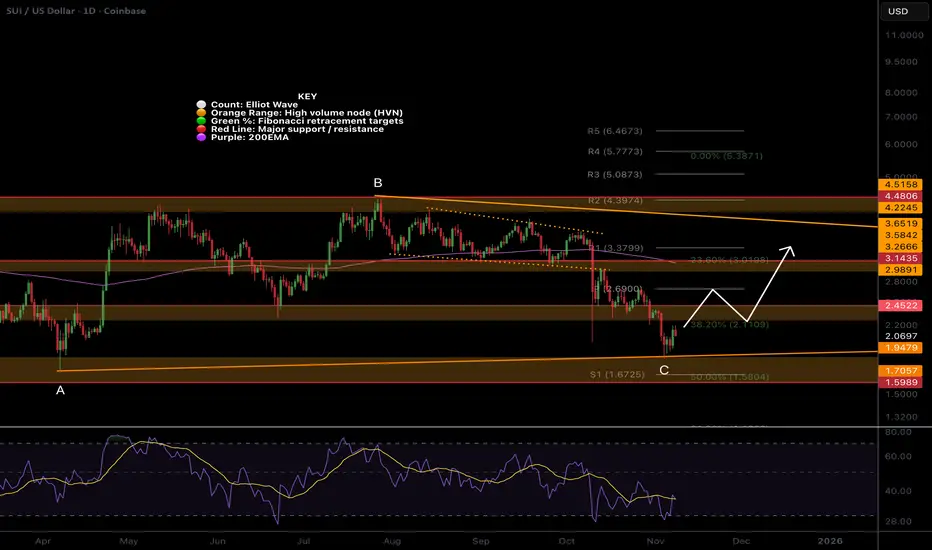
SUI remains in a shallow Fib triangleCRYPTOCAP:SUI Price remains in a downtrend, falling below a major High Volume Node support, tapping the macro triangle lower boundary.
Wave C of the triangle appears complete. If this count is correct, we should accelerate to the upper boundary around $3.6 over the next month or so, with some difficulty at the daily 200EMA and pivot as resistance.
📈 Daily RSI printed bullish divergence from oversold
👉 Continued downside loses the triangle pattern, and the next target is $1.6
Safe trading
SOL holds up wellCRYPTOCAP:SOL Price continues lower in the channel, a textbook ABC correction so far.
Wave 1 ended with a wedge throw-over. Price has found support above the Fibonacci golden pocket and High Volume Node at the channel's lower boundary. The probability is a continuation to the downside with a target of $140.
📈 Daily RSI tapped oversold with no divergence to suggest a bottom
👉 Continued downside brings up the $112 target, a great buy opportunity
Safe trading

ONDO,1 more push lowerLSE:ONDO Price is sitting just above High Volume Node support, testing the descending trend-line as resistance. As long as we are below the trend-line, the probability is to the downside.
Wave 2 appears complete after 5 waves down from the wave X flat correction. Price was front-run at the golden pocket Fibonacci retracement, but only a bounce so far. We are below the daily pivot and 200EMA, which is bearish.
📈 Daily RSI tapped oversold twice with slight bullish divergence.
👉 Continued downside has a target of the bottom of the High Volume Node at $0.5
Safe trading
