Buy the Dip on Amazon
BUY @ 200-210
Long hold
Still waiting for AMZN to catch up on the AI race, they have such great sticky ecosystem for leveraging AI integration in robotics, automation and IOT.
Not to mention the lacklustre monetization in their existing robotics arm.
On this aspect it is possible for almost full replacement of headcounts in AMZN's fulfilment centers with automation and robotics - hence heavy decrement in recurring manpower costs.
I foresee an amazon Trainium resurgence from Anthropic's collaboration with AWS.
Overall, adding a big bag to this one
Amazon

Amazon is fuelling up From the current price action, NASDAQ:AMZN looks like fuelling up. Bulls are charing up and I am looking for near term target to $215 to $220.
Large Bullish flow is seen for $250 Strike.

Buy AMAZON now!! Huge discount sale for an ecommerce behemoth!
Technical Analysis
- Triple bounce off $101 level with big reaction upwards,
- this region used to be resistance now flipped support.
- Its also the 61.8% retracement level (golden zone for a rebound)
- stochastic RSI was in oversold, now rebounding
Trades:
Short term traders can look for a LONG from current level
For long term traders this is a good region to BUY MORE AMAZON

Pull Back is RequiredAMZN Sell Setup - GETTEX:AMZ
Bearish Momentum on Daily Chart
Instrument: AMZN
Timeframe: Daily
Direction: Sell
Confidence: 75%
Setup Overview:
AMZN is showing bearish signals after a recent pullback. MACD has a bearish crossover, and RSI is overbought at 61.25, indicating potential for a downward move. VIX is rising, and 10-year yields are increasing, adding to market pressure. Social sentiment on X is mixed, but news sentiment leans bearish.
Trade Details:
Entry Price: $198.82
Profit Target: $182.23 (~5% downside)
Stop Loss: $205.61 (2:1 risk-reward ratio)
Position Size: 4% of portfolio
Expected Move: -5%
Key Indicators:
MACD: Bearish crossover
RSI: Overbought at 61.25
Market Context: Rising VIX, increasing 10-year yields
Follow for Best AI Signals on the market

Amazon: On the Rise AgainAmazon's stock has been painstakingly climbing upward over the past weeks. Currently, it appears to be in a broader sideways movement. Our primary scenario calls for a breakout to the downside to continue the downward beige wave IV. Afterward, we expect an upward move with the corresponding beige wave V, which should ultimately reach the top of the larger blue wave (V). Alternatively, an imminent breakout above the resistance at $259 could occur. In this scenario, the low of wave alt.IV would already be in place, and the stock would already be rising in wave alt.V , which could mark the high of the blue wave alt.(V) (33% probability).

AMZN Amazon Options Ahead of EarningsIf you haven`t bought AMZN before the rally:
Now analyzing the options chain and the chart patterns of AMZN Amazon prior to the earnings report this week,
I would consider purchasing the 260usd strike price Calls with
an expiration date of 2026-8-21,
for a premium of approximately $20.65.
If these options prove to be profitable prior to the earnings release, I would sell at least half of them.

A position I am in with AMZN puts! OptionsMastery:
🔉Sound on!🔉
📣Make sure to watch fullscreen!📣
Thank you as always for watching my videos. I hope that you learned something very educational! Please feel free to like, share, and comment on this post. Remember only risk what you are willing to lose. Trading is very risky but it can change your life!

AMZN Bullish SMA Pullback | Institutional Swing Setup🚀 AMZN: The AI Cloud King's Pullback Play! | Swing Trade Setup 💰
🎯 Instrument: Amazon.com Inc. (NASDAQ: AMZN)
⏱️ Timeframe: Multi-Day Swing Trade (3-7 days)
📊 Strategy Type: Bullish Mean Reversion + Technical Confluence
🔥 Confidence Level: Institutional Grade 📋
📌 THE SETUP (Current Price: $241.44)
Amazon is consolidating near critical support zones after a 60% rally from 52-week lows ($161.38 → $258.60). With earnings on Feb 5, 2026 and keynote expansion into AI data centers, this presents a textbook swing trade opportunity. 🤖
🎯 BULLISH THESIS
✅ Technical Confluence:
Simple Moving Average (SMA 50/200) providing dynamic support
Price bouncing off $228-$232 support zone (psychological + institutional levels)
Rounding bottom pattern forming (classic bullish reversal indicator)
✅ Fundamental Tailwinds:
AWS Growth Acceleration: Amazon Web Services driving 30%+ YoY revenue growth, commanding 17% of total revenue
AI Data Center Demand: Strategic copper deal with Rio Tinto signals massive capex into AI infrastructure (70% of cash flow allocated)
Retail Dominance: E-commerce segment (74% of revenue) shows 12.24% quarterly growth
Margin Expansion: EBITDA at $141.68B with 19.15% margin—highest in 3 years ⚡
Analyst Consensus: 63 out of 67 analysts rate BUY | Average target: $295.21 (+23% upside)
💎 ENTRY STRATEGY (Smart Laddering)
Use multiple limit buy orders to scale in smoothly (25% position per layer):
🎯 Layer 1: $239.50 - Confirmation of support
🎯 Layer 2: $236.00 - Intermediate zone
🎯 Layer 3: $232.00 - Key psychological level
🎯 Layer 4: $228.00 - Ultimate accumulation zone
Pro Tip: Adjust ±$2-3 based on daily price action. Stay flexible! 📍
🎯 PROFIT TARGET
Primary Target: $260.00 🏆
Secondary Target: $270.00 (Psychological resistance + prior resistance band)
Tertiary Target: $280.00 (Monthly resistance + analyst consensus)
Rationale:
Breaks above 52-week high of $258.60
Aligns with institutional resistance clusters
Captures pre-earnings momentum
Provides 7-17% unrealized gains ✨
🛑 RISK MANAGEMENT (Critical!)
Stop Loss: $227.00
Placement Reasoning: Below the $228-$232 support zone, closing a daily candle here signals bearish invalidation. Protects against surprise earnings miss or macro headwinds.
Risk-Reward Ratio: 1:3.2 (Excellent! 🎲)
Position Sizing: Never risk more than 1-2% of total portfolio on this single trade
📈 RELATED PAIRS TO MONITOR (Correlation Watch) 🔗
🔴 NASDAQ:MSFT (+0.89) – AI competitor strength | Watch $450 breakout
🔴 NASDAQ:NVDA (+0.85) – Chip demand barometer | AWS data center proxy
🔴 NASDAQ:META (+0.82) – Big Tech sentiment | CapEx cycle correlation
🔴 NASDAQ:QQQ (+0.91) – Tech sector ETF | Leading indicator (must hold support)
🔵 TVC:DXY (-0.67) – US Dollar | Stronger $ = headwind for exports
🔵 TVC:VIX (-0.73) – Market volatility | Avoid entry if VIX > 18
⚡ Entry Rule: Wait for NASDAQ:QQQ support confirmation + TVC:VIX below 18 before scaling in! 📊
🌍 MACROECONOMIC & FUNDAMENTAL FACTORS (Feb 2026 Preview)
🔴 HEADWINDS:
FTC Antitrust Scrutiny: Regulators targeting Amazon's marketplace practices (watch for policy shifts)
Layoff Execution Risk: 30,000 job cuts (16K announced Jan 2026) could disrupt operational efficiency short-term
UPS Relationship Breakup: UPS cutting Amazon logistics services = inventory delays possible
Fresh/Go Store Closures: Grocery pivot failing signals capex inefficiency narrative ⚠️
🟢 TAILWINDS:
Earnings on Feb 5: Market historically rewards AWS guidance beats (watch for capex/AI commentary!)
AI Investment Cycle: Amazon's copper deal proves long-term AI data center commitment—signals confidence 🚀
Cloud Market Growth: Gartner projects 20%+ IaaS growth through 2026
International Expansion: Germany, UK, Japan segments showing 8%+ growth
Prime Video Monetization: Ad-tier rollout driving revenue diversification ✨
⏰ Calendar Alerts:
Feb 5, 2026: AMZN Q4 Earnings (Critical!)
Feb 10-15: Analyst callout periods (watch for price gaps)
Mid-Feb: Potential macro Fed commentary on rates (impacts growth stocks)
💼 TRADE EXECUTION CHECKLIST
✅ Pre-Entry:
Wait for daily close above $241 (confirmation)
Check NASDAQ:QQQ support (must be intact)
Verify TVC:VIX < 18 (low volatility environment)
Place all four limit orders simultaneously
✅ During Trade:
Scale in gradually (don't FOMO all at once!)
Adjust stops to breakeven once 25% profit reached
Move stops up by $2 after each 5% gain
Monitor pre-earnings catalysts daily
✅ Exit Plan:
Trail stop at $255 once $260 zone approaches
Take 50% profits at $260 (lock in gains!)
Let remaining 50% ride to $270-$280
Close all positions by Feb 4 (earnings risk!)
⚡ THE FUNNY, PROFESSIONAL TRUTH 😄
Look, the market doesn't care about your feelings or your "fool-proof strategy." What it does care about:
Supply/Demand imbalances (Your limit orders create that!)
Risk-to-Reward ratios (3.2:1 = Institutional quality!)
Catalyst timing (Earnings Feb 5 = This is your window!)
Position sizing discipline (1-2% risk = Sleep-at-night money!)
This isn't about getting rich quick—it's about compounding consistent 5-8% swing trades into generational wealth. Amazon at $241 with $260 targeting is math. The rest is emotional control. 💪
Your engagement directly helps me dedicate more time to institutional-grade swing trade analysis. Much appreciated! 🙏
Happy Trading! May your exits be as smooth as your entries. 📊✨

Amazon - A quite boring new all time high!🎈Amazon ( NASDAQ:AMZN ) is simply heading for new highs:
🔎Analysis summary:
For the past couple of months, Amazon has overall just been consolidating. But in the meantime, we witnessed a major bullish break and retest and an expected rally of +50%. Following this quite slow behavior, Amazon will also slowly create new highs.
📝Levels to watch:
$250
SwingTraderPhil
SwingTrading.Simplified. | Investing.Simplified. | #LONGTERMVISION

AMAZON Can it correct to $150?Amazon (AMZN) has stalled its massive rally since the April 2025 Low as since November 03 it has been unable to make a new All Time High (ATH). That is because that day it hit a key Resistance, its 5-year Higher Highs trend-line, technically the top of its long-term Channel Up.
The resulting correction found Support on its long-term level o 1W MA50 (red trend-line), which has been holding firmly since mid may 2025. Given the similar 1W RSI Bearish Divergence to 2021, we believe the market has already topped and will start a new Bear Cycle correction. But in order for this to be confirmed, the price needs to close its first 1W candle below the 1W MA50.
If that takes place, we expect a first sell-off towards the 1W MA200 (orange trend-line) and then after a rebound, bearish continuation to at least the 1M MA100 (blue trend-line), which is where the previous Bear Cycle bottomed in late December 2022. Based on its current trajectory, we see a potential contact at $150.
Note that a full Bear Cycle, similar to 2022 (which is only realistic if the stock closes a month (1M candle) below the 1M MA100, as it has been holding since November 2026!), could lead us to a total -57% correction, a little below $115.
---
** Please LIKE 👍, FOLLOW ✅, SHARE 🙌 and COMMENT ✍ if you enjoy this idea! Also share your ideas and charts in the comments section below! This is best way to keep it relevant, support us, keep the content here free and allow the idea to reach as many people as possible. **
---
💸💸💸💸💸💸
👇 👇 👇 👇 👇 👇

Amazon: Momentum ShiftIn the first weeks of the year, Amazon's stock continued its upward trajectory. However, this upward momentum came to a halt last Tuesday. Since then, the bears have taken charge and thus align more closely with our primary scenario, which calls for the current downtrend to persist, with the low of the beige wave IV forming just above the support at $160.50. Afterward, we anticipate an upward movement in the same-colored wave V, which should eventually lead to the peak of the larger blue wave (V). Our alternative scenario, however, suggests that the stock could directly break through the resistance at $259. In this case, we would consider the low of the beige wave alt.IV as already established (probability: 33%).

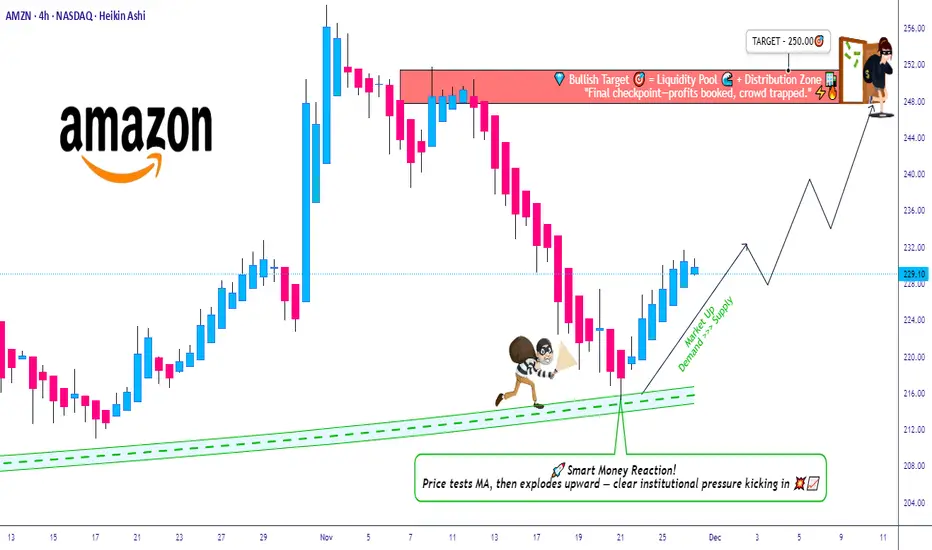
AMZN Breakout Reload? TMA Pullback Shows Buyer Strength🔥 AMZN Swing Trade Profit Playbook | Bullish Pullback + Thief Layering Strategy 🟢📦
Welcome back, Ladies & Gentlemen — the Thief OG’s 😎🕵️♂️
Here’s a polished, rule-friendly breakdown of the bullish setup developing on AMZN (Amazon.com Inc.) – NASDAQ.
📌 Market Context
AMZN is showing a clean bullish pullback into the Triangular Moving Average (TMA) zone, supported by a Heikin Ashi Doji Reversal, signaling that buyers are gaining strength and attempting to dominate momentum again. 📈🔥
🧠 Trade Plan (Swing Trade)
Plan:
A bullish pullback strategy confirmed by:
🔺 Triangular Moving Average pullback reaction
🟩 Heikin Ashi reversal-doji indicating potential trend continuation
📊 Buyers stepping in with momentum recovery
🎯 Entry Plan – Thief Style Layering (Multiple Limit Orders)
This is the famous Thief Strategy — using layered limit orders to scale into the move like a master of stealth 😎🕵️♂️💼
(TradingView-safe version: purely educational, optional, trade at your own risk.)
Layered Buy Limits:
🟢 215.00
🟢 220.00
🟢 225.00
🟢 230.00
(You may increase or adjust layers based on your own style and risk tolerance.)
🛑 Stop-Loss (Thief Style Educational Version)
SL Zone (Optional):
❌ 210.00
⚠️ Note: Dear Ladies & Gentlemen (Thief OG’s), this level is NOT a recommendation — it’s just part of the thief-style educational breakdown.
Choose your own risk plan, trade your own analysis.
🎯 Target Zone
The “Police Force” 🚓 — aka strong resistance, potential overbought zone, and liquidity trap area — sits around:
🟡 Target @ 250.00
⚠️ Note: Dear Ladies & Gentlemen (Thief OG’s), this is NOT a fixed TP recommendation.
Manage your profits as per your own risk appetite and strategy.
📡 Related Pairs to Watch (Correlation & Market Behavior)
Watching correlated tickers helps understand broader tech-sector sentiment and liquidity rotation.
Here are the key names to keep an eye on:
📌 NASDAQ:AAPL (Apple Inc.)
Strong correlation with AMZN in tech-momentum cycles.
When AAPL shows bullish continuation, AMZN often follows with similar pressure.
📌 NASDAQ:META (Meta Platforms Inc.)
Tracks consumer-tech spending sentiment.
Strong META moves can hint at acceleration across NASDAQ growth stocks.
📌 NASDAQ:MSFT (Microsoft Corp.)
A heavyweight pillar in NASDAQ.
MSFT strength boosts overall tech-index bullish bias.
📌 NASDAQ:QQQ (Invesco NASDAQ-100 ETF)
The main sentiment gauge.
If QQQ remains above its trend structure, AMZN's bullish continuation gets stronger confirmation.
📌 NASDAQ:TSLA (Tesla Inc.)
Not directly correlated, but impacts NASDAQ volatility dynamics.
High volatility in TSLA often ripples into liquidity behavior across the index.
💬 Final Thoughts
This AMZN setup blends structure, momentum, and multi-layer entries, crafted in a fun Thief-style teaching format while keeping everything compliant and research-focused 📚✨
Trade smart, manage risk, escape with profits when the “police” show up 🚓😆📈
✨ “If you find value in my analysis, a 👍 and 🚀 boost is much appreciated — it helps me share more setups with the community!”
⚠️ Disclaimer
This is a Thief-style trading strategy presented just for fun & educational purposes only.
Not financial advice. Do your own analysis and manage risk responsibly.
#AMZN #Amazon #SwingTrade #NASDAQ #BullishSetup #PullbackStrategy #HeikinAshi #TriangularMovingAverage #ThiefStrategy #LayeringEntries #TradingEducation #StockMarket #MarketAnalysis #TradingViewCommunity #EditorPickReady 🚀
RIVN Crossroads: Can We Reclaim $20.61 for a Run to $27... and beyond for the rest of 2026?
while the recent suspension recall and CEO share sale have pushed the price down about 9%, the volume indicators tell a much different story than the headlines.
The Thesis: Despite the pullback the past 3 days, we are seeing a significant Bullish Divergence on the OBV and A/D lines. While retail is panic-selling the recall news, the 'Smart Money' indicators (CMF and Cumulative Volume Delta) are actually rising or holding steady.
This suggests the dip is being absorbed by institutional buyers.
Key Levels to Watch:
Support: If we hold the $19.50 zone through this week, the 'shakeout' is likely over.
Resistance: $20.61 is the immediate pivot. A break above this validates a move toward the $27 supply zone.
Catalyst: All eyes are on the February 12th earnings for R2 platform updates.
Don't forget the strategic partnership with #AMZN which is a major shareholder.

AMAZON - EMA 200: Where Institutions Step InAMZN - CURRENT PRICE : 237.70
📈 AMZN — Institutional Support Holds, Momentum Breakout
AMZN continues to trade in a primary uptrend, with EMA 200 acting as a strong institutional accumulation zone. Multiple pullbacks toward the EMA 200 (highlighted in green) were met with immediate buying interest, confirming long-term demand.
Momentum is now turning bullish:
🔥Price has broken back above the Ichimoku Cloud, signaling trend resumption.
🔥RSI is crossing above the 60 level, a classic sign of bullish momentum acceleration.
This setup favors momentum traders looking to enter as the uptrend resumes.
ENTRY PRICE : 235.00 - 237.80
TARGET : 258.00 (All Time High level)
SUPPORT / INVALIDATION : EMA 200
📌 As long as price holds above EMA 200, the bullish structure remains intact.

Amazon: Persistent Upward PressureAmazon initially continued its upward trajectory, extending the rise until January 2. There was a brief pullback of about 4% afterward, but it was quickly recovered. Consequently, price again reached the levels observed before the holiday season. In line with our primary scenario, we expect price to turn downward to carve out the final low of the beige wave IV. Ideally, this bottom should be formed above the support at $160.50. Subsequently, wave V should unfold and continue the overall upward trend. However, if Amazon breaks directly above the resistance at $259, it could suggest that the low of wave alt.IV in beige has already been established. The probability of this alternative scenario is 33%.

Amazon $AMZN weekly demand level at $221 is holdingAmazon weekly demand level at $221 is holding as expected. Amazon stock is trying to to print a new weekly high. Any long positions should be managed. Waiting for new imbalances and weekly highs.

AMZN: Rebuilding Structure After Sharp RotationOn the 4H chart, AMZN shows a sharp impulsive move followed by a volatile pullback and stabilisation. Price is now rebuilding structure after the rotation, suggesting the market is recalibrating before the next directional phase develops.
Disclosure: We are part of Trade Nation's Influencer program and receive a monthly fee for using their TradingView charts in our analysis.

AMZN: Technical Outlook and New Year TargetsNASDAQ:AMZN : Technical Outlook and New Year Targets
Following its recent all-time high (ATH) near $260, Amazon (AMZN) has entered a corrective phase, currently trading around the $230 level.
This retracement raises two key questions for the coming months: how deep will this pullback go, and what are the primary targets for investors heading into 2026?
Technical Analysis and Key Levels.
The current price action suggests a healthy cooling-off period after a significant rally. From a technical perspective, there are two primary scenarios to monitor:
Scenario A:
Retest of the Ascending Trendline The stock may continue its gradual descent toward the primary ascending trendline. This support zone, located approximately between $220 and $223, represents a high-confluence area where long-term buying pressure has historically resumed.
Scenario B: Immediate Support Defense Alternatively, the bulls may defend the current $230 psychological level. If buyers show strength here, it would indicate a shallow correction before a move back toward previous highs.
Strategy and Risk Management.
For those looking to build or add to a position, the $220 – $223 zone offers a compelling risk-to-reward ratio.
Upside Targets:
The initial objective remains a retest of the $260 ATH. If momentum continues, the next major psychological extension sits at $300.
Risk Mitigation:
While this analysis focuses on a mid-to-long-term horizon, active traders might consider the $200 zone as a critical area for a stop-loss, as a break below this level could invalidate the current bullish structure.
Disclaimer
This analysis is for educational and informational purposes only and does not constitute financial or investment advice. Trading involves significant risk, and you should consult with a professional advisor before making any financial decisions.

MSTR EXITING DEC 29 2025I am exiting Mstr almost cost to cost as i feel there are way better stocks to trade than this.
Yes, it can definitely go up but I would like to put my in way better opportunities out there
If you are going long make sure to always consider STOPS
I am exiting

Amazon stock weekly demand is still in controlAmazon stock weekly demand at $221 is still in control and is trying to play out as expected. Any long positions should be managed. Let's see if there any new bullish legs printed in the following days.

Amazon - The Hidden OpenAI Play Before IPO, $210-220 SupportAmazon - The Hidden OpenAI Play Before IPO, $210-220 Support Entry
Amazon: Positioning as OpenAI's Infrastructure Partner Before the IPO Window
While the market focuses on Microsoft as OpenAI's primary partner, Amazon is quietly positioning itself as the diversification play that could unlock billions in recurring AI infrastructure revenue. With a minimum $10 billion commitment to OpenAI and strategic discussions around custom AI chip deployment, Amazon offers exposure to the OpenAI growth story at a structural support level that provides defined entry risk.
🎯 The Strategic Play:
Amazon's $10 Billion OpenAI Commitment:
Amazon has committed at least $10 billion to OpenAI, but this isn't just a financial investment - it's a strategic infrastructure partnership. The deal positions Amazon Web Services (AWS) as OpenAI's diversification partner away from Microsoft Azure dominance.
Why This Matters:
Reduces single-vendor risk for OpenAI's massive compute needs
Opens AWS as a hosting platform for OpenAI workloads
Custom chip integration potentially using Amazon's Trainium/Inferentia
Equity stake gives Amazon ownership upside if/when OpenAI goes public
Alexa integration potential for next-generation AI assistant capabilities
Current Market Context:
AMZN Price: $200-240 range
Market Cap: ~$2.4 trillion
Technical Setup: Testing major support zone
Catalyst Timeline: OpenAI infrastructure decisions and potential IPO window
📊 Why $210-220 is the Entry Zone:
Technical Support Confluence:
The $210-220 area represents a critical accumulation zone where multiple technical factors converge:
Previous consolidation support from earlier 2024 trading
Volume profile node showing institutional buying activity
Psychological level near $200 round number
Pullback into demand after extended rally earlier in year
Risk/Reward at Support:
Entry: $210-220 zone
Stop: Below $200 (psychological and structural support)
Target 1: $280 (previous resistance, 30% upside)
Target 2: $320 (extension target, 50% upside)
Risk/Reward: 5:1 to 8:1 depending on exact entry
Why Now:
Market has pulled back from highs, creating entry opportunity before OpenAI infrastructure announcements and potential IPO catalysts materialize in 2025.
💡 The OpenAI Infrastructure Angle:
Microsoft's Monopoly Problem:
OpenAI currently relies heavily on Microsoft Azure for compute infrastructure. This single-vendor dependency creates:
Risk concentration if Azure faces issues
Pricing leverage for Microsoft
Capacity constraints during demand spikes
Strategic limitation in vendor negotiations
Amazon as Plan B (and Eventually Plan A?):
If OpenAI shifts even 20% of compute workloads to AWS, that translates to:
Billions in recurring AWS revenue (high-margin cloud business)
Multi-year contracts providing revenue visibility
Upselling opportunities for other AWS services
Competitive positioning against Microsoft in AI infrastructure
The Math:
OpenAI's compute costs are estimated in the billions annually and growing exponentially. A 20% shift to AWS could represent:
$2-4 billion annual revenue for Amazon (conservative estimate)
70%+ margins on cloud infrastructure
Recurring nature creates compounding value
🔧 Amazon's Custom AI Chip Advantage:
Trainium and Inferentia:
Amazon has developed custom AI chips specifically for training and inference workloads:
Cost Advantage:
40% cheaper than Nvidia H100 GPUs (industry standard)
Better price/performance for specific workloads
No Nvidia supply constraints (Amazon controls production)
Strategic Importance:
Reduces CAPEX for OpenAI's massive compute needs
Faster deployment without Nvidia waitlists
Customization potential for OpenAI-specific workloads
OpenAI Exploring Amazon's Chips:
Reports indicate OpenAI is actively evaluating Amazon's AI chips. If adopted:
Validates Amazon's chip strategy
Creates dependency on AWS ecosystem
Locks in multi-year infrastructure relationship
🤖 Alexa Integration Wildcard:
The Opportunity:
Amazon's Alexa has struggled to compete with newer AI assistants. OpenAI integration could transform Alexa into:
ChatGPT-powered voice assistant with superior conversational AI
Multi-modal capabilities (voice, vision, reasoning)
Competitive parity with Google Assistant and Siri
Monetization vehicle for premium AI features
Why It Matters:
Alexa is in 500+ million devices globally
Integration would be immediate distribution for OpenAI
Creates consumer-facing AI revenue stream for Amazon
Differentiates Echo devices in smart home market
💰 The Equity Upside:
Amazon Gets OpenAI Equity:
As part of the $10 billion investment, Amazon receives equity in OpenAI. If OpenAI goes public (rumored $100B+ valuation):
Scenario Analysis:
Conservative: Amazon owns 2-3% of OpenAI at $100B valuation = $2-3B equity value
Moderate: Amazon owns 5% at $150B valuation = $7.5B equity value
Aggressive: Amazon owns 8% at $200B valuation = $16B equity value
Double Upside:
Infrastructure revenue: Billions annually from AWS hosting
Equity appreciation: Ownership stake in OpenAI's growth
This is rare - Amazon gets paid to host the workloads AND owns part of the company.
📈 Why Amazon vs. Microsoft:
Microsoft Already Priced In:
Market cap reflects OpenAI partnership expectations
Azure revenue already includes OpenAI contribution
Limited upside surprise potential
Amazon is the Surprise Factor:
Market underestimates AWS diversification opportunity
OpenAI partnership not fully reflected in valuation
Chip strategy under-appreciated by analysts
Alexa integration potential ignored
Risk Diversification:
Rather than betting on Microsoft maintaining 100% of OpenAI infrastructure, Amazon represents the diversification trade that captures:
20-30% of OpenAI compute (realistic scenario)
Equity upside if OpenAI IPOs
Alexa transformation potential
Broader AI chip validation
📊 Fundamental Context:
Amazon's Core Business:
AWS: ~$90B annual revenue, 30%+ margins (crown jewel)
E-commerce: Dominant market position, improving margins
Advertising: $45B+ business growing 20%+ annually
Free cash flow: $50B+ annually
Why Support Holds:
At $210-220, Amazon trades at reasonable valuations considering:
AWS growth acceleration from AI workloads
Margin expansion as efficiency initiatives mature
Advertising becoming major profit center
OpenAI partnership optionality (free upside)
Institutional Behavior:
Major funds accumulate mega-cap tech at support levels
$200-220 zone represents algorithmic buy programs
Long-term investors view pullbacks as entry opportunities
🎯 Trade Structure:
Entry Strategy:
Aggressive: $220 area (current technical support)
Conservative: $210 (psychological support, higher conviction)
Scale in: Buy 50% at $220, 50% at $210 if it gets there
Risk Management:
Stop loss: Below $200 (invalidates support thesis)
Position size: Appropriate for 5-10% portfolio allocation (mega-cap)
Timeframe: 6-12 months for full thesis to develop
Target Zones:
TP1: $260 (20% gain, previous resistance)
TP2: $280 (30% gain, reduce another third)
TP3: $320+ (50% gain, major resistance zone)
Catalyst Timeline:
Q1 2025: Potential OpenAI infrastructure announcements
Q2 2025: AWS earnings showing AI revenue growth
H2 2025: OpenAI IPO window potentially opens
Throughout: Alexa integration rumors/announcements
🧠 Why Most Will Miss This:
Microsoft Tunnel Vision:
Everyone watches MSFT as "the OpenAI stock" - Amazon's positioning is overlooked despite potentially better risk/reward.
Mega-Cap Bias:
At $2.4T market cap, traders assume Amazon "can't move much." But 30-50% gains on a $20-30 billion investment theme is massive absolute dollars.
Infrastructure Complexity:
Most investors don't understand cloud infrastructure economics. They miss that AWS hosting OpenAI is higher-margin than most of Amazon's businesses.
Timing Fear:
Buying at $220 after the stock has pulled back from $250+ feels uncomfortable. But that's precisely when technical support + fundamental catalysts create opportunity.
📅 Catalyst Timeline and Expectations:
Near-Term (Q1 2025):
OpenAI infrastructure announcements
AWS re:Invent conference AI reveals
Potential Amazon chip deployment news
Mid-Term (Q2-Q3 2025):
AWS earnings calls highlighting AI workload growth
Alexa AI integration announcements
OpenAI compute diversification details
Long-Term (H2 2025+):
OpenAI IPO window potentially opening
Amazon equity stake value becomes visible
Multi-year AWS infrastructure contracts disclosed
⚠️ Risk Factors:
What Could Go Wrong:
OpenAI Stays With Microsoft:
If OpenAI decides not to diversify infrastructure significantly, Amazon loses the thesis catalyst. However, the $10B investment still provides equity exposure.
Chip Strategy Fails:
If OpenAI doesn't adopt Amazon's custom AI chips, the cost advantage and ecosystem lock-in don't materialize.
Market-Wide Correction:
Mega-cap tech could face broad selling pressure regardless of individual catalysts. The $200 support could break in a risk-off environment.
OpenAI Stumbles:
If OpenAI faces competitive pressure from other AI companies or regulatory issues, the infrastructure opportunity diminishes.
Valuation Compression:
At $2.4T market cap, Amazon needs significant catalysts to drive meaningful appreciation. If AI growth disappoints, multiple compression could occur.
🏆 The Professional Approach:
They See The Setup:
Technical support at $210-220
Fundamental catalyst (OpenAI partnership)
Asymmetric risk/reward (5:1+)
Multiple paths to upside (AWS, equity, Alexa)
They Size Appropriately:
Mega-cap reduces position risk
Liquid market allows easy scaling
5-10% portfolio allocation reasonable
They Think Long-Term:
6-12 month catalyst timeline
Not a day trade or swing trade
Allows thesis time to develop
They Scale Out:
Take profits at $260, $280, $320
Don't try to pick the perfect exit
Lock gains progressively as targets hit
📌 Key Investment Thesis Points:
✅ $10B+ OpenAI investment positions Amazon as infrastructure diversification partner
✅ 20% compute shift could mean $2-4B annual AWS revenue (high margin)
✅ Custom AI chips provide cost advantage and ecosystem lock-in
✅ Equity stake in OpenAI provides IPO upside (potentially worth billions)
✅ Alexa integration could transform 500M+ device install base
✅ Technical support at $210-220 provides defined entry with tight risk
✅ 5:1+ risk/reward to structural targets with multiple catalyst paths
📊 Investment Summary:
Why Amazon:
Hidden OpenAI infrastructure play
Better risk/reward than Microsoft
Multiple upside paths (AWS, equity, Alexa)
Entry at technical support
Mega-cap liquidity and safety
Why Now:
Pullback to $210-220 support zone
Before OpenAI infrastructure announcements
Ahead of potential IPO window
Market underpricing the opportunity
Why $210-220:
Technical support confluence
Institutional accumulation zone
Risk defined below $200
5:1+ reward/risk to targets
⚠️ Important Disclaimers:
This analysis is for educational purposes and reflects a view on Amazon's strategic positioning with OpenAI. It is not financial advice or a recommendation to buy or sell AMZN or any security.
The OpenAI partnership details are based on publicly available information and reports. Actual infrastructure usage, revenue impact, and equity terms may differ significantly from estimates presented.
Amazon is a mega-cap stock with many business lines. The OpenAI opportunity represents only one potential growth driver among many factors affecting valuation.
Stock prices can decline significantly even when fundamental theses are correct. The $210-220 support could fail, and the OpenAI catalysts may take longer to materialize than expected or may not occur at all.
Technology sector investments carry specific risks including regulatory changes, competitive dynamics, and rapid innovation cycles. Position sizing must account for volatility even in large-cap names.
Always conduct independent research, consider your risk tolerance and investment timeframe, and consult with financial professionals. All investing involves risk of loss.
✨ Your Take:
Are you viewing Amazon as an OpenAI infrastructure play? How do you evaluate the AWS/OpenAI opportunity versus the Microsoft Azure relationship? Share your perspective in the comments.
📜 Buy structure. Diversify exposure. Think long-term.

$Amzn Are You Finished or Are you Done? S/O to Birdmard just because I love that wild ass statement; Lol.
So I've been on NASDAQ:AMZN for a week now and I Learned a Lesson from it last week wicking 1.272 action. So I'm back to perhaps call it from the bottom of where its at currently. But check this is out, I generally only have my fibs to show on the level I chart on, (I dont want to see it on another time frame.) Well, this morning; I guess I hadn't turned my motor all the way on and I read my 1 HR fibs on the 15 mins and got into some 225 Amazon calls only to realize that this is my 1 Hr TF fibs not the 15 mins (Which is what I trade every day). So, this NASDAQ:AMZN Chart Image is Charted on the 1 HR TIME FRAME, but the Image I posted is on the 15 min TF. #Calls
Happy Trading, Alerts Set!

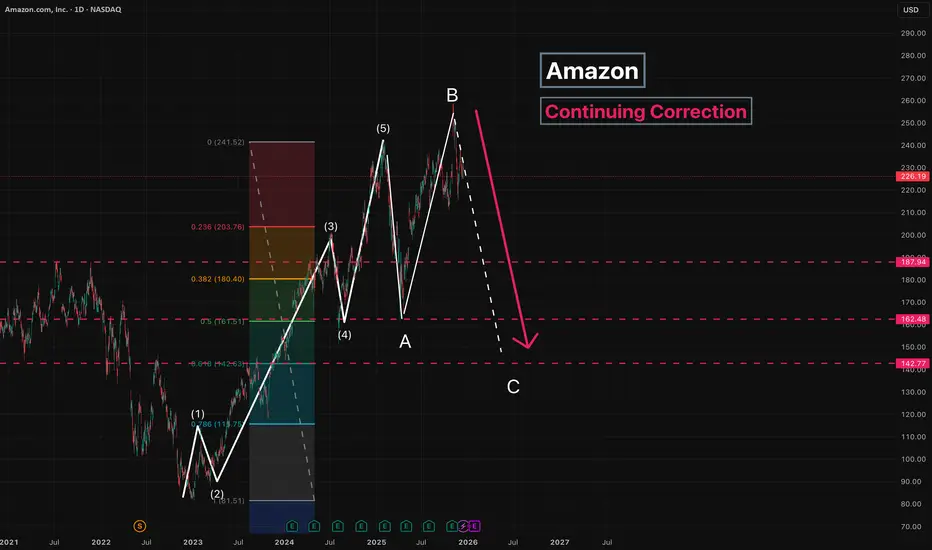
Amazon - Continuing CorrectionThe correction is ongoing, and wave C has started to form.
Since wave B is longer than wave A , wave C is expected to move below the low of wave A .
Main target: 142
Intermediate target: 187
---
Please subscribe and leave a comment.
You’ll get new information faster than anyone else.
---