Amazon(NASDAQ: $AMZN) Invests $3B in New Mississippi AI Data HubAmazon.com (NASDAQ: NASDAQ:AMZN ) announced plans to invest at least $3 billion in a new data-center campus located in Warren County, Mississippi. The project will support Amazon Web Services’ expanding AI and cloud-infrastructure needs, reinforcing AWS’s position as the company’s fastest-growing and most profitable segment.
The data-center development is expected to create more than 200 direct jobs at the site and support over 300 additional roles in the surrounding region. Amazon highlighted that the expansion will power next-generation AI workloads, machine-learning services, and global cloud capacity. The investment also deepens Amazon’s long-term footprint in the southeastern U.S., aligning with rising demand for high-compute environments across industries.
This move follows a broader trend of hyperscale cloud providers accelerating infrastructure spending to compete for AI-focused enterprise customers. With AWS already serving as the global leader in cloud services, the investment signals Amazon’s intention to maintain a technological and commercial edge amid intensifying competition from Microsoft Azure and Google Cloud.
Technical analysis:
Price is pulling back from heavy resistance at $258 and correcting toward the ascending trendline support. This level acts as a significant weekly demand area and aligns with the broader structure guiding the uptrend.
A strong bullish reaction from the trendline would likely set up another retest of the $258 highs. A clean break above that zone opens the door toward $280–$300, supported by long-term Fibonacci projections and sustained strength in AWS earnings.
If the trendline level breaks, the next key support sits at the horizontal support that has carried Amazon’s stock since early 2021. Overall, the setup remains bullish as long as price holds above the trendline.
Amazon
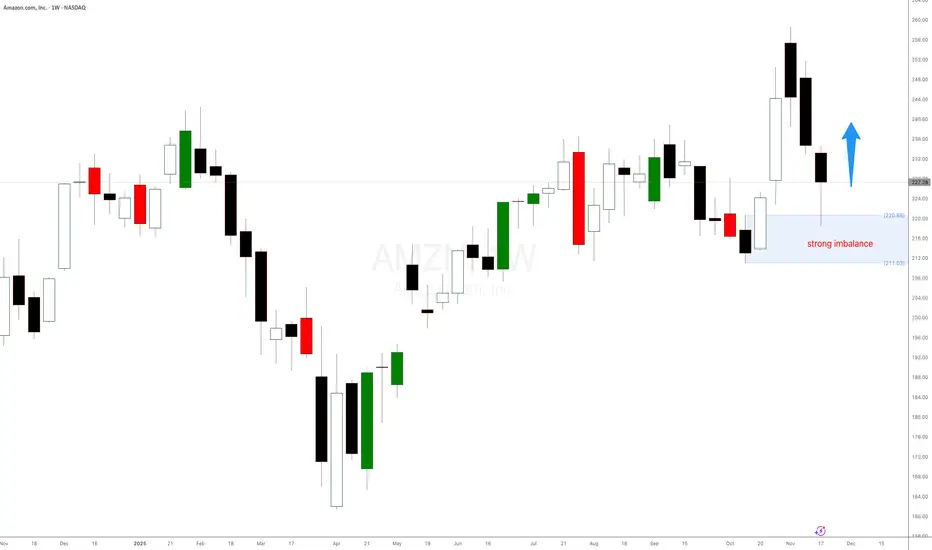
Is Amazon exploding again? New weekly demand in controlIs Amazon exploding again? New weekly demand in control at $224. Expecting a decent rally from here in the following days.
Amazon (AMZN) Shares PlungeAmazon (AMZN) Shares Plunge
As the chart shows, Amazon (AMZN) shares fell to around $222 yesterday, despite trading above $255 at the start of the month.
The price drop is the result of several factors, including:
→ A rating downgrade from Rothschild & Co. Redburn (to “Neutral”). Analysts doubt that Amazon’s massive investments in artificial intelligence will pay off as quickly as its earlier spending on cloud technologies once did.
→ Pressure from the Federal Trade Commission (FTC). A court hearing on accusations that Amazon engaged in anti-competitive practices and overcharged US households (by more than $1bn) has been officially scheduled for February 2027.
Technical Analysis of Amazon (AMZN)
Reviewing the chart from 3 November (when the price climbed above $250 following a strong earnings report), we:
→ used the fluctuations in AMZN’s share price to outline an ascending channel (shown in blue);
→ suggested that the initial reaction to the report might have been overly optimistic and pointed to a potential corrective move.
However, the subsequent decline of more than 13% from the November peak appears too deep to be considered a mere correction – the price is now below where it stood before the report was released. It is reasonable to assume that the surge in AMZN above the psychological $250 level on strong news was used to lock in profits from large long positions, and that market sentiment has since shifted dramatically.
Nevertheless, in the short term, AMZN traders may look for a rebound from the lower boundary of the channel. In the longer run, a bearish breakout from the current channel should not be ruled out – especially if news flow around AI takes a gloomier turn. Today, all eyes are on Nvidia’s (NVDA) earnings report.
This article represents the opinion of the Companies operating under the FXOpen brand only. It is not to be construed as an offer, solicitation, or recommendation with respect to products and services provided by the Companies operating under the FXOpen brand, nor is it to be considered financial advice.

Amazon Raises $15B for AI Expansion — Stock at Key Support ZoneAmazon has launched its first US dollar bond sale since 2022, securing $15 billion to accelerate investments in AI infrastructure. Demand was massive, reaching $80 billion, signaling strong investor confidence in Amazon’s long-term growth story. The funds will support capital expenditures, acquisitions, data-center expansion, and upcoming debt maturities.
This move aligns with a broader trend among tech giants aggressively raising capital to scale AI systems. Meta issued $30 billion earlier, Alphabet raised $25 billion, and Oracle sold $18 billion in September. The surge in funding reflects the rising cost of advanced chips, cloud infrastructure, and high-capacity data centers needed to stay competitive in the AI race.
Amazon, the world’s largest cloud provider through AWS, is increasingly focused on high-performance computing and generative AI models. The new capital gives Amazon more room to expand capacity, boost margins through automation, and strengthen its competitive edge in enterprise AI services.
Amazon’s stock (AMZN) is pulling back from the $258 resistance, forming a corrective move toward a key support area around $232. This level aligns with the structure seen on the weekly chart and acts as a short-term demand zone. A strong bullish reaction here would likely set the stage for a retest of the $258 high, followed by a potential breakout if momentum returns.
If $232 fails to hold, the next major support sits at the ascending trendline zone, which has guided Amazon’s uptrend since early 2023. A deeper correction remains possible, but the broader structure is still bullish as long as price holds above the trendline.
The RSI is cooling off, suggesting the correction is healthy rather than a trend reversal. If Amazon bounces from support, the next major upside target sits between $280 and $300, aligning with long-term Fibonacci extensions.

AMZN : Bulls Taking a Pause Before the Next Leg Up!Amazon’s recent surge has hit a temporary Pause, forming a healthy pullback phase. If structure remains intact, another bullish wave could follow soon. Key levels to watch: 238–240 for a potential continuation setup.
Disclosure: We are part of Trade Nation's Influencer program and receive a monthly fee for using their TradingView charts in our analysis.

Amazon.com, Inc. ($AMZN) Expands Low-Cost Bazaar ServiceAmazon.com, Inc. (Nasdaq: NASDAQ:AMZN ) is making a bold move into the global low-cost e-commerce space. The retail giant announced the expansion of its Amazon Bazaar service — known as “Haul” in the U.S. — to 14 new international markets, intensifying competition with Shein and PDD Holdings’ Temu.
The service targets value-driven shoppers by offering ultra-cheap goods like $10 dresses, $5 accessories, and $2 home items, with a focus on emerging markets such as Nigeria, the Philippines, Hong Kong, Saudi Arabia, and Taiwan. The expansion builds on Bazaar’s earlier success in Mexico and the UAE, signaling Amazon’s strategy to tap into the fast-growing global demand for low-cost online retail amid weaker consumer sentiment.
This move comes as U.S. import tariffs under the Trump administration pressure household budgets, particularly for low-income groups. By diversifying into affordable goods, Amazon aims to defend its e-commerce dominance against Chinese platforms that have captured younger, price-sensitive consumers through viral marketing and social commerce. Analysts note that this pivot could enhance Amazon’s total addressable market and bolster revenue from international operations in 2026.
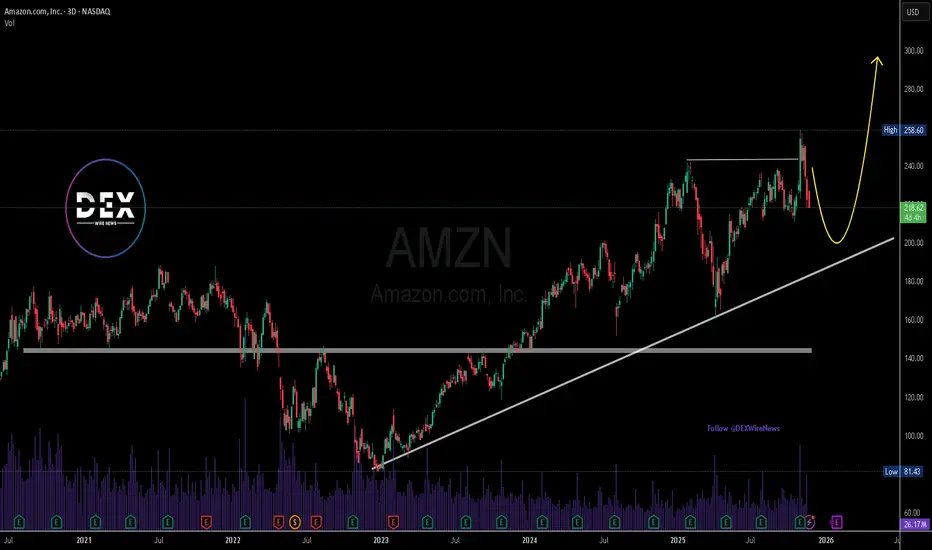
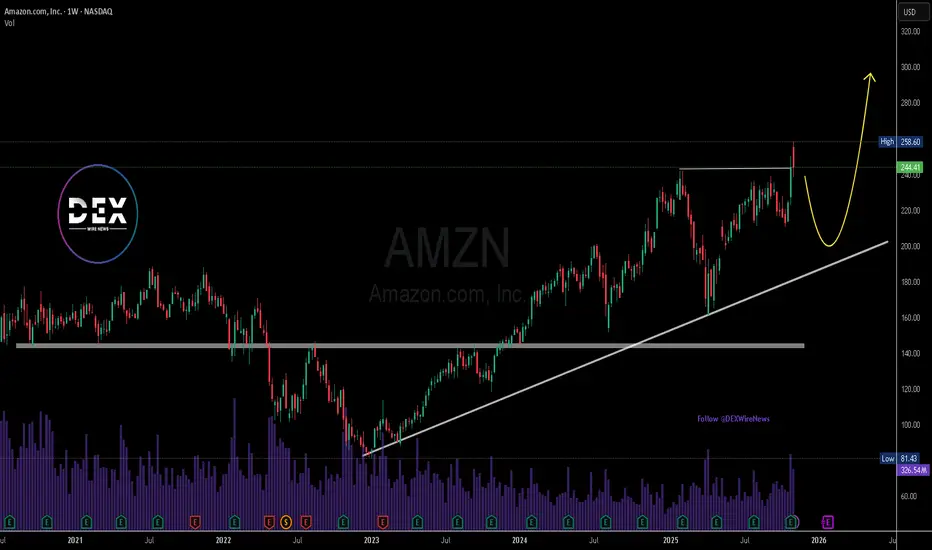
Technically, Amazon’s stock remains in a strong uptrend, trading near $244.41, slightly below its recent high of $258.60 market this week. The weekly chart shows consistent higher lows supported by a long-term ascending trendline from early 2023. The $220–$225 zone now serves as key support, with potential for a short-term pullback before resuming the rally toward the $300 level.
Momentum remains positive, with volume strength confirming investor interest following strong Q3 earnings. A sustained move above $260 could trigger a fresh bullish leg, extending Amazon’s dominant run as both a tech and retail powerhouse.
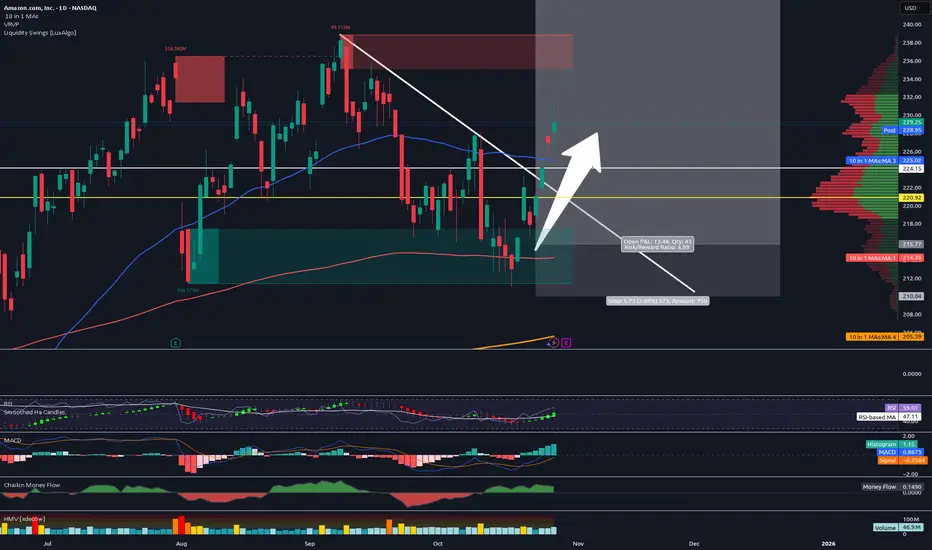
Sold Half Amazon - Raised Stops - Halfway to Final Target!Trading Fam,
We are halfway to my final target. I've been trading safe lately. So, I decided to sell half here, capture some profit, and raise my stops to $225, ensuring we're all in the money on this trade.
Congrats to those who followed me. We are 14 wins for the last 14 trades with an avg. of 33% profit per trade. Since implementing my new indicator just over a year ago, I continue to improve trade accuracy with each trade. Experience is growing and so are our wallets. Our portfolio is up 69% since we started with the indicator! Those are incredible stats for any trader, nevermind someone like me who just learned how to trade liquidity!
You guys know where to find me and all of my trades. 100% free to all of my followers.
✌️Stew
20+ Stocks for November: Your Ultimate Investing Radar📅 October is wrapped up, and a new month always means a new chapter on the charts.
Monthly closes reveal which breakouts are real, not temporary spikes, but clear signs that investors are willing to pay higher prices than before.
📊 I’m looking for those moments where the market proves it has changed its mind — when former resistance finally turns into support, and timing starts creating an edge.
That’s one of the biggest strengths of technical analysis: we don’t hope it moves, we see the action on the chart.
-----------------------------------
🔍 Over the past days, I’ve done another full round of research:
I scanned through both the Nasdaq 100 and S&P 500 , and also handpicked a few strong setups from Europe.
In total, you’ll find 20+ stocks today — each with its own description and plan.
I know that sounds like a lot, but there are quite a few of you here already 🙏, and every investor has a different strategy.
So don’t feel you have to study everything… just scan the names: if something catches your eye, stop and dig in.
If not, scroll on. You don’t need to cover them all.
📣 The purpose of my work is simple:
"to give you good, technically correct ideas — ones that avoid the classic mistakes that come from buying at the wrong time."
…and when you combine that with your own fundamental homework, your success rate might turn out surprisingly green.
-----------------------------------
🧭 November radar
In today’s post, you’ll find both breakout setups and corrections that have reached strong support zones.
I’ll also go through the major indices, explaining:
“why it might be smarter to take half positions instead of going all in.”
☕ So grab your coffee… and let’s kick off with 10 breakout ideas!
👇
Amazon (AMZN)
No need for a long introduction here. When a member of the Magnificent Seven delivers a clean breakout, it’s a signal you don’t want to ignore.
📈 For those who regularly add to their Mag7 holdings or rotate between them monthly, Amazon would be my pick this time.
While META’s recent correction isn’t a bad zone either, technically speaking, AMZN shows the stronger setup right now.
-----------------------
Dell Technologies (DELL)
Dell Technologies is one of the largest IT companies in the U.S., providing computers, servers, and cloud infrastructure solutions.
Over recent quarters, Dell has gained solid momentum — especially from AI server demand, which helped lift margins thanks to its higher-value infrastructure products.
Revenue also came in above expectations in the latest report, boosting investor confidence and pushing the stock to new highs.
📈 From a technical perspective, the breakout is clear:
The $150 resistance, which had held for almost a year and a half, finally gave way in October.
The structure is now open to the upside, and the chart shows clear strength.
The decision is simple: enter now, wait for a deeper retest, or just keep it on your radar — your call.
-----------------------
Nokia (OMXHEX: NOKIA)
A few weeks ago, I mentioned that Nokia was setting up for a potential breakout, and look at that, it actually did.
The company announced a collaboration with NVIDIA, which triggered the long-awaited move higher, breaking through its previous resistance zone.
The €5.5 level mentioned earlier is now history, and the monthly close above it confirms the breakout’s validity.
Whether you enter immediately, wait for a retest, or skip it because it doesn’t fit your style — again, your call. Technically valid!
-----------------------
Steel Dynamics (STLD)
Steel Dynamics ranks among the largest steel producers in the U.S., known for using recycled steel and low-emission production methods.
With a P/E of 20 (forward ~12), the company benefits from U.S. infrastructure investments and the broader manufacturing uptrend.
Recent quarterly results have been steady, the balance sheet is strong, and cash flow remains solid, supporting potential future growth.
📈 Technical setup:
This chart checks every box of a classic breakout play:
..........
🧭 Full radar and extended notes are available on my main page — you’ll find it easily.
All the best,
Vaido

AMAZON flashing a massive 5-year Sell Signal.More than 5 months ago (May 28, see chart below), we gave a strong buy signal on Amazon Inc. (AMZN), which last Friday hit our $255 Target:
This time we come across a massive Sell Signal on the 1W time-frame as the price hit (and is so far being rejected on) the 5-year Higher Highs trend-line that started back on the August 31 2020 Top.
We can see that during that period of time, Amazon had started a Triple Top formation that eventually led to the final rejection and the start of the 2022 Bear Cycle. Until we can talk about such a correction, we can expect at least a pull-back to its 1W MA50 (blue trend-line) as all of those 2020/21 rejections did. As a result, our medium-term Target on Amazon is $220.
Notice also the similarities between the 1W RSI sequences between the two fractals (2020/21 and 2024/25), both forming Lower Highs patterns.
-------------------------------------------------------------------------------
** Please LIKE 👍, FOLLOW ✅, SHARE 🙌 and COMMENT ✍ if you enjoy this idea! Also share your ideas and charts in the comments section below! This is best way to keep it relevant, support us, keep the content here free and allow the idea to reach as many people as possible. **
-------------------------------------------------------------------------------
💸💸💸💸💸💸
👇 👇 👇 👇 👇 👇

Amazon: Break Through ResistanceAmazon shares recently surged decisively above the resistance level at $242.52. This strong rally has pushed the beige wave V significantly higher. For now, we see further upside potential for this move, until the broader wave (V) in blue is complete.

AMAZONAMAZON has done exactly what we expected, now we will wait for correction to finish in this week for further upside.
Disclosure: We are part of Trade Nation's Influencer program and receive a monthly fee for using their TradingView charts in our analysis.

Amazon (AMZN) Shares Reach $250 for the First TimeAmazon (AMZN) Shares Reach $250 for the First Time
As the chart shows, Amazon (AMZN) shares rose to a record high on Friday, reaching the $250 mark for the first time. This came after the publication of a strong earnings report:
→ Revenue: $180.2 billion (up 13% year on year).
→ Earnings per share (EPS): actual = $1.95, forecast = $1.56 (a 25% beat).
Investor sentiment was further boosted by the following:
→ AWS (Amazon Web Services) revenue grew by 20% year on year, despite competition from Microsoft Azure and Google Cloud.
→ Amazon issued a confident outlook for the crucial holiday (fourth) quarter.
Technical Analysis of Amazon (AMZN) Chart
When analysing the chart on 24 September, we:
→ used AMZN share price fluctuations to construct an upward channel (shown in blue);
→ noted early signs of weakness.
Subsequently, the price reached a low at point A – where the bulls found support from the lower boundary of the channel and the August low (in fact, there was a false bearish breakout) – and made a successful attempt to resume the uptrend.
The two red candles on Friday suggest that the initial reaction to the report may have been overly optimistic (as confirmed by the RSI indicator). Therefore, it is possible that a corrective move will follow – for example, towards the support area that includes:
→ the median line of the current channel;
→ the previous all-time high of $242;
→ the September high around $238;
→ the 0.382 Fibonacci retracement level of the A→B impulse, around $235.
This article represents the opinion of the Companies operating under the FXOpen brand only. It is not to be construed as an offer, solicitation, or recommendation with respect to products and services provided by the Companies operating under the FXOpen brand, nor is it to be considered financial advice.
Amazon (AMZN): Ready for a New Breakout!Amazon isn’t just delivering packages — it’s delivering earnings surprises and a chart breakout too! 😎
After reporting strong Q3 earnings on 30 Oct 2025 , AMZN’s chart popped with a clean cup & handle breakout on 31 Oct 2025 — just in time for a bullish Halloween rally 🎃🐂
💰 Earnings Highlights :
Revenue : Came in above expectations, boosted by AWS and advertising growth.
EPS : Beat market estimates, showing stronger profitability.
Operating cash flow : Improved significantly — partly thanks to deferred tax effects — giving Amazon more room for CapEx and expansion.
☁️ AWS Power :
AWS continues to lead the way with steady growth and improved margins. Analysts expect momentum to carry into Q4 2025 , supported by rising demand for cloud and AI-driven services.
📊 Technical View :
The chart shows a classic cup & handle breakout — volume confirmation looks solid, suggesting potential continuation into year-end.
🔥 My Take:
When strong fundamentals meet a clean technical setup, that’s where the magic happens. Amazon might just be brewing a latte-fueled rally into Q4 ☕🚀

AMZN Bullish Breakout: Retest Above 238 Toward 255–265AMZN just cleared a four-month rectangle (214–238) with a decisive late-October surge, shifting the daily trend back to bullish. Price now rides above the 20/60/120-day MAs with expanded volatility—classic post-breakout behavior. The former lid at 238 flips to support, while the next clear shelf sits near the psychological 255.
Primary path: look for a constructive pullback into 238–242 to validate the breakout. A daily close above 242, a 1H close >248, or a continuation break through 250.50 can serve as triggers. If buyers defend 238 on the retest, the path of least resistance favors a push into 252–254, then the measured round-number objective at 255, with extension toward 265 if momentum persists and volume stays supportive.
If 238 fails on a decisive close, treat it as a false break and expect rotation back into the prior range, with 230 as the magnet. Invalidation for the bullish idea sits on a firm daily close back below 238; conservative risk placement can sit around 235–236 to protect against a failed retest.
This is a study, not financial advice. Manage risk and invalidations

AMZN Break Out -- Bullish1HR time frame paints a good picture of what's to come in the short term...at least from my perspective.
AMZN finally broke through the sideways chop today with momentum and pushed to the 1.618 fib (from the closed peak of the last wave on 10/3 to the closed low on 10/6).
RSI showing momentum and in an upward trend despite the recent choppiness since 9/25.
RSI peaked at about 77, and looking to cooldown after the breakout. I suspect we'll see price revisit mid $223 before continuing upwards. Will most likely see stair stepping up to the $230's.

AMAZONAMAZON has started the push up after the complete correction, let's see if it holds this upside momentum and breaks the top one more time.
Disclosure: We are part of Trade Nation's Influencer program and receive a monthly fee for using their TradingView charts in our analysis.

October’s top stock performers: #AMD, #Amazon, #Tesla & moreIn October, FreshForex clients most frequently traded stocks like #AMD, #Amazon, #GoDaddy, #Tesla, and #Moderna — and these very assets showed the highest share of profitable trades. Capitalize on strong demand momentum and high liquidity: with earnings season and the holiday rush ahead, the “window of opportunity” is still open.
Outlook through the end of 2025:
#AMD: Shares could rise following the $6B AI compute deal with OpenAI and Oracle’s reported order of 50,000 next-gen MI450 chips.
#Amazon: Strong earnings on October 30, solid AWS growth, advertising contributions, and the fall Prime Big Deal Days may keep the stock bullish.
#GoDaddy: Stock may face pressure if SMB ARPU/inflows slow, plus FX headwinds could dampen August’s raised full-year guidance.
#Tesla: Growth potential supported by record 497K deliveries, 12.5 GWh energy deployments in Q3, and expansion of FSD v14 (Supervised).
#Moderna: Stock remains under pressure amid limited revenue visibility, delayed UK shipments, and postponed approval of its flu+COVID combo vaccine to 2026.
According to FreshForex analysts, the outlook for these stocks remains driven by AI investments and seasonal demand. But the strongest growth impulse is likely in Q1 2026, especially if the Fed eases policy and announced tech projects go live.

AMAZON (AMZN) - H4 - Double Top Breakdown (19.10.2025)📊 Setup Overview:
Amazon stock (NASDAQ: AMZN) is forming a Double Top Reversal Pattern on the 4H chart, signaling potential weakness after failing twice to break above the major resistance zone near $238–$240.The price has also broken below the ascending trendline with a cloud crossover, confirming bearish momentum building up. NASDAQ:AMZN
📈 Trade Plan:
Bias: Bearish below $220
1st Target: $197.91 ✅
2nd Target: $183.99 🎯
Resistance Zone: $238 – $240
🧩 Technical Confluence:
1.Double Top formation near major resistance zone
2.Trendline break confirming reversal
3.Ichimoku Cloud crossover indicating bearish momentum
4.Volume profile shows selling pressure increasing below $215
📉 Fundamental Amazon (AMZN):
Amazon remains one of the most dominant global tech giants, but several near-term factors could impact its price action:
⚡Upcoming Earnings (Late October 2025):
1.Analysts project Q3 FY2025 revenue around $158–160 billion, with EPS expectations near $1.24–$1.30.
2.Focus will be on AWS (Amazon Web Services) performance — which still contributes over 50% of total operating income, but has shown slower growth due to corporate cost-cutting and cloud competition.
⚡Retail & E-commerce Trends:
1.Amazon’s North America segment remains strong but margin pressure continues due to logistics and rising fulfillment costs.
2.The company’s push into AI-driven retail advertising could offset some of that weakness if ad revenue exceeds expectations.
⚡Broader Market Context:
1.With U.S. yields staying elevated, large-cap tech stocks like Amazon may face valuation compression.
2.Institutional rotation toward value and defensive stocks could further weigh on AMZN in the short term.
🎯Overall, fundamentals remain strong for the long-term, but the technical structure suggests a near-term correction before accumulation resumes.
#AMZN #AmazonStock #NASDAQ #USStocks #TechnicalAnalysis #DoubleTopPattern #BearishSetup #PriceAction #EarningsWatch #StockMarket #SwingTrading #TradingView #Ichimoku #CloudCrossover #ChartsDontLie #Kabhi_TA_Trading
⚠️ Disclaimer:
This analysis is for educational purposes only and not investment advice. Always perform your own due diligence and manage risk appropriately before taking any position.
💬 Support the Analysis:
If this chart helped you — LIKE 👍, COMMENT 💬 your thoughts, and FOLLOW ✅ for more daily stock & forex chart breakdowns from Kabhi_TA_Trading!

AMAZONAMAZON has done what we expected last week, this week we are expecting an up move to start.
Disclosure: We are part of Trade Nation's Influencer program and receive a monthly fee for using their TradingView charts in our analysis.

$AMZN Tradespoon – Long Entry $227.74Tradespoon model generated long signal for NASDAQ:AMZN . Predicted range: $220.98–$229.14. Trend: +0.25%. NASDAQ:AMZN

$AMZN massive cup and handle formingIf we look at the chart of AMZN, we can see that $236 has become an important resistance level.
So far, it's been tested multiple times which means that resistance has weakened. I do think that next time we get up to that level, it'll likely break and we can see higher prices.
On top of the resistance being weakened, there's a massive cup and handle forming on the chart. If we end up breaking resistance, the measured target would be the $313 resistance.
I've marked off other important levels on the chart should price break that key resistance level.
Let's see how it plays out over the coming month. Will likely start accumulating calls on any dips.

AMAZONAMZN is almost ready to push up further to take ATH.
Disclosure: We are part of Trade Nation's Influencer program and receive a monthly fee for using their TradingView charts in our analysis.

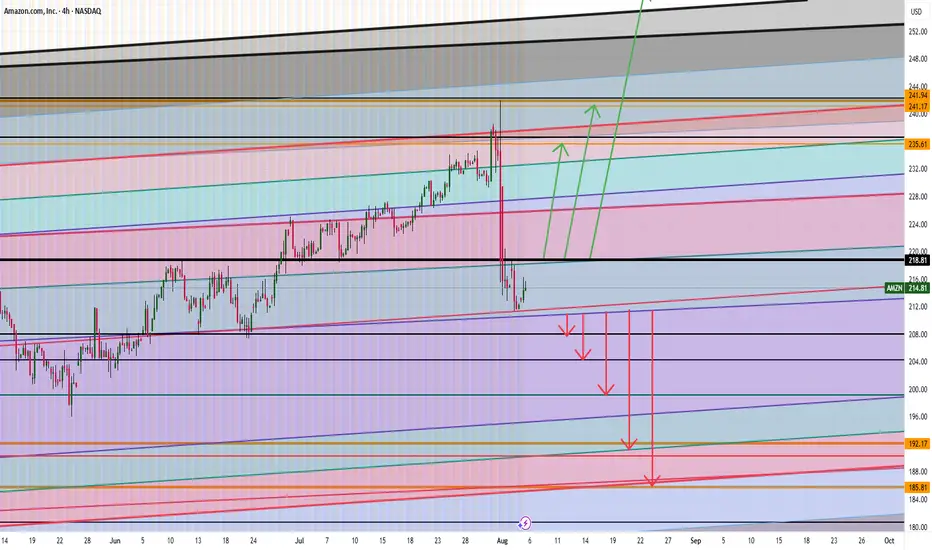
AMAZON ARE WE HEADING TO $258 ? HERE IS THE FULL ANALYSIS Hi Trading fam
So we have Amazon and based on what we are seeing we see two scenarios playing out:
Bullish:
If we can break and hold above 219 then we can see levels of : 235,241,and 258 being hit
Bearish:
If break the low of 210 then we hit 207,204, 199, 190 and then 185
Trade Smarter Live Better
Kris