$AMD - 2 Bearish ScenarioWe broke "down trend" couple weeks ago (it was fake as we can see) and IMO we might go lower same percentage or double, i hope chart makes more sense than my stupid explanation lol
AMD

AMD CALLS Samething as snap here but on AMD we have already broken resistance so we are in the green zone to go up to 94.11 we will wait for monday for some confirmation

GBPUSD PA BREAKDOWN AND IDEAHere we discuss everything that transpired today on 6/21/2022 and then go into market analysis going forward...
This week i'm bullish on GBPUSD and overall daily and weekly bias remains bearish

AMD Short term bullish, medium-long term potentially bearishGreat bounce from 92$ supply zone. Potential to test the red resistance line around 100$. Also gap down around 100$ will act like a magnet for price action to fill the gap. Based on the reaction on the red resistance line, we can either confirm the head and shoulders pattern over medium and long term which will be bearish if true.
Disclaimer : Educational idea. Not a financial advice. I have swing positions in AMD on same trade idea at 93$ level.

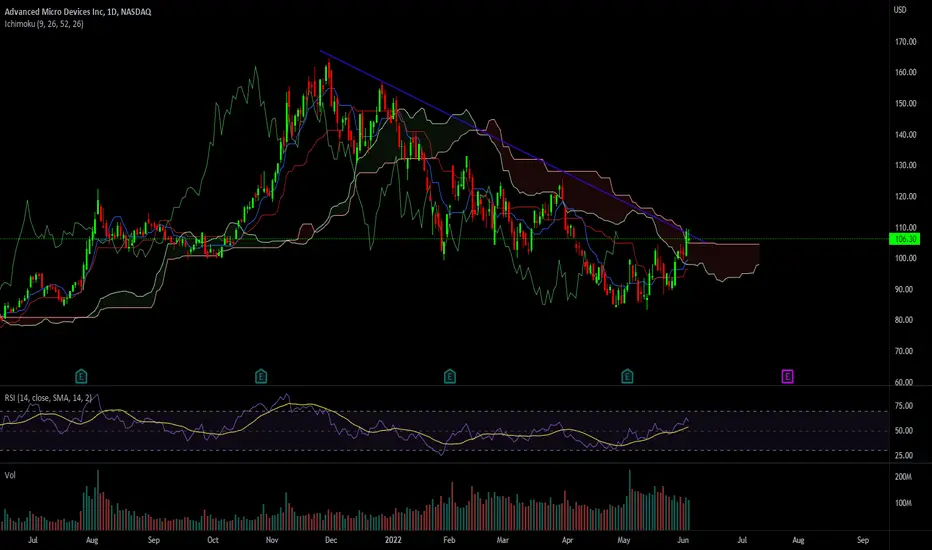
AMD: Positive DivergenceMACD making higher lowers with price making lower lows.
#WorthWatching
#BottomNotConfirmed

AMD 24% potential downtrendAMD is at a tipping point with daily volume exhaustion
If there is a break below the last two trading days, shown by the trend line, it may go back down 24% in price
This downtrend may take place within the next three weeks, starting the coming week
Then end of this downtrend may also mark the end of Q2 trading market at the end of June
Good luck and don't forget to protect your capital at all cost.
Best,


AMD: 4 hourNot time to do a detailed write up. But I'll post my 4 hour green count for AMD to show the smaller degree wave count on the 4 hour chart, which is a follow up to my daily chart below.
Lots of confluence around $70. It looks like we need one more low on what appears to be the ending diagonal of green wave v of wave (c) of wave 4. Sure, it could truncate and take off higher. But no confirmed bottom given the lack of a clearly impulsive move higher.
#NotAdvice
#I'mLongAMD
#LooksLikeOneMoreLow
#WavePrinciple

AMD: The Big Picture (Daily)Lots of support between $67 and $70.
Nice looking divergence on the daily MACD.
Weekly MACD is trying to turn up.
Monthly MACD is still pointing down.
#LongAMD
#BottomNotConfirmed
#NotAdvice
#WavePrinciple

AMD analysis LONG/SHORTAMD analysis.
Stock is currently in a big downtrend.
On a daily and 4 hourly chart is a little bit extended to the downside, which i expect a pullback soon, especially before a long term support.
Pullback could create a nice long opportunities.
The stock with be correlated with the markets direction, so time it right.
Do not enter the stock with full size but enter it in chunks
Example :
1 resistance break : enter 50% of your original position, and add small positions as you grind your way up,
and of course pay yourself first. always cover your risk first.
By managing the trade and the risk, your increase your profit chances and decrease losing or blowing up.
and of course this is only my analysis and it is just for information purposes only.
Feel free to ask any questions.

AMD - Quick analyses Short TermI hope everyone had a great weekend.
AMD. Here is a quick review of a few possibilities and ideas.
I have been tracking this very large ascending channel (black line)
Last Friday, price broke down below the trendline, we can consider a quick retest on smaller time frames (not a strong retest) and price kept on moving lower.
One of my rules to trade breakouts / breakdowns is to wait a full candle close outside a trendline and use that candle's top/bottom as an entry. AMD has not yet done that. (94.30 which would be my entry)
For this week, I will favor the downside as long as price is below this channel.
If you look left, there is some immediate support at around 93.85 (5/12) so this would be the first target. Below that 91.70 and 89.45
If price breaks below 88.40 there is a big chance we test the lows at 82 / 80.

AMD SET UP We are at the very bottom of this pull back on the daily chart... ONCE we break out I will be looking for puts below this rising channel.

$AMD $TSLA $MSTR $SPY I OptionsSwing WatchlistAMD 4H I AMD was rejected right near its downtrend on the daily. And we now have a bear flag formation on AMD. Support near $92 and $82 if the flag is broken.
TSLA 4H I TSLA has been trending down on the hourly ever since the beginning of April. We have resistance near $710 and $725. Support near $625 if $685 doesn't hold.
MSTR 2H I MSTR is breaking down from a current uptrend. We have resistance near $220 and support near $203 and $188. BTC is looking bearish over the weekend.
SPY 1D I SPY macrotrend remains bearish as we have been unable to see a higher low so far. Expecting support near $380, if it doesn't hold we can see $355!


AMD - Ominous looking 3D chart
Zoomed out view is starting to show rejection of mid BB, which means price is starting to move away from the median for this timeframe.
Combine that with the ample supply and you have recipe for a disaster.
positives are that price is holding 60 VMA for now. That could change though, as it is barely supporting currently.
Not being a doomsayer, but one must be cautious at these levels. wait for tightening range before going too deep.
Takeaway: I am long with a short leash.

AMD: You should pay attention to these KEY POINTS!Hello traders and investors! My last analysis on AMD was on April 27, but my previous reading was very accurate, as it respected our key points very well (link to my previous analysis below this post, as usual). Now, we must update a few things.
First, in the 1h chart, AMD reversed the trend, as we expected, and even when the volatility increased, it couldn’t lose the blue line at $ 84.24, which was our most important support level (the daily chart will show it better).
Now it seems AMD is doing a pullback to the previous support level around $ 104, which worked as a resistance two times recently, and now it is working as a support. This is the Principle of Polarity in Technical Analysis. Only if it loses this support we would see AMD dropping more. The next support is the black line at $ 99, which is an interesting point that we’ll talk about later.
For now, all we can assume is that since it is a bull trend, AMD will seek higher levels, even considering it’ll do pullbacks along the way. Remember: Trends persist until a clear reversal occurs (Dow Theory).
Remember the $ 84.24, the most important support? Here we see that AMD did a Double Bottom chart pattern just above this price level. In addition to this, if you zoom out, you’ll realize that this support dates back to July 2021. In order to trigger a long-term bear market on AMD, we must lose this line, and this won’t be easy.
For now, AMD is clearly bullish, doing higher highs/lows, heading to the target I mentioned in ym last analysis, when we were below $ 90: The Gap at $ 118. Meanwhile, pullbacks are acceptable, and would be just opportunities to buy. The 21 ema is a good support level to work with in the daily chart, and coincidence or not, it is at $ 99 right now (remember the black line I mentioned in the 1h chart?).
Let’s keep our eyes open, as AMD is near its key points right now. Maybe it’ll give another buy soon, if it reacts near any of its support levels. What could ruin the bullish bias? If it does a clear reversal sign, and if it loses its 21 ema in the daily chart.
I’ll keep you guys updated, so, remember to follow me to keep in touch with my daily analyses!

AMD shortEthereum going PoS => gpus for mining not needed. Gpus will flood aftermarket from the miners and retail consumers can buy gpus cheap, thus reducing sales. Roughly 20B$ worth of gpus will be unusable which is more than AMDs yearly earnings. Granted AMD does not have 100% market share(NVIDIA). But this should greatly affect their gpus sales late 2022 and early 2023. Also the FED is raising rates and starting to tighten up, which could affect growth stocks and tech negatively if the market becomes risk off. I think this thesis can be applied to NVIDIA as well although AMD gpus are a bit more popular among the miners.

$AMD's Bearish SetupWe recently saw a huge big green candle and then gapped down on Friday. Both of which retested the top of the wedge and failed to get over. That itself lends to bearish sentiment and is a bearish move in the making. While the green candles look bullish, the price action has yet to get back over the top of the wedge and until it does, the price emphasizes a bearish trend, so the bulls will want to get that back above the wedge.
Current position: I am still short on $AMD ($100 Put) and will monitor it to test the bottom of the wedge.

$DBX $LIT $AMD $SLB I OptionsSwing WatchlistDBX 1D I DBX is breaking out from a possible bull flag on the daily after rumors that it was approached a month ago in attempts to be acquired by another company.
LIT 1D I Energy stocks and lithium stocks in general have been overperforming the market for the past two weeks. Watching for a breakout from this downtrend.
AMD 1D I AMD is forming a possible bear flag on the daily time frame. We have resistance near $110 and support close to $106. AMD is breaking out from a downtrend.
SLB 1D I SLB has been holding $46. Energy stocks keep on outperforming the market, and I've seen bullish trades on some energy stocks like SLB MRO among others.

AMD A case of the higher lows in effect here.
As long as the $99 region holds, we can see $110-$120 next
The next buy zone is the $100-102 region.
If $99 fails., we go back to retest the $91-$93 region.

DeGRAM | AMD stonks analysisAMD is approaching the resistance zone $114 - $115.
This zone acted as both support and resistance before.
Price action tends to move sideways around a significant level. Looking left.
-------------------
Share your opinion in the comments and support the idea with like. Thanks for your support!

All eyes on $AMZN for split?$AMZN drops significantly after missing the ER a few weeks ago and it gets worse with the market pulling back, taking the amazon down below the 100MA. based on technical indicators; Amazon is in the oversold position and its almost safe to say its a buying opportunity for everyone. especially with the upcoming split in few days. the split will probably draw some attention to investors causing the stock to squeeze to push up. The squeeze to push even higher for the high of the day could be significant as the market attempts to bounce back after 5 days in a row being green, which might have created a bullish sentiment. now, in my bearish opinion based on technical indicators. AMZN is still looking bearish. the stock currently trending below the 100MA, indicating that the stock is still below the bullish side and might take a while to bounce above the bullish momentum. With that being said. here's my possible entry for momentum play or scalp play.
For scalp or day trade moves.
For calls; buy above 2320.46 and sell at 2380.46 or above
For puts, buy below 2291.82 and sell at 2274.46 or below
============================================================
if you swing calls, your next target is 2444.41
if you swing puts your next sell target is.. 2243.0
Welcome to this free technical analysis . ( mostly momentum play )
I am going to explain where I think this stock might possibly go the next day or week play and where I would look for trading opportunities
for day trades or scalp play.
If you have any questions or suggestions on which stocks I should analyze, please leave a comment below.
If you enjoyed this analysis, I would appreciate it if you smash that LIKE button and maybe consider following my channel.
Thank you for stopping by and stay tuned for more.
