#NOT #NOTUSDT #NOTCOIN #AMD #Analysis #Spot #Futures #Long #Eddy#NOT #NOTUSDT #NOTCOIN #AMD #Analysis #Spot #Futures #Long #Eddy
NOTUSDT.P Lower Time Frame "AMD" Analysis
Great opportunity to invest spot at a specified price.
To get confirmation, you need to be patient until the AMD structure is complete on the lower timeframe, first wait for the manipulation and then get confirmation of entry for buy trades, and follow the price during the distribution phase.
Important areas of the lower & higher time frame are identified and labled.
This Analysis is based on a combination of different styles, including the volume style with the ict style. (( AMD Analysis ))
Based on your strategy and style, get the necessary confirmations for this analysis to buy entery the trade.
Don't forget risk and capital management.
The entry point, take profit point are indicated on the chart along with their amount.
The responsibility for the transaction is yours and I have no responsibility for not observing your risk and capital management.
Note: The price can go much higher than the first target, and there is a possibility of a 300% & 1000% pump on this currency. By observing risk and capital management, obtaining the necessary approvals, and saving profits in the target, you can keep it for the pump.
Be successful and profitable.
(( This is a lower time frame AMD structure inside another higher time frame AMD structure. ))
Please Check NOTUSDT Higher Time Frame "AMD" Analysis from this link :
AMD

#NOT #NOTUSDT #NOTCOIN #AMD #Analysis #Spot #Long #Eddy#NOT #NOTUSDT #NOTCOIN #AMD #Analysis #Spot #Long #Eddy
NOTUSDT Higher Time Frame "AMD" Analysis
Great opportunity to invest spot at a specified price.
Important areas of the higher time frame are identified and labled.
This Analysis is based on a combination of different styles, including the volume style with the ict style. (( AMD Analysis ))
Based on your strategy and style, get the necessary confirmations for this analysis to buy entery the trade.
Don't forget risk and capital management.
The entry point, take profit point are indicated on the chart along with their amount.
The responsibility for the transaction is yours and I have no responsibility for not observing your risk and capital management.
Note: The price can go much higher than the first target, and there is a possibility of a 300% & 1000% pump on this currency. By observing risk and capital management, obtaining the necessary approvals, and saving profits in the target, you can keep it for the pump.
Be successful and profitable.

#X #XUSDT #XEMPIRE #LONG #Scalp #Scalping #Eddy#X #XUSDT #XEMPIRE #LONG #Scalp #Scalping #Eddy
XUSDT.P Scalping Long Setup
Important areas of the upper time frame for scalping are identified and named.
This setup is based on a combination of different styles, including the volume style with the ict style. (( AMD SETUP ))
Based on your strategy and style, get the necessary confirmations for this scalping setup to enter the trade.
Don't forget risk and capital management.
The entry point, take profit point, and stop loss point are indicated on the chart along with their amounts.
The responsibility for the transaction is yours and I have no responsibility for not observing your risk and capital management.
Note: The price can go much higher than the second target, and there is a possibility of a 70% pump on this currency. By observing risk and capital management, obtaining the necessary approvals, and saving profits in the targets, you can keep it for the pump.
Be successful and profitable.

AMD Advanced Micro Devices Price TargetAdvanced Micro Devices (AMD) has positioned itself as a major player in the semiconductor industry, capitalizing on growing demand for high-performance computing, artificial intelligence (AI), and data center solutions. As of now, AMD’s forward price-to-earnings (P/E) ratio stands at 17.12, indicating that the stock is trading at a reasonable valuation compared to its growth potential.
AMD has benefited from the increasing adoption of AI-driven solutions, particularly through its MI300 series of AI accelerators, which have gained traction among major cloud service providers. The company’s expansion into the data center market has also been a key growth driver, with strong sales in EPYC processors contributing to revenue growth.
Furthermore, AMD's strategic acquisition of Xilinx has strengthened its position in the FPGA (Field-Programmable Gate Array) market, enhancing its ability to offer diversified and high-margin products. This, combined with improving margins and consistent product innovation, positions AMD for steady financial performance in the coming quarters.
Given AMD’s solid fundamentals, growing market share in AI and data centers, and attractive valuation at a 17.12 forward P/E, a price target of $125 by the end of the year appears achievable. This would represent approximately 15% upside from current levels, driven by continued revenue growth and expanding profit margins.

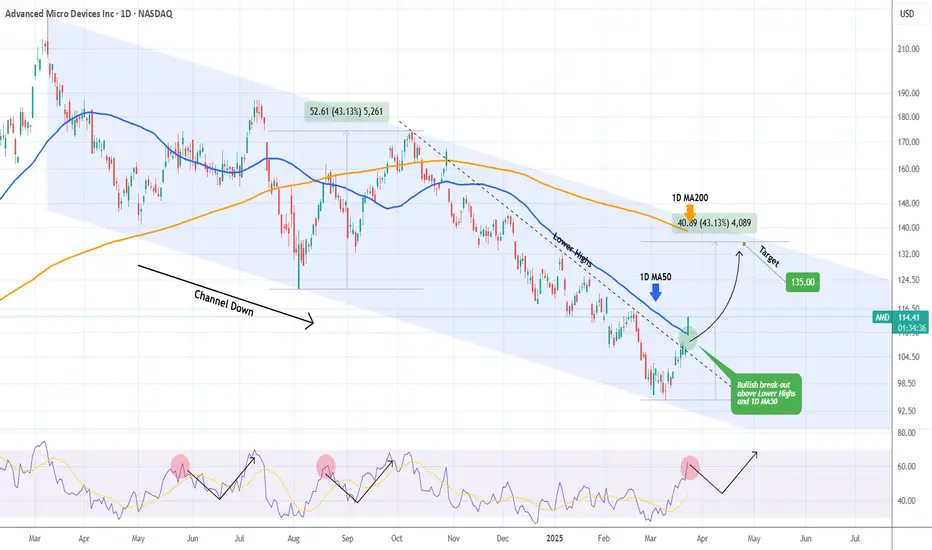
AMD broke above its 1D MA50. Is the trend finally changing?Advanced Micro Devices (AMD) broke today above its 1D MA50 (blue trend-line) for the first time in almost 5 months (since October 29 2024)! From that day after it has also been below a Lower Highs trend-line, basically the Bearish Leg of the 1-year Channel Down, which it marginally broke last week but today it smashed it.
A short-term pull-back based on the 1D RSI symmetry (with the August 20 2024 and May 28 2024 Highs) is possible but on the long-term we expect a full recovery on this Bullish Leg of at least +43.13% (like the August - September Leg).
As a result, we expect a 1D MA200 (orange trend-line) test at $135.00.
-------------------------------------------------------------------------------
** Please LIKE 👍, FOLLOW ✅, SHARE 🙌 and COMMENT ✍ if you enjoy this idea! Also share your ideas and charts in the comments section below! This is best way to keep it relevant, support us, keep the content here free and allow the idea to reach as many people as possible. **
-------------------------------------------------------------------------------
💸💸💸💸💸💸
👇 👇 👇 👇 👇 👇
AMD 1st breakout made. Now waiting for the 1day MA50.AMD is trading inside a Channel Down since November 1st 2024 and under a second layer of lower highs since December 4th 2024.
Along with the 1day RSI that just crossed above its own Resistance level, the price crossed above that second layer of lower highs.
This is the first sign of an upcoming bullish breakout but the last Resistance to confirm that is the 1day MA50.
If that breaks, go long and target 144.00.
Follow us, like the idea and leave a comment below!!

$META CRASH in PROGRESS !! $600 incomingWowzers... I'm not sure what to say but ... good money is going to be made here for sure... would love to see this play out to the Tee... Take care yall ... DAILY BAR PATTERN from the Box of June 24' - Aug 24' .... I must say... let's make it happen..

AMD - Advanced Money Destroyer...Not For Long!NASDAQ:AMD
Has been decimated but the DIP BUY BOX holds strong! $85-$100 could lead to an easy 2x!
- Key S/R Zone
- Massive Volume Shelf
- Bearish WCB Breakout will give Bullish Cue
- Lowest RSI since 2022 BOTTOM
A turnaround here could lead to outsized performance in portfolios.
Not financial advice

Amd - Please Look At The Structure!Amd ( NASDAQ:AMD ) is about to retest massive support:
Click chart above to see the detailed analysis👆🏻
For about 5 years Amd has been trading in a decent rising channel formation. That's exactly the reason for why we saw the harsh drop starting in the beginning of 2024. But as we are speaking, Amd is about to retest a massive confluence of support which could lead to a beautiful reversal.
Levels to watch: $100
Keep your long term vision,
Philip (BasicTrading)

AMD: Bottomed and can rally by as much as +140%.AMD is bearish on its 1D technical outlook (RSI = 40.266, MACD = -4.630, ADX = 52.178) but technically appears to be forming a new multi-month bottom after exactly 1 year of downside. The 1D RSI hit the S1 level, which priced the October 10th 2022 bottom. The outcome of that bottom was a +142.42% rally, same as the October 23rd 2023 Low, whose +142.42% rally formed the March 2024 ATH. This time this week's low has come very close to the S1 level, which is the strongest support level on the long term. A new potential +142.42% rally from the current levels would make a marginal ATH (TP = 230) and that's our current target for the end of the year.
## If you like our free content follow our profile to get more daily ideas. ##
## Comments and likes are greatly appreciated. ##

AMD IS A MUST BUY 12 MARCH 2025Amd at current price is a mist buy for investment. It is technically looking super strong. I have ready explained the price action on AMD ontrading view.

From Boom to Bust? Nvidia Warns of a Potential 50% DropAfter an incredible rally, Nvidia NASDAQ:NVDA has finally hit a wall at its all−time high of $140, failing to secure a strong monthly close above this critical resistance level. This stagnation at the peak is a red flag for the stock’s near-term momentum.
Since the rally began in 2016, the monthly chart has been overwhelmingly bullish, with only a few exceptions: 2018, 2022, and now 2024, where the monthly chart has printed a bearish engulfing candle. Historically, when this pattern has appeared, it has led to steep retraces. Based on the median pullback from the past two occurrences, we could see a 50% decline by mid 2025 from current levels, a potential bloodbath for unprepared investors.
Is this a guaranteed outcome? Of course not. But higher timeframes carry significant weight in macro price action, and this bearish signal is too significant to ignore. Stay alert—volatility ahead!
While a short-term pump toward the $140s is more than likely, it’s important to recognize that this move will feel more like a dead cat bounce than a sustainable recovery. For those considering a short position, this potential bounce could offer the perfect entry point.
However, unless NVDA can achieve a strong break above $150 and successfully flip this level into support, there’s no compelling reason to turn bullish here. The macro warning signs remain intact, and the risk of a deeper retrace increases.

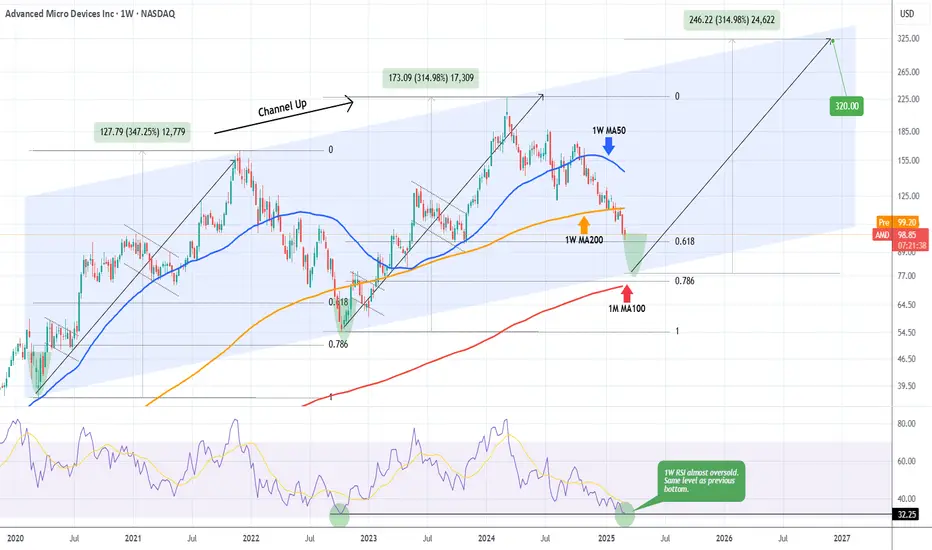
AMD Bottom pricing inside 3 weeks. MASSIVE BUY.Advanced Micro Devices (AMD) have been on a downtrend for exactly 1 year, every since the March 04 2024 Top. That was a technical Higher High on the 5-year Channel Up.
With the price trading below even its 1W MA200 (orange trend-line), there is a massive underlying buy opportunity on the stock for the long-term. That's because this 1-year downtrend is the technical Bearish Leg of this Channel Up, whose previous one bottomed 2 weeks after breaking below the 0.618 Fibonacci retracement level, contained at the same time above the 0.786 Fib.
As you can see, the price is just above the current 0.618 Fib and the 0.786 Fib is just below the Channel Up, where the ultimate macro Support of the 1M MA100 (red trend-line) is headed.
With the 1W RSI almost oversold and on the exact level where the previous Channel Up bottom (October 10 2022) was formed, the stock is technically entering its long-term buy opportunity zone.
Based on this pattern, the R/R is already on excellent levels for a buy and we expect the bottom to be formed within the next 3 weeks. If the new Bullish Leg imitates the previous one and rises by +315%, we can expect AMD to have its next Top at $320.
-------------------------------------------------------------------------------
** Please LIKE 👍, FOLLOW ✅, SHARE 🙌 and COMMENT ✍ if you enjoy this idea! Also share your ideas and charts in the comments section below! This is best way to keep it relevant, support us, keep the content here free and allow the idea to reach as many people as possible. **
-------------------------------------------------------------------------------
💸💸💸💸💸💸
👇 👇 👇 👇 👇 👇
AMD TSX LONGTERM TRADE SETUP.Would love to hear thoughts on this idea based on macd , volume profile and solely based on a confirmation of reversal.
Not financial advice but I think there's opportunity here.

Trading AUDUSD | Judas Swing Strategy 26/02/2025Last week the Judas Swing strategy had another action-packed week! As we took four trades across our selected currency pairs ( FX:GBPUSD , FX:AUDUSD , FX:EURUSD , OANDA:NZDUSD ), securing two wins and two losses, but still closing the week with a solid 2% gain.
Given the strategy’s consistency over the past few weeks and months, we were eager to see how it would perform this week. On Monday, we waited for a setup on FX:EURUSD , but it fell just a few pipettes short of meeting all the criteria on our checklist. Since one key requirement wasn’t met, we stayed disciplined and skipped the trade. Now, here’s the important part—although that trade ended up being a winner, it didn’t bother us. Why? Because it didn’t align with our strategy, and we don’t risk our hard-earned money on trades that don’t check all the boxes. If you find yourself entering random trades, it’s time to create a checklist and stick to it. Discipline is what separates consistent traders from gamblers.
Fast forward to Wednesday, we spotted a promising setup on FX:AUDUSD and we were eager to see how the session would unfold. After a sweep of liquidity at the lows, our focus immediately shifted to potential buying opportunities. Once we got a break of structure to the upside, all that was left was a retrace into the FVG before executing the trade. But patience was key—we reminded ourselves of Monday’s setup, where a similar scenario played out, yet the retrace never came. That trade had to be left behind, and we weren’t about to force an entry this time either
Finally, price retraced into the FVG, and as soon as that candle closed, we were ready to execute the trade. We risk 1% per trade with the goal of securing a 2% return ensuring our wins outweigh our losses over time. With this strategy’s win rate hovering around 50%, sticking to our rules keeps us on the path to long-term profitability
After entering the trade, we experienced a slight drawdown for less than five minutes, dipping just 2 pips nothing out of the ordinary. Our entry candle had closed in our intended direction, so we stayed patient. Soon after, price moved decisively in our favor, hitting our target in just 1 hour and 10 minutes. Our patience paid off this time with a solid 2% return on a trade where we had only risked 1%.

NVDA XABCD Best Level to BUY/HOLD 30% gains🔸Hello traders, today let's review recent price chart for NVDA.
Well defined swings in progress, expecting further downside before
the tide finally turns for NVDA bulls. Currently it's recommended to stay out.
🔸Speculative XABCD defined by points: X 150, A 115, B 140, C 120, D 160.
most points validated already, C/D pending.
🔸Well defined swings in progress, so expecting a low near 120 before
reversal and new swing higher.
🔸Recommended strategy bulls: Bulls wait for correction to complete at/near 129 usd in March 2025 and get ready to BUY/HOLD low, this is a swing trade setup, so will take longer to hit target, patience required. final TP is 160 USD, 30% upside from point C/buy entry. good luck traders!
🎁Please hit the like button and
🎁Leave a comment to support our team!
RISK DISCLAIMER:
Trading Futures , Forex, CFDs and Stocks involves a risk of loss.
Please consider carefully if such trading is appropriate for you.
Past performance is not indicative of future results.
Always limit your leverage and use tight stop loss.

AMD Analysis: Shorting to $100 as Cup & Handle Pattern FormsHello Traders,
I'm sharing a weekly chart analysis for AMD, where I’ve identified a Cup & Handle pattern. The current price is $148, and it's retesting the broken red trend line.
I suggest considering a short position targeting $100. I've also included a back test for the two previous patterns, which support the validity of the middle red trend line.
It's important to note that if AMD reaches the $100 level, the Cup & Handle pattern above the blue trend line will become valid, potentially targeting even lower levels around $55, or possibly further down.
Additionally, pay attention to the downtrend progression channel in cyan. The current price of $148 is positioned around the resistance of this channel's middle line.
If these scenarios play out, a harmonic pattern may also form, which I will define at a later stage.
Stay cautious and manage your risk!

$AMD trying to breakout on the daily!NASDAQ:AMD being bought heavily by institutions for past 3 days straight. It’s looking like it wants to breakout on the daily. There could be added excitement for NASDAQ:NVDA earnings coming up in the semi-conductor space. I have been accumulating NASDAQ:AMD April 17 115Calls @ 7.00
*Not financial advice

AMD: Hit rock bottom. Huge upside potential from here.Advanced Micro Devices Inc turned neutral on the 1D technical outlook (RSI = 47.032, MACD = -2.460, ADX = 22.524) signaling a potential reversal of the long term bearish trend. This month the price hit the 1M MA50 and if it managed to close the 1M candle over it, we expect to have a market bottom formed much like October 2022 and April 2018. A rally of at least +275% started following both of those bottoms. We believe the risk of buying here is low and the reward high and thus turn bullish (TP = 390.00).
## If you like our free content follow our profile to get more daily ideas. ##
## Comments and likes are greatly appreciated. ##

AMD Longterm Idea...So it's been in the falling wedge on the weekly, If you go back in the chart every time a wedge breakouts and goes on its next run. we have multiple confluences of support giving AMD A fuel tank full of gas ready to ignite. watch this breakout on the weekly and retest resistance as support to see the next run.

$AMD (ADVANCED MICRO DEVICES) – DATA CENTER DOMINANCE & AI AMD (ADVANCED MICRO DEVICES) – DATA CENTER DOMINANCE & AI POTENTIAL
(1/7)
Q4 2024 Revenue landed between $7.65B–$7.7B, beating estimates (~$7.53B). That’s a year-over-year jump fueled by Data Center sales skyrocketing +69% to $3.9B—now over half of AMD’s total revenue! Let’s dive in. 🚀
(2/7) – EARNINGS BEAT
• Q4 2024 EPS: ~$1.09 (a hair above consensus $1.08–$1.09)
• Operating cash flow up +240% YoY—huge liquidity boost 💰
• Despite the beats, stock dipped -2% post-earnings—profit-taking or a sign of sky-high expectations? 🤔
(3/7) – GUIDANCE & MOMENTUM
• Q1 2025 sales guidance: $7.1B (~above $7.0B estimates)
• Indicates continued growth, with AMD’s pivot to AI & data center paying off 💡
• Investors weigh: Are expectations now too lofty?
(4/7) – SECTOR COMPARISON
• AMD’s data center surge outpaces Intel in growth & profitability
• Trails NVIDIA in AI infrastructure domination, but could be undervalued if the market’s underestimating AMD’s AI diversification potential ⚙️
• Future gains might hinge on capturing more hyperscaler demand 🔗
(5/7) – RISK FACTORS
• NVIDIA: Still the top AI chip supplier—AMD must fight for share
• Semiconductors are cyclical: macro downturn = potential demand drop 📉
• TSMC reliance → supply chain or geopolitical hiccups
• The -2% stock drop post-earnings suggests the bar is set high
(6/7) – SWOT HIGHLIGHTS
Strengths:
Data Center revenue up 69% → half of total rev 🌐
Diversified portfolio, not just PC chips
Strong cash flow fueling R&D
Weaknesses:
Lags NVIDIA in AI adoption
Post-earnings stock dip hints at market skepticism
Opportunities:
AI expansions beyond GPU domination
Partnerships / acquisitions → deeper AI capabilities 🤖
Emerging markets (auto, IoT, etc.) for chip technology
Threats:
Fierce competition (NVIDIA, Intel)
Economic slowdowns
Regulatory or supply chain bumps ⚠️
(7/7) – Is AMD a prime AI contender or overshadowed by NVIDIA?
1️⃣ Bullish—Data center momentum will fuel AI growth 🚀
2️⃣ Neutral—Solid performance, but needs bigger AI share 🤔
3️⃣ Bearish—NVIDIA leads, AMD can’t catch up 🐻
Vote below! 🗳️👇

AMD (NASDAQ: AMD) Key Breakout Levels to WatchAMD is forming a potential ascending triangle pattern on the daily chart, signaling a possible breakout if momentum continues.
🔍 Key Levels to Watch:
✅ Support Zone: The stock needs to hold above the $108-$109 range for the bullish setup to remain intact.
✅ Breakout Level: A push above $114 could confirm upside continuation.
✅ Target Levels: If AMD breaks out, we could see a move toward $117-$120.50 in the near term.
The yellow 20-day WMA and SuperTrend resistance are key hurdles. A strong close above them would confirm a shift in momentum.
💬 What’s your outlook on AMD? Do you think it can break out, or will it face resistance? Drop your thoughts below! 👇

$INTC Nice Long Base – Ready to Breakout?NASDAQ:INTC oh how the mighty fall from grace. But so much for nostalgia. INTC has been basing since August 2024 for over 6 months. It looks like it has support around $19. It has tried to get moving a few times but no go.
Today it has tested both the longer term and shorter-term downtrend lines (DTL). It is testing today on the news that JD VANCE said AI will be built in the US. I have tried this name before and have been stopped out for a small loss. I have an alert set on the long term DTL. Should that trigger, I will want a convincing close above it. Looks to me, risk is well defined with a stop under $19. At current price that is about an 11% Stop Loss. Too much for me, so I would go to a lower timeframe to see if there is a better Risk Reward stop. All TBD.
I am only posting this because I like the longer base and thought you might want it on your watchlist as well.
This is my idea, if you like it, make it your own to fit “your” trading plan.
