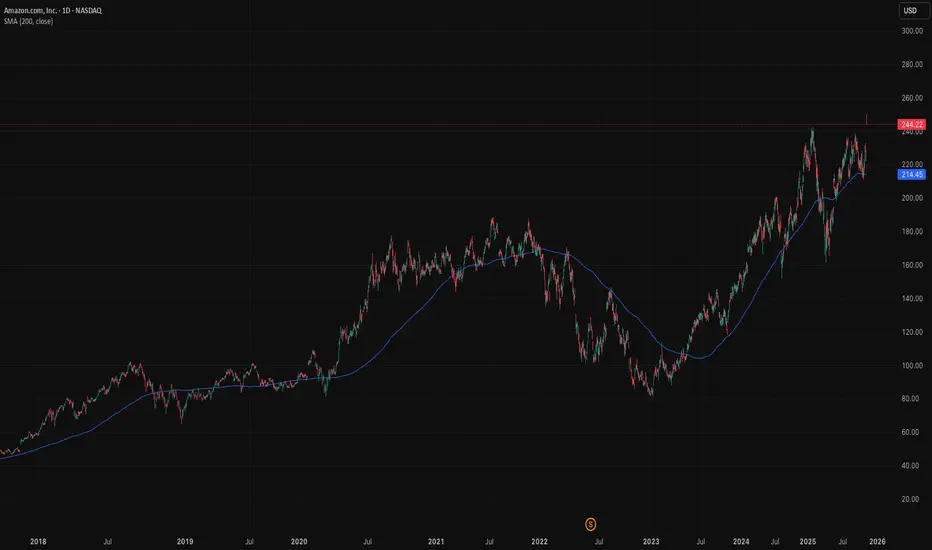
AMAZON flashing a massive 5-year Sell Signal.More than 5 months ago (May 28, see chart below), we gave a strong buy signal on Amazon Inc. (AMZN), which last Friday hit our $255 Target:
This time we come across a massive Sell Signal on the 1W time-frame as the price hit (and is so far being rejected on) the 5-year Higher Highs trend-line that started back on the August 31 2020 Top.
We can see that during that period of time, Amazon had started a Triple Top formation that eventually led to the final rejection and the start of the 2022 Bear Cycle. Until we can talk about such a correction, we can expect at least a pull-back to its 1W MA50 (blue trend-line) as all of those 2020/21 rejections did. As a result, our medium-term Target on Amazon is $220.
Notice also the similarities between the 1W RSI sequences between the two fractals (2020/21 and 2024/25), both forming Lower Highs patterns.
-------------------------------------------------------------------------------
** Please LIKE 👍, FOLLOW ✅, SHARE 🙌 and COMMENT ✍ if you enjoy this idea! Also share your ideas and charts in the comments section below! This is best way to keep it relevant, support us, keep the content here free and allow the idea to reach as many people as possible. **
-------------------------------------------------------------------------------
💸💸💸💸💸💸
👇 👇 👇 👇 👇 👇
AMZN

Amazon: Break Through ResistanceAmazon shares recently surged decisively above the resistance level at $242.52. This strong rally has pushed the beige wave V significantly higher. For now, we see further upside potential for this move, until the broader wave (V) in blue is complete.

Amazon (AMZN) Shares Reach $250 for the First TimeAmazon (AMZN) Shares Reach $250 for the First Time
As the chart shows, Amazon (AMZN) shares rose to a record high on Friday, reaching the $250 mark for the first time. This came after the publication of a strong earnings report:
→ Revenue: $180.2 billion (up 13% year on year).
→ Earnings per share (EPS): actual = $1.95, forecast = $1.56 (a 25% beat).
Investor sentiment was further boosted by the following:
→ AWS (Amazon Web Services) revenue grew by 20% year on year, despite competition from Microsoft Azure and Google Cloud.
→ Amazon issued a confident outlook for the crucial holiday (fourth) quarter.
Technical Analysis of Amazon (AMZN) Chart
When analysing the chart on 24 September, we:
→ used AMZN share price fluctuations to construct an upward channel (shown in blue);
→ noted early signs of weakness.
Subsequently, the price reached a low at point A – where the bulls found support from the lower boundary of the channel and the August low (in fact, there was a false bearish breakout) – and made a successful attempt to resume the uptrend.
The two red candles on Friday suggest that the initial reaction to the report may have been overly optimistic (as confirmed by the RSI indicator). Therefore, it is possible that a corrective move will follow – for example, towards the support area that includes:
→ the median line of the current channel;
→ the previous all-time high of $242;
→ the September high around $238;
→ the 0.382 Fibonacci retracement level of the A→B impulse, around $235.
This article represents the opinion of the Companies operating under the FXOpen brand only. It is not to be construed as an offer, solicitation, or recommendation with respect to products and services provided by the Companies operating under the FXOpen brand, nor is it to be considered financial advice.
Bullish on Amazon as the tide turns backAmazon’s recent job cuts aren’t a sign of weakness, they’re a strategic recalibration. The company is shifting from broad expansion to focused execution. In the AI era, scale isn’t just about size, it’s about precision.
Amazon has trimmed roles across Alexa, devices, and some corporate functions. These are legacy bets, not core growth engines. At the same time, it’s doubling down on AI infrastructure, robotics, and cloud innovation. This is not belt-tightening for survival, it’s reallocation for higher returns.
The broader theme is operating leverage. Amazon is reshaping its cost structure to match a new kind of growth, leaner, smarter, more profitable. AI tools aren’t just powering customer-facing products, they’re cutting fulfillment times, optimising logistics, and automating warehouses. Fewer people, more output.
These cuts also signal cultural focus. Amazon is pushing resources into areas where it sees outsized opportunity. AI chips, ad tech, fulfillment innovation. All of these carry higher margins and more defensible moats than traditional retail or hardware.
To be clear, the job cuts matter. They’re part of the margin expansion story. But they must be seen in context. Amazon is not retreating, it’s refining. And for long-term investors, that distinction makes all the difference.
The stock is now sitting comfortably above its 200-day moving average.
The forecasts provided herein are intended for informational purposes only and should not be construed as guarantees of future performance. This is an example only to enhance a consumer's understanding of the strategy being described above and is not to be taken as Blueberry Markets providing personal advice.
Stock Market Forecast | TSLA NVDA AAPL AMZN META MSFTStock Market Forecast | CME_MINI:NQ1! CME_MINI:ES1! NASDAQ:NDX SP:SPX
Mag 7 | TSLA NVDA AAPL AMZN META MSFT GOOGL

Amazon (AMZN): Ready for a New Breakout!Amazon isn’t just delivering packages — it’s delivering earnings surprises and a chart breakout too! 😎
After reporting strong Q3 earnings on 30 Oct 2025 , AMZN’s chart popped with a clean cup & handle breakout on 31 Oct 2025 — just in time for a bullish Halloween rally 🎃🐂
💰 Earnings Highlights :
Revenue : Came in above expectations, boosted by AWS and advertising growth.
EPS : Beat market estimates, showing stronger profitability.
Operating cash flow : Improved significantly — partly thanks to deferred tax effects — giving Amazon more room for CapEx and expansion.
☁️ AWS Power :
AWS continues to lead the way with steady growth and improved margins. Analysts expect momentum to carry into Q4 2025 , supported by rising demand for cloud and AI-driven services.
📊 Technical View :
The chart shows a classic cup & handle breakout — volume confirmation looks solid, suggesting potential continuation into year-end.
🔥 My Take:
When strong fundamentals meet a clean technical setup, that’s where the magic happens. Amazon might just be brewing a latte-fueled rally into Q4 ☕🚀

AMZN Bullish Breakout: Retest Above 238 Toward 255–265AMZN just cleared a four-month rectangle (214–238) with a decisive late-October surge, shifting the daily trend back to bullish. Price now rides above the 20/60/120-day MAs with expanded volatility—classic post-breakout behavior. The former lid at 238 flips to support, while the next clear shelf sits near the psychological 255.
Primary path: look for a constructive pullback into 238–242 to validate the breakout. A daily close above 242, a 1H close >248, or a continuation break through 250.50 can serve as triggers. If buyers defend 238 on the retest, the path of least resistance favors a push into 252–254, then the measured round-number objective at 255, with extension toward 265 if momentum persists and volume stays supportive.
If 238 fails on a decisive close, treat it as a false break and expect rotation back into the prior range, with 230 as the magnet. Invalidation for the bullish idea sits on a firm daily close back below 238; conservative risk placement can sit around 235–236 to protect against a failed retest.
This is a study, not financial advice. Manage risk and invalidations

LLY LOOKS BULLISH OCT 31 2025I have LLY from lower levels of 870ish which was trade 2. Trade 1 was initiated at 637. Now again it looks ready to go to 890
I am long since $815 yesterday.
Trade as per your risk management and its a current price trade so SLs would be huge. But I can understand what price is trying to do here.
LLY should breakout

AMZN Break Out -- Bullish1HR time frame paints a good picture of what's to come in the short term...at least from my perspective.
AMZN finally broke through the sideways chop today with momentum and pushed to the 1.618 fib (from the closed peak of the last wave on 10/3 to the closed low on 10/6).
RSI showing momentum and in an upward trend despite the recent choppiness since 9/25.
RSI peaked at about 77, and looking to cooldown after the breakout. I suspect we'll see price revisit mid $223 before continuing upwards. Will most likely see stair stepping up to the $230's.

Stock Market Forecast | TSLA NVDA AAPL AMZN META MSFTStock Market Forecast | CME_MINI:NQ1! CME_MINI:ES1! SP:SPX NASDAQ:NDX
Mag 7 | TSLA NVDA AAPL AMZN META MSFT GOOGL

NASDAQ 100 (NDX)-The Grand Super Cycle Journey🧠 The Grand Super Cycle Journey of NASDAQ 100 (NDX)
Here's a comprehensive, narrative-style description of NASDAQ 100 (NDX) INDEX based on Elliott Wave Theory , Smart Money Concepts (SMC) , Fibonacci Retracements/Extensions , Price Action , and Fundamentals across Super Cycle , Macro , and Micro Waves 🔍📈:
🌱 Super Cycle Wave 1: The Birth of Tech (1986–2000)
The journey begins with Wave 1 , ignited by the early tech boom — Microsoft, Intel, and the rise of Silicon Valley 🚀. This impulsive leg spans over a decade, culminating in the dot-com bubble peak in 2000.
🔹 Smart Money Insight: Early accumulation started in the '80s, followed by massive markup into the 1990s. Retail entered late, leading to the euphoric climax in 2000.
🔹 Price Action: Parabolic rallies, breakouts through historical resistance, ending in a massive overextension.
🔹 Fundamentals: Era of growth, innovation, low inflation, and initial internet adoption.
🌪️ Super Cycle Wave 2: The Great Correction (2000–2009)
The bursting of the dot-com bubble triggered a complex correction labeled as W-X-Y. This 9-year structure ends in the 2008–09 financial crisis low. The market retraced to the 0.382 Fibonacci level , a classic deep correction in a strong long-term bull market.
🔸 Smart Money: Distribution at the top → manipulation through global uncertainty (9/11, housing bubble) → reaccumulation near the 2009 lows 🧠📉.
🔸 Fundamentals: Enron scandal, 9/11, housing collapse, Lehman bankruptcy — a decade of fear and instability 🏚️.
🚀 Super Cycle Wave 3: The Exponential Phase (2009–2029)*
The most powerful leg — Wave 3 — is unfolding, targeting an eventual 2.618 Fibonacci extension (~85,000) . This wave is subdivided into 5 Macro Waves , each composed of 5 Micro Waves . Here's how the structure progresses:
⚙️ Macro Wave 1 (2009–2012)
Started at the GFC low, this wave marked the beginning of recovery, finishing with 5 orange micro waves .
🟠 Micro Waves: A clean 5-wave impulse showing the early stages of structural strength.
📊 Price Action: Break of structure (BoS) confirms bullish reversal.
🏦 Fundamentals: QE1/QE2, low interest rates, tech stabilization, birth of FAANG era 💻.
📈 Smart Money: Institutions started accumulating in late 2009–2010, reflected in tight consolidations and sharp rallies.
🔁 Macro Wave 2 (2012)
A brief and shallow correction within the bullish context — a classic bullish flag in terms of price action. Quickly ended with higher lows.
🧠 SMC: Short manipulation phase to shake weak hands.
📉 Price Action: Pullback respected prior structure — no trend break.
💥 Macro Wave 3 (2012–2021)
This was the largest and most explosive wave , extending over 9 years and forming 5 purple micro waves.
🟣 Micro Waves: Clean impulsive structure, confirming a classic Elliott wave fractal.
💡 Fundamentals:
Rise of cloud computing
Mobile-first economy
AI, semiconductors, and social media explosion
COVID-19 crash and rebound — the fastest recovery in history
🔹 Fibonacci: No deep retracements — sign of a healthy, powerful wave 3.
🧠 Smart Money: Deep accumulation during COVID crash → massive expansion post-March 2020 📈.
🧱 Macro Wave 4 (2021–2022)
A healthy correction that reset the structure — completed around the 2022 low. This wave maintained market structure integrity.
🔻 SMC: Liquidity sweep of previous lows + mitigation of demand zones.
📊 Price Action: Range-bound, bearish to neutral.
🌍 Macro Headwinds:
Interest rate hikes
Inflation fears
Global instability (Russia-Ukraine, energy crisis)
🧬 Macro Wave 5 (2022–2029) – Now Unfolding*
This is the final thrust of the Super Cycle Wave 3 , subdivided into 5 micro waves (current count in progress):
🔸 Micro Wave 1 ✅
Initial rally from 2022 lows, showing strong impulsive behavior.
🧠 Smart Money: Confirmed shift from reaccumulation to expansion.
🔸 Micro Wave 2 ✅
Pullback formed higher low — acted as final reaccumulation.
🔴 Micro Wave 3 – In Process (2025–2026)
This is expected to be the strongest wave within Macro Wave 5, projected to peak near 36,000 (2.618 extension of micro 1–2).
📈 Price Action: Aggressive higher highs and shallow pullbacks.
🧠 SMC: Expansion with little liquidity left below — institutions pushing price up.
💡 Fundamentals:
AI hypergrowth
US tech dominance
AI chips, quantum computing, tokenization
Renewed bullish risk appetite 🌐
🟠 Micro Wave 4 (Expected 2026–2027)
A corrective wave likely to retest the macro structure — forming a flag or triangle.
📉 Price Action: Sideways to downward chop, retracing 0.382–0.5 of wave 3.
🧠 SMC: Inducement setup before final rally.
🌍 Macro: Possible geopolitical or monetary tightening phase.
🔵 Micro Wave 5 (Expected Top in 2029)
The final leg of Macro Wave 5 and Super Cycle Wave 3. Expected to top near 85,000 , a 2.618% Fibonacci extension of Super Cycle Waves 1–2.
🎯 Final Parabolic Blow-Off
📊 Price Action: Euphoria, exponential rally, low-volume melt-up
📈 Smart Money: Final distribution phase — retail FOMO peaks
🧨 Fundamentals: Mania phase — “everything AI/metaverse/tokenized” narrative, record valuations, IPO booms.
🔮 Looking Beyond: Super Cycle Wave 4 (Post-2029)
Once the 85K target is met, a multi-year correction is expected — possibly deep and drawn out. Historically, Wave 4s retrace 0.236% to 0.382% and take years to unfold.
🧠 Expect:
Systemic debt pressure
Currency shifts
Economic reset themes
Potential Fed policy overcorrection
Liquidity crunch
🌧️ Super Cycle Wave 4 may retest previous demand zones around 30–36K.
📚 Final Thoughts
Our analysis represents an extraordinary blend of Elliott Wave fractals , institutional behavior (SMC) , and macro-fundamental alignment . We are in the late phase of a historical Super Cycle rally — but Wave 3 still has room to run 📈.
✅ Wave Count Aligned
✅ Fibonacci Extensions Respected
✅ SMC Structure Intact
✅ Macro-Fundamentals in Sync
📌 2025–2029 could be the final push before a generational correction. Smart investors must watch for distribution signs post-36K 📊.
"Trust the waves, not the noise." – FIBCOS 🌊
📘 Disclaimer: This is a structural, educational market outlook. Not financial advice. Please do your own due diligence and risk management.
#FIBCOS #ElliottWave #SmartMoneyConcept #MarketAnalysis #NASDAQ #XAUUSD #SuperCycle #MacroTrend #SmartMoney #Fibonacci #PriceAction #Commodities #Stocks #TechnicalAnalysis #LongTermOutlook

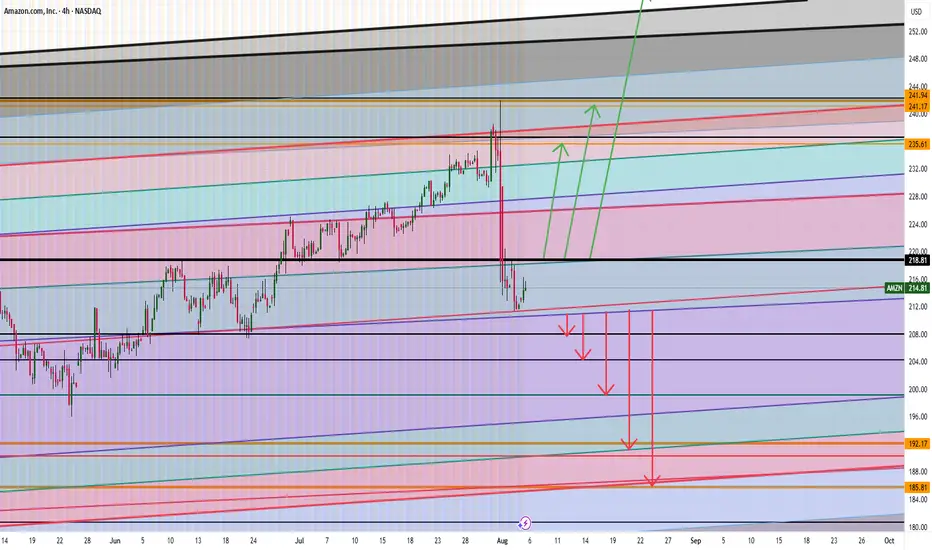
AMAZON (AMZN) - H4 - Double Top Breakdown (19.10.2025)📊 Setup Overview:
Amazon stock (NASDAQ: AMZN) is forming a Double Top Reversal Pattern on the 4H chart, signaling potential weakness after failing twice to break above the major resistance zone near $238–$240.The price has also broken below the ascending trendline with a cloud crossover, confirming bearish momentum building up. NASDAQ:AMZN
📈 Trade Plan:
Bias: Bearish below $220
1st Target: $197.91 ✅
2nd Target: $183.99 🎯
Resistance Zone: $238 – $240
🧩 Technical Confluence:
1.Double Top formation near major resistance zone
2.Trendline break confirming reversal
3.Ichimoku Cloud crossover indicating bearish momentum
4.Volume profile shows selling pressure increasing below $215
📉 Fundamental Amazon (AMZN):
Amazon remains one of the most dominant global tech giants, but several near-term factors could impact its price action:
⚡Upcoming Earnings (Late October 2025):
1.Analysts project Q3 FY2025 revenue around $158–160 billion, with EPS expectations near $1.24–$1.30.
2.Focus will be on AWS (Amazon Web Services) performance — which still contributes over 50% of total operating income, but has shown slower growth due to corporate cost-cutting and cloud competition.
⚡Retail & E-commerce Trends:
1.Amazon’s North America segment remains strong but margin pressure continues due to logistics and rising fulfillment costs.
2.The company’s push into AI-driven retail advertising could offset some of that weakness if ad revenue exceeds expectations.
⚡Broader Market Context:
1.With U.S. yields staying elevated, large-cap tech stocks like Amazon may face valuation compression.
2.Institutional rotation toward value and defensive stocks could further weigh on AMZN in the short term.
🎯Overall, fundamentals remain strong for the long-term, but the technical structure suggests a near-term correction before accumulation resumes.
#AMZN #AmazonStock #NASDAQ #USStocks #TechnicalAnalysis #DoubleTopPattern #BearishSetup #PriceAction #EarningsWatch #StockMarket #SwingTrading #TradingView #Ichimoku #CloudCrossover #ChartsDontLie #Kabhi_TA_Trading
⚠️ Disclaimer:
This analysis is for educational purposes only and not investment advice. Always perform your own due diligence and manage risk appropriately before taking any position.
💬 Support the Analysis:
If this chart helped you — LIKE 👍, COMMENT 💬 your thoughts, and FOLLOW ✅ for more daily stock & forex chart breakdowns from Kabhi_TA_Trading!

Stock Market Forecast | TSLA NVDA AAPL AMZN META MSFTStock Market Forecast | CME_MINI:NQ1! CME_MINI:ES1! SP:SPX NASDAQ:NDX
MAG 7 | TSLA NVDA AAPL AMZN META MSFT GOOGL

$AMZN Tradespoon – Long Entry $227.74Tradespoon model generated long signal for NASDAQ:AMZN . Predicted range: $220.98–$229.14. Trend: +0.25%. NASDAQ:AMZN

AmazonAmazon has given us small push up but slow last week, we will expect some more drop this week before a major push up.
Disclosure: We are part of Trade Nation's Influencer program and receive a monthly fee for using their TradingView charts in our analysis.
Stock Market Forecast | TSLA NVDA AAPL AMZN META MSFTStock Market Forecast | CME_MINI:NQ1! CME_MINI:ES1! SP:SPX NASDAQ:NDX
Mag 7 | TSLA NVDA AAPL AMZN META MSFT GOOGL

$AMZN massive cup and handle formingIf we look at the chart of AMZN, we can see that $236 has become an important resistance level.
So far, it's been tested multiple times which means that resistance has weakened. I do think that next time we get up to that level, it'll likely break and we can see higher prices.
On top of the resistance being weakened, there's a massive cup and handle forming on the chart. If we end up breaking resistance, the measured target would be the $313 resistance.
I've marked off other important levels on the chart should price break that key resistance level.
Let's see how it plays out over the coming month. Will likely start accumulating calls on any dips.

AMD Best Level to BUY/HOLD 300% gains SWING TRADE🔸Hello traders, today let's review recent price chart for AMD.
Well defined swings in progress, expecting further downside before
the tide finally turns for AMD bulls. Currently it's recommended to stay out.
🔸AMD is trailing behind NVDA massively, so eventually AMD will to the
mean reversion trade and start to catch up with NVDA, however currently
pullback/correction mode in progress.
🔸Well defined swings - 160 to 58 65% correction, then 58 to 210 280% gains,
210 to 75 represents 65% correction, 75 to 290 is a 280% pump.
🔸Recommended strategy bulls: Bulls wait for correction to complete at/near 75 usd in January 2025 and get ready to BUY/HOLD low, this is a swing trade setup, so will take longer to hit target, patience required. final TP is 290 USD, 280% upside off the expected lows. good luck traders!
🎁Please hit the like button and
🎁Leave a comment to support our team!
RISK DISCLAIMER:
Trading Futures , Forex, CFDs and Stocks involves a risk of loss.
Please consider carefully if such trading is appropriate for you.
Past performance is not indicative of future results.
Always limit your leverage and use tight stop loss.

AMAZONAMZN is almost ready to push up further to take ATH.
Disclosure: We are part of Trade Nation's Influencer program and receive a monthly fee for using their TradingView charts in our analysis.

Stock Market Forecast | TSLA NVDA AAPL AMZN META MSFTStock Market Forecast | CME_MINI:NQ1! SP:SPX NASDAQ:NDX CME_MINI:ES1!
Mag 7 | TSLA NVDA AAPL AMZN META MSFT GOOGL

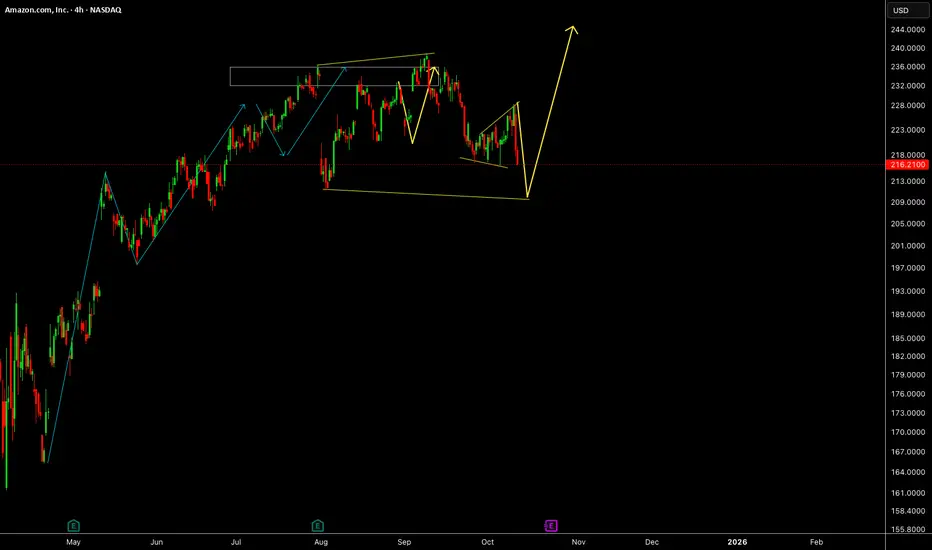
AMAZON ARE WE HEADING TO $258 ? HERE IS THE FULL ANALYSIS Hi Trading fam
So we have Amazon and based on what we are seeing we see two scenarios playing out:
Bullish:
If we can break and hold above 219 then we can see levels of : 235,241,and 258 being hit
Bearish:
If break the low of 210 then we hit 207,204, 199, 190 and then 185
Trade Smarter Live Better
Kris
Are We About To See A HUGE Change In The Market...Stock Market Forecast | QQQ SPY CME_MINI:NQ1! CME_MINI:ES1! SP:SPX NASDAQ:NDX
Mag 7 | TSLA NVDA AAPL AMZN META MSFT GOOGL

AMAZON FREE SIGNAL|SHORT|
✅AMZN Price rejects supply area with ICT displacement, showing bearish order flow. Liquidity below 217$ becomes the likely draw as inefficiency invites continuation.
—————————
Entry: 220.10$
Stop Loss: 222.00$
Take Profit: 217.00$
Time Frame: 2H
—————————
SHORT🔥
✅Like and subscribe to never miss a new idea!✅
