Pound — the rebound follows the rebound:Good day, dear investors and colleagues traders!
The currency pair continues to decline for the second week in a row. The trend, which was started after reaching a lower local maximum at 1.2641, found some resistance in the 1.2420 zone.
This week, the currency pair forms an upward channel after the fall, however, in contrast to the last time, in this case, there are no indicator data and volatility growth, which implies a trading figure - “Rising Wedge”.
This figure, often occurs after the fall of the asset and usually predicts the continuation of movement.
Following the results of the week: the currency pair showed a maximum of 1.2645 and closed the week +121 points.
Technical analysis:
H1
At the moment, the price chart is showing a wedge, given its behavior,
a currency pair can reach the zone 1.2510-1.2540 and from there push off to lower levels.
There are some similarities at the moment in the EURUSD and GBPUSD charts, perhaps we will see a synchronous strengthening of the dollar.
The managing director of WMCI Asset Management is Sergey Melnikov.
H4
Indicator analysis of overbought / oversold is in the neutral zone.
An indicator of price behavior is also in the “Normal price behavior” phase.
= ≥ The price is in the normal zone and maintaining short positions is an adequate trading solution.
W1
If you look at the daily chart, you can see how the price doubled off from the 200 daily moving average. Moreover, trend indicators began to decline, despite the fact that the price was trying to stabilize.
Volatility data and possible goals for the current month:
A) Average volatility:
- Weekly = 114 points;
- Monthly = 150 points;
- 3 months = 132 points;
B) Potential goals:
- For bulls = 1.2763, 1.2946 and possibly 1.3246
- For bears = 1.2280, 1.1980 and possibly 1.1797;
- Monthly pivot point = 1.2465;
! Attention, average volatility must be taken into account when placing stops, so that your order is not knocked down by market noise.
! Attention, potential monthly targets may be both final closing levels of positions and potential reversal levels.
Recommendations:
Continue to hold short positions with a break-even position.
Regards to subscribers,
Ltd. Wermelgion & Partners Investment
! Attention: Trading financial instruments and (or) cryptocurrencies is fraught with high risks, including the risk of losing part or all of the investment, therefore it is not suitable for all investors. Cryptocurrency prices are extremely volatile and can change due to external factors such as financial news, legislative decisions or political events. Margin trading leads to increased financial risks.
Ltd ”Wermelgion and Partners Investment” and any provider of the data contained on this website disclaim liability for any loss or loss incurred as a result of trading transactions made with reference to the information provided.
Analytics

EURUSD - Down is done, when up?Greetings dear investors and traders!
The currency pair worked perfectly for the movement, which could be predicted by many mathematical indicators.
While market analysts are looking for an excuse for this movement, let's see what has changed in the technical picture last week:
Euro - formed a new maximum at 1.1019 and ended the week with an increase of ≈158 points or + 1.46%, while it overcame the global trend down and local resistance from the past triangle.
So, we see the prerequisites for the growth of the trading range and a possible increase in volatility.
Technical analysis:
H1
Given such a strong decline that we are seeing this week, it will be difficult to expect a further decline from the euro.
Price movement implies the achievement of a downtrend retest level.
At the same time, it is extremely important how the price behaves. There are 2 scenarios:
No. 1:
The pair will continue to decline to the level of retest, and from there it will begin to smoothly consolidate. If successful, the price will be able to demonstrate growth in the region of 1.1020-1.1050.
No. 2:
The currency pair will jump from the current zone back to the level of 1.0900, in this case, it will be more like a classic, indicative rebound. And when consolidating or activating sellers, we will see lower levels, possibly 1.0750.
H4
The price approaches the zone of potential purchases, but at the moment, the opening of long positions is premature.
The price has not gone beyond the framework of “adequate behavior”.
= ≥There are no signs of closing short positions yet.
W1
Global trends have not changed after the volatile months of 2020, this can be judged on the basis that the average price for 100 days does not overcome the 200-day average line.
Volatility data and possible goals for the current month:
A) Average volatility:
- Weekly = 89 points;
- Monthly = 99 points;
- 3 months = 80 points;
B) Potential goals:
- For bulls = 1.1078, 1.1211 and possibly 1.1387;
- For bears = 1.0770, 1.0592 and possibly 1.0460;
- Monthly pivot point = 1.0923;
! Attention, average volatility must be taken into account when placing stops, so that your order is not knocked down by market noise.
! Attention, potential monthly targets may be both final closing levels of positions and potential reversal levels.
Recommendations:
If you hold short positions like us, they can be transferred to breakeven, as the current week promises to be very volatile.
Purchases are possible from the level of: 1.0800, but only in case of consolidation.
Repeated sale is possible from 1.0900, but with short stops - 1.0930 and also, only in case of consolidation.
To your attention, a link to the analysis in tradingview:
Regards to subscribers,
Ltd. «Wermelgion & Partners Investment»
!Attention: Trading financial instruments and (or) cryptocurrencies is fraught with high risks, including the risk of losing part or all of the investment, therefore it is not suitable for all investors. Cryptocurrency prices are extremely volatile and can change due to external factors such as financial news, legislative decisions or political events. Margin trading leads to increased financial risks.
Ltd ”Wermelgion and Partners Investment” and any provider of the data contained on this website disclaim liability for any loss or loss incurred as a result of trading transactions made with reference to the information provided.

#NFLX Expectation I expect the NFLX going up to the 429.58 level for However can back to the trend line
i f break the trend line for sure will going down to 421.02 level

High probability for the S&P500High probability for the s&p500 going up to 2854.5 if BREAK the 2846 level HOWEVER if the price respect the 2837.7 level can back to 2802

EURGBP --- The bumpy path to the top:Good day, dear investors and colleagues traders!
This week, the currency pair took advantage of bullish divergence and broke through the global down trend line, which it fought for the whole week.
However, the proximity to the reversal of indicators such as MACD, Stochastik and the presence of the hourly chart in a zone of high oversold, may indicate a potential down-trend retest.
The asset formed a new low this week at 0.8671, while local high is at 0.8863.
Thus, this week the asset grew by only 50 points.
Technical analysis:
H1
Analysis of the data suggests that on Monday we will most likely spend in correction to the down trend zone, from where it is necessary to wait for the bulls reaction. At the moment, it is clearly seen that the 0.8685 zone is holding back seller activity.
H4
The price has moved out of the normal price movement zone. And it fits tight to the potential sales area. However, this price analysis suggests that it is too early to open a deal.
W1
Special attention is paid to the weekly chart in which the currency pair reversal was formed.
Volatility data and possible goals for the current month:
- Average volatility:
a) Weekly = 71 points;
b) Monthly = 93 points;
c) Three-month = 81 points;
- Potential goals:
a) For bulls = 0.8849, 0.9003 and possibly 0.9089;
b) For bears = 0.8609, 0.8520 and possibly 0.8368;
! Attention, the average volatility must be taken into account when placing stops, so that your order would not be knocked down by market noise.
! Attention, potential monthly goals can be both final closing levels of positions and potential reversal levels.
Recommendations:
At the moment, we do not recommend market participants to enter the market, since there is little explicit data for entry, it will be necessary to analyze the schedule for Monday.
Regards to subscribers,
Ltd. Wermelgion & Partners Investment
! Attention: Trading financial instruments and (or) cryptocurrencies is fraught with high risks, including the risk of losing part or all of the investment, therefore it is not suitable for all investors. Cryptocurrency prices are extremely volatile and can change due to external factors such as financial news, legislative decisions or political events. Margin trading leads to increased financial risks.
Ltd ”Wermelgion and Partners Investment” and any provider of the data contained on this website disclaim liability for any loss or loss incurred as a result of trading transactions made with reference to the information provided.

XBTUSD: Look at the monthly timeframeOkay, let's take a look at the monthly chart. Bitcoin price demonstrates definitely bullish SFP and April closed around $9000 up to 50%.
We clearly bounced off support at $6400 and currently floating at resistance.
Bullish case :
I think if XBTUSD we get monthly close above $9400 we'll move higher with next target at $10500-$10700.
And do not forget that we have Halving in this month, ETA 12th of May. For example, it can rise before Halving event and fall after.
At least this month, BTS should test the $ 9400 level a couple of times.
Bearish case:
Since we are near resistance, Bitcoin begins to fall before Halving event and finds support in the range of $ 7,000 - $ 6,000
Hit the "LIKE" button and follow to support, thank you.
Information is just for educational purposes, never financial advice. Always do your own research.

#XAUUSD Expectation for Goldin my opinion the is high expectation for the gold going up the the 1696.25 level if respect it can back the down side until 1682.25 however if you have a strong break down " 1682 " level then the price will going down to the " 1663.35 "

#S&P500 Expectation High expectation for the price Will Going Down To the 283.3 Level if break the 2841.9 level
however can respect the yellow zone

#AMZN expectation for 30/04/2020High Probability for the #AMZN going down to "2311.5" if the price break the 2363.26 However if bread the 2380 then will going up the "2414.05"

Expectation for #AAPL 4/29/2020High Probability the Price Will Going Down To 277.15 Level If respect will back to the up side however if we have a strong BREAK for the 277.14 Level then the price for sure will down to the 274.9 maybe 274

#HOG Expectation high probability for the "Harley Davidson" Price down to the 20.40 if we have a strong break for the 21.46 level However the price can respect the 21.46 level and going up

#AAPL expectation High Expectation for the AAPL if the price respect the 282.3 Level Back down to the 278 down side .however if we have a strong break to the up side we can have the next target 286

Expectation for the #NvidiaHigh Expectation for the Nvidia going up if we have strong break for the 0.5 level
however the price can respect this level and back to the down side

#BTC Expectation i expect the price will up to 7745 if break the 0.38 level maybe back down if respect the 0.5 but if we have a strong break for this level maybe will continued to the up side

#RY Expectation for the next week Expectation for the price up to 59.66 after if break the 0.5 level will going up to 0.38 level if the price respect the 0.5 level then will back to the down

A reversal formation is possibleThe double top pattern is formed on the 1-day timeframe. At this time, the formation has not yet been confirmed. Conservatively enter the short only after its confirmation, that is, after breaking the support level of 6600-6700$.

GBPUSD - The Growing Wedge:# Technical_analysis_and_comments:
Good day, dear investors and colleagues traders!
Your attention a technical analysis of the currency pair #Gbpusd:
The currency pair has not practically changed relative to the last close, although the pair made an attempt. The contracting range creates the classic “Growing Wedge” trading figure, which suggests a decline to 1.22-1.20.
The currency pair demonstrates the normal performance of standard indicators of price and volume.
We expect a decline to the lower border, its breakthrough and fixation under it.
This week suggests a constant news flow of macroeconomic statistics for the UK, and given global trends, they will clearly be negative.
Levels of mathematical support and resistance for the current week:
a) Support: 1.2392, 1.2280 and possibly 1.2152;
b) Resistance: 1.2634, 1.2760 and possibly 1.2874;
Market participants are strained by the growing third deficit in the UK under current conditions, but 2 negative factors can immediately add to this: uncertain Brexit and the weakness of the British economy.
Manager of WMCI Asset Management Indirect Management Fund Sergey Melnikov.
Regards to subscribers,
Ltd ”Wermelgion and Partners Investment”

EURUSD - and again the triangle:# Technical_analysis_and_comments:
Good day, dear investors and colleagues traders!
In this article, we examined the technical side of the #EURUSD currency pair:
The currency pair completed the decline last week, leaving the ascending channel and forming a tapering triangle, the vertices of which you can see on the chart.
A currency pair demonstrates normal indicators of standard indicators of price and volume.
Which makes it possible to use trade both inside the triangle, and in case of breaking it.
Levels of mathematical support and resistance for the current week:
a) Support: 1.0793 and 1.0713;
b) Resistance: 1.0971, 1.1069 and possibly 1.1149;
Volatility should increase this week, as there will be very many, most likely negative statistics and all the attention of investors will be focused on the locomotive of the Eurozone - Germany.
Manager of WMCI Asset Management Indirect Management Fund Sergey Melnikov.
Regards to subscribers,
Ltd ”Wermelgion and Partners Investment”
!Attention: Trading financial instruments and (or) cryptocurrencies is fraught with high risks, including the risk of losing part or all of the investment, therefore it is not suitable for all investors. Cryptocurrency prices are extremely volatile and can change due to external factors such as financial news, legislative decisions or political events. Margin trading leads to increased financial risks.
Ltd ”Wermelgion and Partners Investment” and any provider of the data contained on this website disclaim liability for any loss or loss incurred as a result of trading transactions made with reference to the information provided.

EUR/GBP - new triangle:# Technical_analysis_and_comments:
Good day, dear investors and colleagues traders!
Your attention a technical analysis of the currency pair #Eurgbp:
All last week, the currency pair spent in a narrow trading range sandwiched between a downtrend and a new support level - 0.8685, thereby forming a new triangle.
The currency pair demonstrates the normal performance of standard indicators of price and volume.
As a result of this, we can safely say that if the downtrend persists, the next target for the bears will be - 0.8574, which is the Fibonacci support level of 76.4% of the past uptrend.
If the currency pair can break through the downtrend and gain a foothold above it, then the first target for long positions will be 0.8745, psychological mark 0.88 and possibly 0.8883 (50% Fibonacci support).
This week suggests a constant news flow of macroeconomic statistics for the UK, and given global trends, they will clearly be negative.
Market participants are strained by the growing third deficit in the UK under current conditions, but 2 negative factors can immediately add to this: uncertain Brexit and the weakness of the British economy.
Manager of WMCI Asset Management Indirect Management Fund Sergey Melnikov.
Regards to subscribers,
Ltd ”Wermelgion and Partners Investment”
!Attention: Trading financial instruments and (or) cryptocurrencies is fraught with high risks, including the risk of losing part or all of the investment, therefore it is not suitable for all investors. Cryptocurrency prices are extremely volatile and can change due to external factors such as financial news, legislative decisions or political events. Margin trading leads to increased financial risks.
Ltd ”Wermelgion and Partners Investment” and any provider of the data contained on this website disclaim liability for any loss or loss incurred as a result of trading transactions made with reference to the information provided.

Head and shoulders pattern on 4 hours The head and shoulders pattern was formed on the 4-hour timeframe. If the support level 6600-6700 will be broken, I expect the price to continue falling.

Cup with handle on the etherI expect the formation of this pattern to be completed and, if the resistance level 173.55-176.4$ is broken, I expect the price to rise.

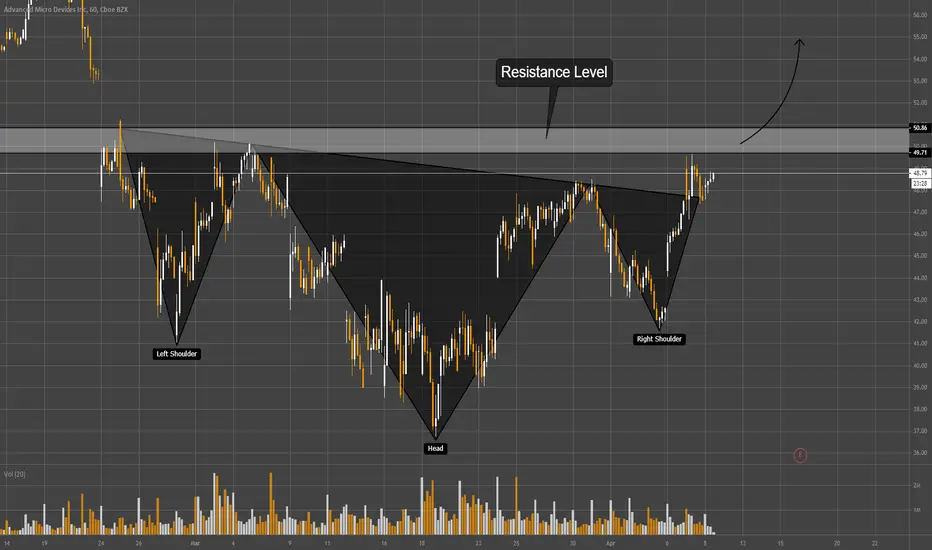
Inverse Head And Shoulders on AMDIf the resistance level 49.71-50.86 is broken, I expect growth of quotations.
Wedge on timeframe 1 dayThe wedge was formed on timeframe 1 day. I expect growth of quotes if the price breaks the upper limit of the pattern.
