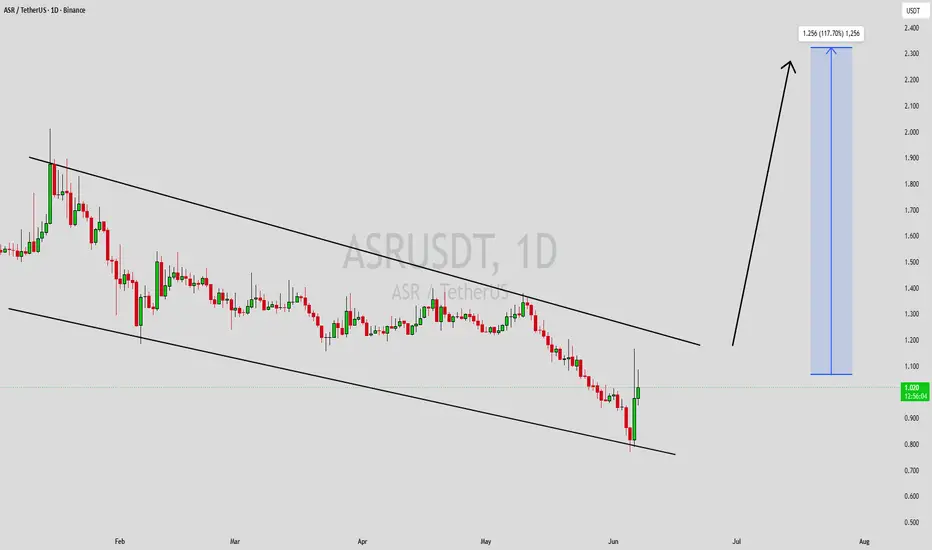
ASRUSDT Forming Falling WedgeASRUSDT is forming a clear falling wedge pattern, a classic bullish wave signal that often indicates an upcoming breakout. The price has been consolidating within a narrowing range, suggesting that selling pressure is weakening while buyers are beginning to regain control. With consistent volume confirming accumulation at lower levels, the setup hints at a potential bullish breakout soon. The projected move could lead to an impressive gain of around 90% to 100% once the price breaks above the we
ASRUSDT
ASRUSDT Forming Falling wedgeASRUSDT is forming a clear falling wedge pattern, a classic bullish wave signal that often indicates an upcoming breakout. The price has been consolidating within a narrowing range, suggesting that selling pressure is weakening while buyers are beginning to regain control. With consistent volume confirming accumulation at lower levels, the setup hints at a potential bullish breakout soon. The projected move could lead to an impressive gain of around 90% to 100% once the price breaks above the we
ASRUSDT Forming Falling WedgeASRUSDT is currently forming a classic falling wedge pattern, which is typically considered a strong bullish reversal signal. This pattern indicates that selling pressure is gradually weakening as the price consolidates within a narrowing range. Once the breakout occurs above the wedge resistance, it often leads to a sharp upward rally. Based on the technical setup, ASRUSDT could potentially deliver gains of 90% to 100%+, offering traders a compelling opportunity in the coming sessions.
The vol
ASTUSDT Forming Bullish MomentumASRUSDT is showing a powerful bullish momentum pattern that signals the possibility of a strong rally ahead. The price action is gaining traction with consistent buying volume, indicating growing confidence among traders and investors. This setup suggests that the pair could deliver a substantial upside move, with projections pointing toward gains of 190% to 200%+. Such patterns are often seen at the start of major bullish phases, making ASRUSDT a coin to watch closely.
The strong momentum comb
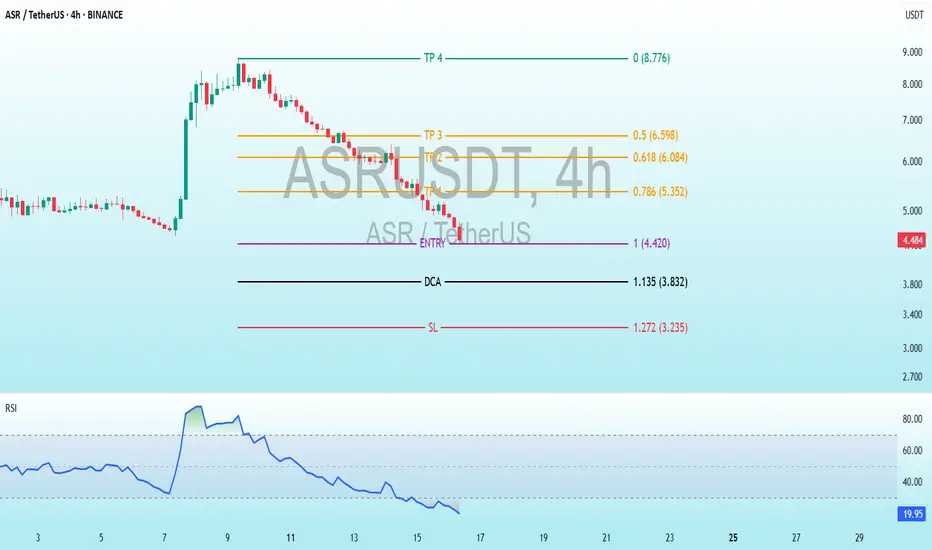
$ASR Bottom Bounce: 4H Trading Plan with Oversold RSIBINANCE:ASRUSDT
Trading Levels:
Entry: 1.00 (4.420 USDT) - The level where the initial purchase is planned.
DCA (Dollar-Cost Averaging): 1.135 (3.832 USDT) - An additional buying point if the price declines.
SL (Stop Loss): 1.272 (3.235 USDT) - The level where the loss would be limited.
TP (Take Profit):TP1: 0.786 (5.352 USDT)
TP2: 0.618 (6.084 USDT)
TP3: 0.5 (6.598 USDT)
TP4: 0 (8.776 USDT) - A significantly lower target, likely an error or long-term goal.
RSI (Relative Strength Index) Indi
ASR Bearish DivergenceBINANCE:ASRUSDT
Trade Setup:
Target 1: 3.883 (0.5 Fibonnaci Golden Zone).
Target 2: 3.190 (0.618 Fibonnaci Golden Zone).
Target 3: 2.204 (0.786 Fibonnaci Golden Zone).
Target 4: 0.948 (1 Fibonnaci).
Stop Loss: 6.817 (0 Fibonnaci).
RSI Analysis: The RSI is showing a bullish divergence, suggesting potential bullish momentum. The current RSI is around 88.00, approaching overbuy territory, so caution is advised.
ASRUSDT Forming Strong Bullish BreakoutASRUSDT has recently delivered a strong bullish breakout, continuing its upward momentum with an impressive surge above the critical resistance level. The price has maintained a steady climb, forming a sharp ascending structure supported by solid volume—an indication of growing investor confidence. Based on the technical projection, ASRUSDT is poised for a 50% to 55% potential gain, making it one of the more attractive setups in the altcoin market currently.
The breakout was preceded by a clear
ASRUSDT Forming Falling WedgeASRUSDT is gaining strong bullish traction after a successful breakout from a falling wedge pattern. This setup is widely recognized in technical analysis as a bullish reversal structure, and the breakout here is backed by consistent price action above the key resistance zone highlighted in red. ASR has now flipped this zone into support, and the trendline structure suggests a continuation move is underway.
The recent candles are forming a clear uptrend, and the momentum is being supported by h
ASRUSDT | First Support Zone IdentifiedASRUSDT may look different at first glance, but underneath the surface the same theme applies—buyers are active here. The blue box marks an area where price has found demand in the past. When price climbs out of that zone, backed by clear low‑time‑frame breakouts, healthy volume and CDV support, that’s when I’ll consider a long setup.
If those criteria aren’t met, I won’t insist on a bullish bias. It’s better to let the market prove its strength first and then follow the move with confidence.
QTUMUSDT UPDATEQTUMUSDT is a cryptocurrency trading at $3.555. Its target price is $5.500, indicating a potential 50%+ gain. The pattern is a Bullish Falling Wedge, a reversal pattern signaling a trend change. This pattern suggests the downward trend may be ending. A breakout from the wedge could lead to a strong upward move. The Bullish Falling Wedge is a positive signal, indicating a potential price surge. Investors are optimistic about QTUMUSDT's future performance. The current price may be a buying opportu
# ASR /USDT# ASR
The price is moving within a bullish channel pattern on a 12-hour frame, which is a retracement pattern
We have a bounce from a green support area at 3.00
We have a tendency to stabilize above the Moving Average 100
We have a downtrend on the RSI indicator that supports the rise and gives greater momentum
Entry price 3.08
The first target is 3.50
The second goal is 3.85
Third goal 4.28
ASR / ASRUSDTGood Luck >>
• Warning •
Any deal I share does not mean that I am forcing you to enter into it, you enter in with your full risk, because I'll not gain any profits with you in the end.
The risk management of the position must comply with the stop loss.
(I am not sharing financial or investment advice, you should do your own research for your money.)
ASR/USDT Breaking Out of Descending Channel?👀🚀 ASR Analysis💎 Paradisers, focus your sights on ASRUSDT, as it enters a critical phase in the market. The asset is indicating a potential breakout from a descending channel.
💎 Looking at #ASRomaFanToken's market behavior, it has consistently followed a descending channel. Currently, ASR is expected to test a previous resistance level, now acting as support at $2.31. There's a considerable chance that ASR might use this level as a springboard for a bullish trend, with an aim for the substantial supply level
AS Roma Fan Token (ASR) AnalysisWe're looking at a 1-hour time frame for the AS Roma Fan Token, or ASR. On this shorter time frame, we can get a good look at the immediate market sentiment and recent price movements. At this point, the ASR market appears somewhat balanced with the RSI registering at a neutral 52, suggesting there's not an extreme bias toward either buyers or sellers.
The Bollinger Bands, a popular tool among traders, are currently indicating that the upper level is at 2.359, the middle at 2.278, and the lower
ASR formed bullish Gartley for upto 13% pumpHi dear friends, hope you are well, and welcome to the new update on AS Roma Fan Token ( ASR ) with US Dollar pair.
Our previous successful trade of ASR was as below:
Now on a 2-hr time frame, ASR has formed a bullish Gartley pattern.
Note: Above idea is for educational purpose only. It is advised to diversify and strictly follow the stop loss, and don't get stuck with trade
AS Roma Fan Token (ASR) formed bullish cypher upto 15.50% pumpHi dear friends, hope you are well and welcome to the new update on AS Roma Fan Token ( ASR ) with US Dollar pair.
Previously we caught a nice pump of ASR in below trade:
Now on a 4-hr frame, ASR has formed a bullish Cypher pattern.
Note: Above idea is for educational purpose only. It is advised to diversify and strictly follow the stop loss, and don't get stuck with trade
AS Rome Fan Token ASR - Huge opportunity! Head and Shoulders!
For some reason, fan tokens have been very strong in recent weeks, so it's a good time to buy!
We have an inverse head and shoulders and a falling wedge pattern on the daily and weekly charts, which is great to see.
Also, the main trendline from 2020 has been destroyed by the bulls recently, which is another great sign of upcoming strength.
If we take a look at the volume indicator, we can clearly see massive bullish volume this year, so there is definitely an increase in interest.
The pr