How Key Fundamentals Can Play A Key Role In Your InvestmentsAs popular as Technical Analysis is with the ease of plotting indicators and tools to exhibit trend changes, Fundamental Analysis also plays a role not as simply demonstrated but equally as important!
Now when it comes to Fundamentals, there are a few key financial items that feed investors all the hints they need to potentially make fairly profitable investments and avoid devastatingly horrible mistakes and these are:
1) Income Statement
2) Balance Sheet
3) Cash Flow
The Income Statement retains the most mentioned fundamental metrics like Revenue which is how much money a company makes by selling their goods and services, Operating Expenses like Marketing and Research and Development.
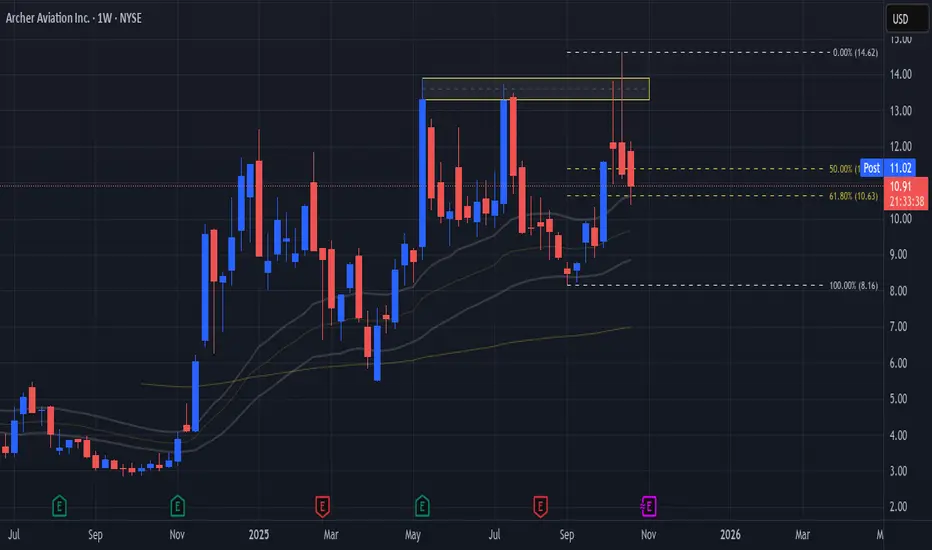
Here I use NYSE:ACHR Income Statement for the example
www.tradingview.com
Even though Archer Aviation still has yet to post any Revenue, news for the company that's come out lately show a strong demand for NYSE:ACHR product and services:
- Signing a partnership with Korean Air to commercialize its electric air taxis in South Korea, with a potential purchase of up to 100 aircraft.
www.tradingview.com
- Named exclusive Air Taxi partner for the Los Angeles Sports & Entertainment Commission who will be hosting the 2026 World Cup.
www.tradingview.com
And with Archer Aviation acquiring Lilium's Patent Portfolio this month adding 300 Patent assets, pushing Archers total patents to exceed 1,000 assets globally, shows rapid expansion potential for the company against competitors!
www.tradingview.com
Now for the Balance Sheet
www.tradingview.com
The Balance Sheet can determine how healthy a company is and produces 3 important factors that basically determine a company's Net Worth and they are:
1) Assets - What the company owns
2) Liabilities - What the company owes
3) Equity - Whats left of the Assets once Liabilities are accounted for
We can see that NYSE:ACHR has maintained a stunning balance between their Assets and Liabilities with Assets just about doubling in Q'2 of 2025 from Q'4 2024 and Liabilities all the while staying relatively the same and low!
Meaning less hurdles to jump and obstacles to pay off that could slow the progress of growth in the long-term with great Equity!
Finally, the Cash Flow
www.tradingview.com
Cash Flow is a companies true way of transparency with showing the flow of cash in and out of the company and shows what's actually generated by the company from doing business and is separated in 3 sections:
1) Operating Activities
2) Investing Activities
3) Financing Activities
Now we can see Operating and Investing activities may not be NYSE:ACHR strong suit yet, but as Financing goes, numbers have continued to rise exponentially since Q'2 of 2024!
This suggests there is a lot of interest in the company from outside lenders and investors!
Like the saying goes, "Sometimes it takes belief in others belief in you before you gain belief in yourself." - Financial Activities could help carry NYSE:ACHR further!
** Remember, nothing in trading no matter how Technical or Fundamental is ever 100% right every time. It takes a combined effort of both Technical and Fundamentals to paint a vivid picture of what a company or asset may be worth or doing. So do your due diligence in research!
Don't Ask What To Invest In, Ask Why Invest In It!!
Assets
Benefits of Trading Global Assets1. Diversification Across Geographies
One of the most significant advantages of trading global assets is the ability to diversify investments across multiple regions. Diversification is a core principle of risk management in finance; by spreading investments across different geographic markets, investors reduce the impact of country-specific economic shocks.
For example, an investor who holds assets only in the Indian stock market is vulnerable to domestic economic downturns, political instability, or sector-specific crises. By investing in the U.S., European, or Asian markets simultaneously, the investor spreads risk and potentially stabilizes returns. Geographic diversification ensures that poor performance in one market may be offset by stronger performance in another, thereby smoothing the overall portfolio volatility.
2. Exposure to Emerging Markets
Trading global assets allows investors to tap into emerging markets, which often offer higher growth potential than developed economies. Emerging economies such as India, Brazil, and Southeast Asian countries are characterized by rapid industrialization, growing middle-class populations, and increasing domestic consumption.
While investing in these markets involves higher risk due to political uncertainty, currency volatility, and regulatory fluctuations, it also presents the opportunity for substantial capital appreciation. Global asset trading platforms provide investors access to these markets, allowing them to balance high-growth prospects with their risk appetite.
3. Access to a Wider Range of Asset Classes
Global trading enables access to a much broader set of asset classes than would be available domestically. While domestic markets may limit investors to a few stocks, bonds, or commodities, international markets offer access to foreign equities, sovereign bonds, ETFs, REITs, commodities, and currency pairs.
For instance, commodities like crude oil, natural gas, and precious metals can be traded on international exchanges such as the New York Mercantile Exchange (NYMEX) or the London Metal Exchange (LME). Similarly, foreign exchange (forex) trading allows investors to speculate on currency movements, hedge international business exposures, or manage currency risks. This expanded universe of asset classes provides flexibility and strategic opportunities that are not achievable solely through domestic investment options.
4. Hedging Against Currency Risk
Investing globally introduces the element of currency risk, but it also provides an opportunity for effective hedging. Investors can take positions in foreign currencies to mitigate the adverse effects of domestic currency depreciation. For multinational corporations or investors with international cash flows, trading global assets is crucial for managing currency exposure.
For example, if an Indian investor holds U.S. assets, a weakening Indian Rupee against the U.S. Dollar will increase the value of returns when converted back to Rupees. Conversely, hedging strategies such as currency forwards, futures, or options can protect against unfavorable exchange rate movements. Therefore, global trading not only introduces new risks but also equips investors with tools to manage them strategically.
5. Enhanced Liquidity
Global markets offer a higher degree of liquidity compared to many domestic markets, particularly for major financial instruments. Markets like the New York Stock Exchange (NYSE), NASDAQ, and the London Stock Exchange (LSE) have substantial daily trading volumes, making it easier for investors to buy or sell assets without significantly impacting prices.
High liquidity benefits traders by reducing transaction costs, minimizing slippage, and allowing for timely execution of trades. Moreover, certain assets that are illiquid in one country may be highly liquid in another. For instance, while an Indian investor may find it challenging to trade a foreign tech stock locally, accessing it on its home exchange ensures efficient price discovery and ease of trading.
6. Opportunities for Arbitrage
Global asset trading creates avenues for arbitrage, where investors can exploit price discrepancies between markets. Arbitrage opportunities arise when the same asset is priced differently in two or more markets due to timing differences, local demand-supply factors, or currency fluctuations.
For example, a multinational investor may identify a situation where a company’s stock is undervalued in one market while being overpriced in another. By buying in the cheaper market and selling in the more expensive one, the investor can lock in risk-free profits. Arbitrage not only generates returns but also contributes to market efficiency by aligning prices across different exchanges.
7. Capitalizing on Global Economic Trends
Global asset trading allows investors to capitalize on macroeconomic trends beyond their domestic economy. For example, when the U.S. Federal Reserve adjusts interest rates, it can influence global bond yields, currency valuations, and stock market performance. Similarly, fluctuations in commodity prices, geopolitical events, or trade agreements affect international markets differently.
Investors with access to global assets can respond to these trends by reallocating capital strategically. For instance, a rise in crude oil prices may benefit oil-exporting countries’ stocks or energy sector ETFs. This ability to react to global economic shifts provides a competitive advantage over investors restricted to domestic markets.
8. Potential for Higher Returns
Investing globally can potentially enhance returns compared to domestic markets alone. While higher returns often come with higher risks, international markets offer unique growth opportunities not present domestically.
Developed markets, such as the U.S. and Japan, offer stable returns, dividend yields, and exposure to global corporations. Emerging markets, on the other hand, provide rapid growth potential driven by urbanization, technological adoption, and demographic shifts. By strategically allocating capital across these markets, investors can optimize risk-adjusted returns and achieve long-term wealth creation.
9. Risk Mitigation Through Time Zone Differences
Global markets operate across different time zones, which can be advantageous for investors and traders. For instance, price movements in Asian markets may provide early indications of trends that could affect European or U.S. markets. Traders can monitor these developments to make informed decisions, reduce overnight exposure, or implement preemptive hedging strategies.
Moreover, the staggered opening hours of global exchanges allow investors to respond to breaking news, earnings announcements, and geopolitical events promptly, reducing the impact of sudden domestic shocks. This temporal diversification is an often-overlooked benefit of global asset trading.
10. Learning and Strategic Advantage
Trading globally exposes investors to diverse financial markets, regulatory environments, and economic systems. This exposure fosters learning and strategic thinking, helping investors understand global interconnections and macroeconomic forces.
Institutional investors, for example, analyze currency policies, central bank interventions, and geopolitical risks to optimize portfolio allocation. Individual investors gain insights into international corporate governance standards, financial reporting practices, and market sentiment. This global perspective not only improves investment decision-making but also enhances one’s ability to navigate volatile or uncertain market conditions.
11. Technological Advancements and Access
The rise of online trading platforms, digital brokerages, and financial technology solutions has made trading global assets more accessible than ever. Investors no longer require physical presence in foreign markets; modern platforms provide real-time data, seamless execution, and multi-currency account management.
These technological advancements democratize global trading, enabling retail investors to participate in markets that were previously dominated by institutional players. Features like automated trading algorithms, mobile apps, and integrated research tools empower traders to implement sophisticated strategies with ease.
12. Portfolio Resilience During Domestic Downturns
Global asset trading can act as a shield during domestic economic downturns. For instance, during periods of political uncertainty, inflation spikes, or sector-specific crises, domestic equities may underperform. By holding international assets, investors can offset domestic losses, preserving capital and maintaining portfolio stability.
Additionally, exposure to counter-cyclical markets—economies that behave inversely to one’s home market—further strengthens portfolio resilience. For example, during a slowdown in the U.S. economy, emerging markets may continue growing, balancing the overall performance of a diversified global portfolio.
13. Participation in Global Innovation and Growth Sectors
Global trading allows investors to participate in innovation and growth sectors worldwide, including technology, healthcare, green energy, and biotechnology. Many pioneering companies are headquartered outside domestic borders, and investing in these companies provides exposure to global technological and industrial advancements.
For instance, early investors in U.S. technology giants or European renewable energy firms have benefited from rapid capital appreciation. Without global asset trading, access to such high-growth sectors would be significantly restricted, limiting wealth creation potential.
14. Strategic Tax and Regulatory Advantages
In some cases, global asset trading can offer strategic tax planning or regulatory advantages. Certain jurisdictions provide tax incentives, reduced capital gains taxes, or favorable dividend treatment for foreign investors. By understanding international regulations, investors can optimize after-tax returns.
Furthermore, diversified international holdings may allow investors to structure portfolios in a way that mitigates political or regulatory risks associated with domestic investments. Professional investors often leverage these advantages to maximize net returns while complying with global financial regulations.
Conclusion
Trading global assets provides investors with an array of benefits, ranging from diversification and risk management to enhanced growth opportunities and liquidity. Access to multiple markets, asset classes, and time zones enables investors to optimize portfolios, hedge against domestic and currency risks, and capitalize on global economic trends. While global trading introduces additional complexities—such as currency fluctuations, geopolitical risks, and regulatory differences—the potential rewards often outweigh the challenges.
As technology continues to advance and financial markets become more interconnected, the ability to trade global assets will increasingly become a cornerstone of modern investment strategies. For investors seeking long-term growth, resilience, and exposure to innovation, global asset trading offers unparalleled opportunities to navigate the dynamic and diverse landscape of international finance.

HERTZ (HTZ) SEES BULLISH MOVEMENT DESPITE TARIFFSHertz (HTZ) saw a bullish open this morning. Conversely many other assets saw a bearish open. Will Hertz continue this bullish movement, or could this be just a sell off that leads to a stronger downtrend?

BTCUSDTo the bitcoin lovers, investors and traders, this is my forecast on BTCUSD.
With all the news that are circulating about the crypto world, bad or good. Currently BTC is looking bearish. I will be looking for buy at the 71,671 level if BTC will find support.
Please tell us what you think. Is BTCUSD going down or up ?
PLUME (EXPERIMENTAL)$PLUME is a public blockchain optimized for the rapid adoption and demand-driven integration of real world assets (RWAs). We recognize that the core driver of the RWA revolution is tangible demand, particularly for yield-bearing assets that offer stability, transparency, and income generation.

DXY MELTDOWNThe enduring downward trajectory of the USD appears poised to persist in the coming years and even decades. With a staggering $33 trillion debt load that seems insurmountable, coupled with dwindling confidence from international partners who are divesting from the USD, the currency faces significant headwinds. The inevitable repatriation of these dollars to the Federal Reserve, the United States' central bank, exacerbates the downward pressure.
Forecasts indicate that the DXY, reflective of this trend, is likely to dip below $100 and remain there for an extended period. Our analysis underscores this outlook not only for the DXY but also for the USD's performance against other major currencies and assets.


Gold XAUUSD Bullish IdeaPrice is Already Trading Bullish on HTF.
On M15, CHoCH is Developing which will end Short Term Pull Back and Price will Resume Bullish.
Keep an Eye on M15 and M5 Structure Development.
Risk Disclaimer:
Forex is only Suitable for those People Who Understand the Financial and other Risks involved. Please Ensure You fully Understand the Risks and Carefully Consider your Financial Situation.


LANDSHARE HAS THE STRONGEST AND THE BEST POTENTIAL.This is my technical analysis for this great project called LANDSHARE where a real asset are tokenized specifically real estate.
The project offers an investment into the real estate " TOKENIZED ASSET " for only 50$ .
This project has a great potential to reach 600$ based on the technical analysis and on the other hand the fundamental analysis say it has the potential to reach 1000$ .
Also the crypto space may get involved in the real estate businesses where LANDSHARE will be the face of it.
The team behind LANDSHARE project are doing amazing things to improve the project and developing it in the right way.
Not financial advice.

How can traders make money on the asset tokenization trend?Asset tokenization is one of the most understandable applications for crypto technology. Various consulting and analytical companies estimate that the capitalization of tokenized assets will be around $3-4 billion by 2030.
Tokenized assets have no value and have no use without products that utilize these assets to create financial relationships and opportunities. Products that use tokenized assets in their operations are called Real World Assets (RWA). The essence of RWAs is to create a method for tokenization and a financial mechanism within the product that all participants will get value from.
How to make money?
Every RWA product has or will have its own native token. The project token will be the easiest way to earn. In fact, any trader knows how to trade tokens, so we will not give any recommendations, you already know everything very well.
We will highlight the most interesting projects, where tokens can give the most profit, so you don't have to spend much time searching and researching.
Top RWA narrative projects with a token
1. $CPOOl – loans to institutions
2. $GFI – RealFi lending protocol
3. $MPL – corporate lending protocol
4. $RBN – market maker lending
5. $TRU – lending protocol
6. $ONDO – U.S. Treasury bond trading
Top RWA narrative projects without a token
1. Backed Finance – derivative tokens of real world assets (S&P500, T-bills, TSLA, AAPL, etc.)
2. Carapace Finance – marketplace for crypto loan default risks
3. Florence Finance – European SME lending protocol
4. HomeCoin – mortgage secured lending
5. Jia – small and medium business lending in Africa and Asia
6. LandX – lending to farmers in exchange for a portion of their future harvest
7. Parcl – real estate trading around the world
8. Sapling – lending to banks in developing countries
What can you do now?
Add tokenized projects to the watchlist on TradingView and keep an eye out for trading opportunities
Keep up with news and changes in RWA and tokenization
Look for promising new projects
Read our idea about ZK Narrative
Check links below and start trading with us
Thanks for reading! Waiting for your comments about RWA projects

The Best Time to Buy an AssetThe passing of time often creates one of two things. It can create Wealth or it can create Regret.
For instance…
Many people will say, I wish I bought real estate, crypto, stocks, etc. at certain times…then I’d be rich. We are all pretty good at looking backward and saying, “What if?”.
With Investing, the two most common reasons people miss opportunities are because they aren’t paying attention or aren’t prepared…and usually, it’s both. The best thing to do is:
📌 Get Educated with proper knowledge
📌 Analyze different factors and Research on them
📌 Create a plan/strategy and start working on it

GDP is Bad and You Should Feel BadThe GDP number of 2.7% growth is being propped up by net exports, while consumption is at a cycle low. This is horrible for earnings expectations and risk assets. Net exports were at a low in prior quarters, making the economy look worse off than it was. Now the economy is actually worse off than it is and the metric is instead making it look better. This is why the NBER doesn't use "two quarters of negative GDP" to date recessions. There are too many false signals.
Don't fall for the GDP meme. The pain is coming.

Silver & Gold. Long? Short?Remain neutral/bearish on gold & silver until the US10Y, DXY, & Fed Funds Rates tops.
This is the first time since the de-pegging of USD/Gold (in 1975) that interest rates & the USD have been rising.
This creates an extremely tough environment for gold & silver to significantly rally being under pressure from high dollar & rising interest rates.
Despite strong headwinds, there are many tailwinds as well that will lead many commodities prices higher such as, the clean transition, & the dollar (usd) devaluing.
Chart:
FED FUNDS Rate = Blue Line

‘Max Pain’ Bitcoin Faces $9,100Since the asset has maintained its position of over $18,000, it has fallen by more than 6% over the last week. When Bitcoin reached a peak of $20,071 on Sunday, the bears firmly rejected the recent gain.
The Federal Reserve's aggressive rate hike campaign worsened the previous decline. Since then, BTC has fallen precipitously, but it is still firmly above the $18.5k support level. At the time of reporting, the asset's price was $18,719, a decrease of 5.25% from the previous week.
A well-known Bitcoin analyst believes that Bitcoin (BTC) has not yet touched the bottom because he predicts a drop to $9,100.

BTC BEARISH UPDATE TODAYThe bearish mood is perhaps understandable — the Ethereum Merge became a “sell the news” event, and along with macro triggers contributed to a fresh risk asset flight.
Now, analysts are considering the chances of the downtrend staying in place at least until the Fed rate announcement passes.
“BTC has chopped through the weekend, but there's always the potential for some volatility before the close The past week has seen tailwinds stack up for Bitcoin, leading to BTC price action falling in kind.
BTC/USD lost over $2,000 in a single weekly candle, closing below $20,000 in what is the lowest such close since July, data from MY Youtube channel and trading view shows.
Following the lowest weekly closing since July, Bitcoin (BTC) is facing yet another week of "big" macro announcements.
Following days of losses in the wake of the most recent inflation data from the United States, BTC/USD has failed to recover, much like other altcoins and risk assets more broadly.
The biggest cryptocurrency has yet to convert $20,000 to a solid support, and as the third week of September gets underway, there's a risk that it might do so once more.
LIKE COMMENT AND SHARE FOR MORE, GOOD LUCK.

JPMorgan bullish scenario:The technical figure Channel Down can be found in the daily chart in the US company JPMorgan Chase & Co. (JPM). JPMorgan Chase & Co. is an American multinational investment bank and financial services holding company. As of 2022, JPMorgan Chase is the largest bank in the United States, the world's largest bank by market capitalization, and the fifth largest bank in the world in terms of total assets, with total assets of US$3.954 trillion. Additionally, JPMorgan Chase is ranked 24th on the Fortune 500 list of the largest United States corporations by total revenue. The Channel Down has broken through the resistance line on 13/08/2022, if the price holds above this level, you can have a possible bullish price movement with a forecast for the next 31 days towards 131.18 USD. Your stop-loss order, according to experts, should be placed at 106.09 USD if you decide to enter this position.
JPMorgan has wrapped up the acquisition of Global Shares, a fintech firm. The financial terms of the transaction, announced this March, haven’t been disclosed.
Ireland-based Global Shares, through its cloud-based platform, helps businesses manage employee stock plans. The firm, through its offices across Europe, the Middle East & Africa, North America and the Asia Pacific, has 650 corporate clients and roughly $200 billion in assets under administration.
Global Shares will be integrated into JPMorgan’s Asset & Wealth Management (AWM) segment. The firm will continue to be based out of its current location.
Now, with the addition of Global Shares, JPM will become of the major providers of state-of-the-art “employee ownership solutions to private and public companies” across the globe.
Risk Disclosure: Trading Foreign Exchange (Forex) and Contracts of Difference (CFD's) carries a high level of risk. By registering and signing up, any client affirms their understanding of their own personal accountability for all transactions performed within their account and recognizes the risks associated with trading on such markets and on such sites. Furthermore, one understands that the company carries zero influence over transactions, markets, and trading signals, therefore, cannot be held liable nor guarantee any profits or losses.

BITCOIN It's still time. If you aren't in this play. I don't know what you're waiting for. Tell me what you do.
Get a move on let's go!!!

US2Y Treasury Yield vs Gold The correlation between the 2Y & gold indicates that when the US2Y peaks, there is a US recession & gold rallies to new highs subsequently after.
** 1 = Peak in US2Y ( 1989 ) did not see a rally in gold because gold was depegged from the USD in the mid 1970's.
2 = Peak in US2Y ( 2000 ) saw a massive rally in gold as investors look for a safe haven from the incoming recession.
3 = Peak in US2Y ( 2007 ) saw a massive rally in gold as investors look for a safe haven from the incoming recession.
4 = Peak in US2Y ( 2020 ) saw a massive rally in gold as investors look for a safe haven from the incoming recession.
Speculation
5? = Do we see a continuation of the opposite correlation between the US2Y & Gold when the US2Y peaks?
I believe so. However, I see two scenarios for gold if & when the US2Y peaks.
Scenario #1: Gold rallies to new highs after the peak in yields
Scenario #2 ( Base Case ): After peak in US2Y, Gold rallies to tests previous high & fails to make new highs.

BTC + SPX Trade IdeaThis is a medium term swing/position trade that has a pretty good chance to play out. Check out this fib idea below which underscores the idea. Obviously, don't panic buy unless you like riskier trades. Ease into your entry! June thru October looks like a decent entry if nothing too crazy happens, but a surprise via some global disaster could RUIN this trade. Sellers are willing to accept lower prices for this past year, that's basically what the log returns is telling us as it's below 0. In other words, risk has not paid off in a while on this scale. Risk-averse HAS paid off. This is a contrarian trade. The crowd is now ultra bearish and this presents an opportunity of price discovery. Wait for them to come to you, don't panic and go to them.
The wholesale price range is defined by the region of prices where most trades were made AND the result of those trades is highly random. The bottom and tops of this wholesale zone represent the golden ratio 0.618. Remember, the absolute value of the inverse of 0.618 is 0.382. Both of these fib levels are identical, one level represents sells and the other represents buys. In other words, we don't define where 0 or 1 is. We draw the golden ratio area of the fib box around the wholesale range, then we get the definition of 0 and 1.
Be aware though, that if you do this same analysis but with Log Returns on a 2 Year timeframe instead of 1 Year, we could still be in a distribution zone. Don't put all your apples in this basket. Be diligent about your position:
This gives us quite a startling conclusion. The rally of Dec 2018 was simply a bear market rally on a 2 Year scale. We could be in the very SAME situation now. Lower highs on the indicator, then lower lows. So even though it LOOKS like a decent buy on the 1 Year timeframe, we should NOT assume it's going to the moon if the price reaches our target (red crosshair) unless there is some drastic shift in monetary/fiscal policy which would cause a new cycle to suddenly appear.
What do you think about all this craziness?
I hope you liked the idea, and good luck. Don't forget to hedge your bets! :)

Easy chart to explain Asset pricesJust a combination of a couple old charts, but I wanted to make clear why assets are rising post 2008. There seems to be a direct correlation and causal relationship in FED ownership of assets as a percentage of M2 and asset prices when adjusted for M2. Lots of other charts seem to imply this by charting other things but this one shows the actual thing side by side. Perhaps the identical slope of the trend is coincidental even though the relationship is direct, it is awfully interesting though. Interpret it as you wish.
In teal: M2 adjusted SPX adjusted to overlay the symbol below.
In yellow: WALCL as a percentage of M2.
Good luck and don't forget to hedge your bets :)

Bags $4M FundItheum announced investments from Elrond, Mechanism Capital, and other crucial investors; raising their funds from $11.5M to $14M. The initial $11.5M came from an earlier round funded by Morningstar Ventures, incubating Itheum via their Elrond Dubai Incubator.
The additional investments included Elrond Foundation, Mechanism Capital, Woodstock, Ascensive Assets, Skynet EGLD Capital, MHC Digital Finance, ZBS Capital, and Spark Digital Finance.
Itheum’s Founder Mark Paul commented on the recent eventful months of Itheum.

SAK Assets DAY 2The project is a Reverse Engineering of the indicators that most of ETF systems use, including the world's largest investment fund "BlackRock" which controls 8 Trillions dollars.
What if you can make 10% of your capital every day ?
👉 After 90 days/operations the 1000 dollars can reach 4,8 Million dollars :)
