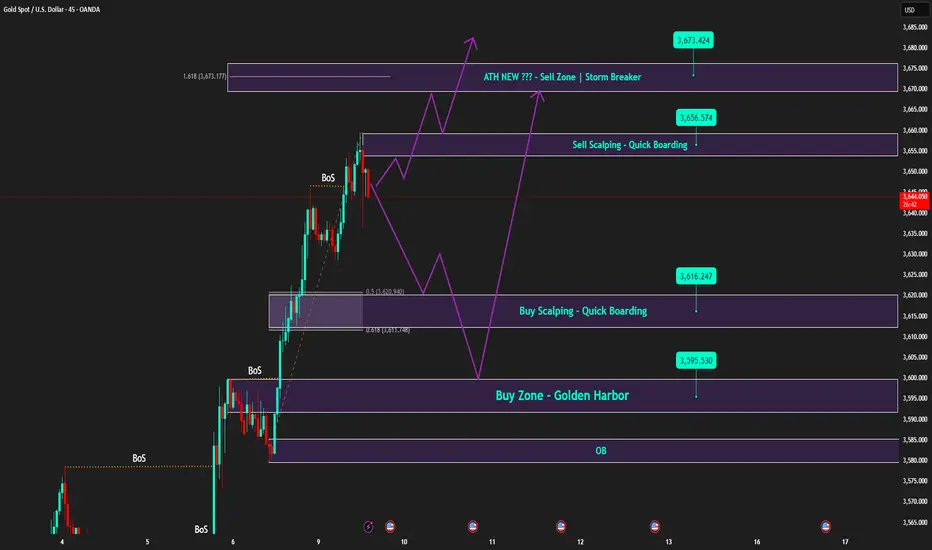
Gold 09/09 - Waiting for a pullback to Buy safely| New ATH ahead🔎 Captain’s Log – News Context
FED : The probability of a September rate cut is now almost certain, reinforcing confidence that flows will continue moving into Gold.
Dollar : Dropped to a 7-week low due to FED rate cut expectations, adding further support for Gold.
US Economic Data : No major news today, the market focus remains on interest rates.
⏩ Captain’s Summary: Gold remains in a strong uptrend. However, Vincent advises waiting for a pullback into support to Buy safely , avoiding chasing price at higher levels.
📈 Captain’s Chart – Technical Analysis
Storm Breaker (Resistance / Sell Zone) :
Quick Boarding: 3654 – 3656 (Short-term Sell scalp)
Storm Breaker Peak: 3673 – 3675 (Sell zone – potential new ATH)
Golden Harbor (Support / Buy Zone) :
Buy Scalp Dock: 3615 – 3617
Main Golden Harbor: 3597 – 3599 (Strong support)
Price structure remains bullish after multiple BOS – Break of Structure. Current highs may trigger short-term profit-taking waves before Gold pulls back to Golden Harbor and then rallies toward ATH 367x .
🎯 Captain’s Map – Trade Scenarios
✅ Golden Harbor (BUY – Priority with trend)
Buy Scalp: 3615 – 3617 | SL: 3598 | TP: 3620 → 3623 → 3626 → 3630 → 36xx
Main Buy Zone: 3597 – 3599 | SL: 3589 | TP: 3660 → 3663 → 3666 → 3670 → 36xx
⚡ Quick Boarding (SELL Scalp – Only at resistance)
Sell Zone 1: 3654 – 3656 | SL: 3662 | TP: 3650 → 3647 → 3644 → 3640 → 36xx
Sell Zone 2 – Storm Breaker Peak (ATH test): 3673 – 3675 | SL: 3682 | TP: 3670 → 3667 → 3664 → 3660 → 36xx
⚓ Captain’s Note
“The interest rate winds from the FED continue to power the Golden sails. Golden Harbor 🏝️ (3597 – 3599) is the safe haven for sailors trusting the bullish tide. Quick Boarding 🚤 (3615 – 3617) is just a short ride before the voyage resumes. Storm Breaker 🌊 (3654 – 3675) may bring big waves, but it’s only suitable for technical scalps – as the main current still carries Gold toward new highs.”
ATH
All Time High, again?!Gold Keeps Climbing & Traders Keep Selling🚀Gold printed a new all-time high. Last Friday, now Monday and today.
You sell. You lose.
The minute it pulls back, you try again.
Same story on repeat.
Thousands of beginner traders are caught in this loop right now.
Sell → Stop Loss → Frustration → Sell again because now for sure it will reverse, because it has to... wake up and stop this loop.
I. The Mental Bias – Why ATHs Trigger Dumb Decisions
The human brain hates “expensive”.
Expensive feels wrong to buy, so you try to sell it, forgetting that expensive can get even higher in price. We are wired to hunt bargains, not pay premiums, but Gold at ATH doesn’t follow shopping logic.
“I missed the buy, so I’ll catch the drop” is Ego trading, not strategy.
People confuse exhaustion candles with reversals.
ATHs are not automatic sell signals; they are liquidity traps.
Your brain wants to be right, not profitable.
II. Why GOLD is Different – It Doesn’t Behave Like Forex Pairs
Gold = Safe Haven.
It attracts massive capital in global political & economic uncertainty.
When XAUUSD breaks ATH, it often does so to induce sellers, not reverse.
It will breathe, drop 100 pips, trap more shorts, and rally again.
This is by design, due to the fact that the market runs on pain and liquidity.
III. So What Should You Actually Do?
• Stop shorting just because it’s “too high”. Learn to wait or buy pullbacks.
• Don’t trade out of regret. Trade from a solid plan.
• Use bias on different time frames from high to low, structural zones and key levels.
• Align with HTF bias. Intraday trades should flow with the structure.
• Gold gives pullbacks, if you miss them, wait, don’t chase reversals until the fire in price action settles with solid confirmations.
🌟Conclusion to follow:
It’s not Gold that destroys accounts, but panic, ego, lack of patience and the absence of structure.
XAUUSD isn’t your enemy, but as always your emotions are. Until you learn to keep them in check, trade less and ….
Survive ATH season by following the structure and leave moods & fake hopes out of the market.
If this article helped you today and brought you more clarity:
Drop a 🚀 and follow us✅ for more trading ideas and trading psychology. Thank you.

IS THERE ANY CHANCE OF ATH ..???Do you think that this shit coin will ever touch ATH .
from 1.6 to 0.04 wasted...

XAUUSD Long- Fri, Sep 5, 2025I did open a long position on Gold yesterday hoping to get close to the ATH. Luckily it did and gave me a 1:4 rr. I guess this is it for gold so far and it is going to drop a bit for the foreseeable future.
what do you think??
-Moz
#XAUUSD #long #ATH

XAUUSD Liquidity Addiction: Why Your Brain Wants to Get Swept
💫There’s a cruel irony in trading: the cleaner a level looks, the more dangerous it usually is. ATHs, equal highs, perfect lows, and round numbers shine like neon signs saying “enter here.” And your brain, wired for safety and clarity, feels drawn to them like a moth to light. The problem? In SMC, those are not safe zones. They’re bait.
1. The Brain Craves Clarity
The human mind hates uncertainty. When a chart looks messy, hesitation dominates. But on the show of perfect symmetry, you relax because you see something clear. That relaxation is a dopamine hit, and you get addicted to it. But in the markets, the very thing that calms you down is what sets you up.
2. Trap in Action
You’ve seen it before. Price builds a flawless high, traders lean in heavy with sells, certain it can’t go higher — and then Gold rips into new ATHs. The sweep takes them out in minutes. What hurts most isn’t the loss itself, it’s the betrayal. You were so sure and felt safe. And that’s the point: the moment of peak confidence is the moment of maximum exposure.
3. Psychological Addiction
This cycle is repetitive for your brain, giving it a fake feeling of safety. Every “almost win,” every daily plan that looked perfect, every friend who caught that one clean breakout — it all trains you to crave the next hit of certainty. You’re not hooked on trading itself but on the illusion of control. The market doesn’t have to be smarter than you. It just has to let your brain do the 'work', then they take a piece of your account with your SL being hit.
📋 Takeaways
1. Spot the bait, don’t buy/sell it → If it looks too perfect, don’t ask “what am I benefiting?” but ask “WHO’s benefiting from this?”
2. Don’t trade the sweep itself → Wait for the reaction & confirmation after liquidity is taken.
3. Flip the perspective → Ask where the trap is being set, not where the bait is shining.
4. Patience is a position → Sweeps only work because traders can’t sit still.
🔑Liquidity does not hunt you. It waits for you to walk in. The moment you stop chasing certainty and start chasing context — structure, reactions, and intent — the game changes.
The 'traps' and 'baits' are in plain sight, so they cannot fool you so often.
If this article helped you today and brought you more clarity:
Drop a 🚀 and follow us✅ for more trading ideas and trading psychology. Thank you.

XAUUSD BreakoutAfter a strong rally up since the beginning of the year, Spot Gold struggled to breakthrough $3,425 for the last 129 days. However, since the beginning of the week Gold broke through that level surging +4.3%.
Seeing Gold continue to rally alongside the stock market, both of which at all time highs despite typically having an inverse relationship.
With M2 money supply ever growing, rate cuts continuing and acceptance of higher levels of inflation there is plenty of fuel to keep this move going no matter how unnatural it feels. Gold typically thrives in risk-off environments but this year has seen huge progress.
Now Gold has entered price discovery it's about riding the wave of momentum caused by the breakout. Should Gold turn around and get back below $3,425 there is potential for worry, a SFP confirmation is bearish. A retest of $3,425 as support with bullish continuation is a more comfortable hold.

Ethereum 4H Range As we approach nearly a month in the range from $4000-4800 it looks like ETH is making a move once again.
Previously once hitting $4800 price gradually sold off back towards range low creating a bearish trendline, once the price broken above that level a rapid move up to range high within two candles.
Now looking at the chart we have a similar setup, strong breakout from the bearish trendline up into midpoint. Bitcoin currently retesting a key level of $112,000, should BTC flip this level I could see alts getting the greenlight to move up and Ethereum up to the highs.
Should BTC reject from $112,000 it makes sense that ETH range midpoint would be strong resistance, rejection could lead to a range low retest. Anything else that isn't either range high, range low or midpoint is noise and for me no action required, no need to over complicate it.

Ethereum - Eyes 5,600–5,800 After Holding Strong Near HighsEthereum (ETHUSD) remains in a clear uptrend, consolidating just beneath its all-time highs. After printing a record high in recent weeks, ETH has shown strength by holding its gains—a typical behavior in a trending market.
🔍 Technical Breakdown:
Trend: Bullish structure intact with higher-highs and higher-lows.
Price Action: ETH is coiling within a key resistance zone (4800–5000)—often a precursor to a breakout.
Momentum: One of the top-performing assets since the April 7 market low.
📈 Targets:
Short-term: 5,600–5,800 zone is the next potential target if the breakout materializes.
Medium-term: Eyes on 7,000, with an extended move to 8,000 still on the table if momentum accelerates.
⚠️ Macro Perspective:
As price moves higher, sentiment and targets naturally expand, fueling further speculative momentum. Caution is warranted—bull markets can persist longer than expected, but parabolic moves often end abruptly.

XAU/USD | Gold Breaks $3500 – New ATH Hit! What’s Next?By analyzing the gold chart on the 12-hour timeframe, we can see that today, gold finally managed to print a new All-Time High (ATH)! As anticipated, price broke above $3500 and rallied up to $3508, hitting our previous bullish target and sweeping the liquidity resting above the key $3500 level.
After reaching $3508, gold entered a correction phase, dropping to $3470, but quickly bounced back and climbed to $3494. At the time of writing, gold is trading around $3478, showing a bearish reaction — but it's best to wait and see whether price gets rejected again from this level or not.
If gold is to undergo a deeper correction, the next potential downside targets are $3465, $3454, and $3420. This analysis will be updated — stay tuned for more confirmations from the market!
MY LATEST ANALYSIS :

$GOLD ATH $BTC Following By 10 WeeksFor all those celebrating TVC:GOLD 's historic 1% move back to ATH, remember it generally leads CRYPTOCAP:BTC by 10-12 Weeks, just like global liquidity and DXY (inverted).
And remember who shared this with you first 🤓

BNB go to ATHBNB is in good shape and if the next candle closes on the 4-hour timeframe, the probability of a ATH is very high.
Be profitable

This is what Bitcoin Dominance Index indicates about the market The Bitcoin Market Dominance Index (often called BTC Dominance) is a metric that shows how much of the entire cryptocurrency market's total market capitalization is made up by Bitcoin alone. In simple terms,
When BTC dominance rises, altcoins may underperform, and traders may rotate into BTC or stablecoins.
When BTC dominance starts falling, it could indicate the start of an altcoin rally
The chart snapshot shows BTC.D from 2018 to current date, with key indications marked for the 2018 - 2021 Bull Run and the current Bull Run. As observed, BTC reached its ATH (red vertical line : Nov 08, 2021) 1064 days since the start of the 2018 - 2021 Bull Run. Another such indication is that during the past cycles BTC has reached its ATH roughly around 201 to 250 days from its immediate halving date. When these two indications are correlated to the current cycle, BTC should top this cycle within the range of mid-September to end October (range indicated within the two vertical red lines)
Another key indication is the falling of BTC.D, marking the start of the Altcoin season. During the previous cycle, BTC.D went sideways during early 2021 before dropping from ~60% to ~39% within a period of 6 weeks. Similar consolidation can be observed in the current cycle before BTC.D starts to drop from ~60% at the beginning of August 2025. This is a strong indication that we are currently running through the midway of the Altseason.
At the time of writing CRYPTOCAP:BTC.D is at 58.55% after reaching a 7-month low of 57.69% after achieving its cycle high of 66.03%. This is a strong indication that Alts domination will continue for the rest of the season until the end of October or probably extended till the year end. Also, since the start of the current Bull Run, this is the first time the 14-day RSI has dropped below its 14-day smoothing SMA further proving the trend reversal.
There are some considerations where the above indications extracted from previous cycle behaviors can be challenged. The investor sentiment is very different compared to previous cycles with institutional adoption of crypto and exposure of BTC and ETH through ETFs allowing ordinary investors to flock into crypto. Also, the current macro-economic conditions and regulatory framework have a significant effect on the market behavior.
These factors might result in BTC.D to not to drop to the levels they dropped in the previous cycle at this stage (varying in between 39% to 46%). So, we might see a replication of drop in value of BTC.D similar to previous cycle but under a different scale.

Uh Oh... False Breakouts on both Bitcoin and EthereumWith the close of last week's candlestick COINBASE:ETHUSD failed to sustain its new All Time High (ATH). Last week's price action was interesting because the prior major high at 4070 was solidly broken, retested, and price moved on to make a new ATH.
This price action follows Bitcoin COINBASE:BTCUSD last week which also had the same phenomenon; a new ATH that was quickly rejected.
There is no more reliable sign of a bearish pullback about to occur than a false breakout. In order for new ATH to be sustained traders and investors must keep buying. If they do not... WATCH OUT!
Prior history of the event can be consulted to see just how reliable it can be:
January 2025 Bitcoin
March 2024 Bitcoin
And of course November 2021... the start of the last bear cycle in Bitcoin.
Trade wisely!
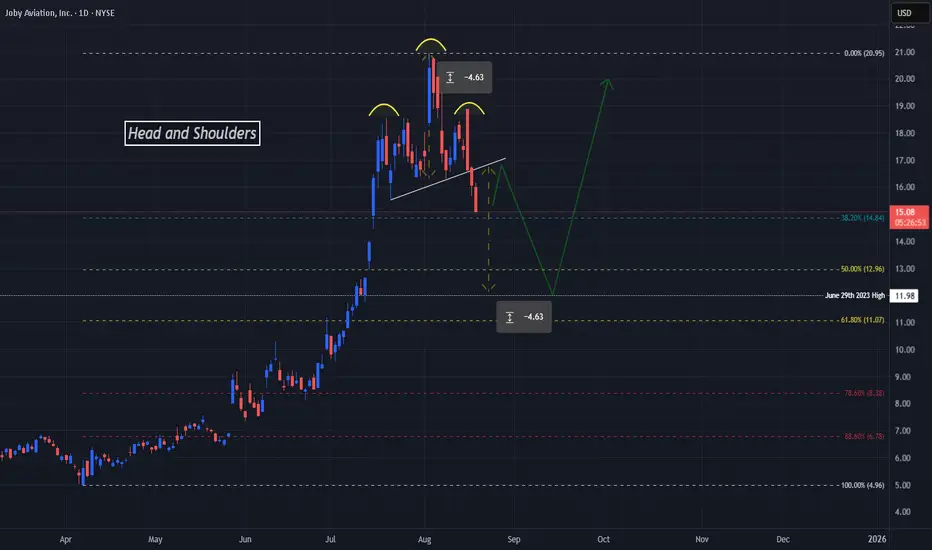
Reversal At New ATH Points To Next Potential Takeoff For JOBYNYSE:JOBY has been making impressive steps lately with reports coming out Friday, August 15th that the company has achieved a great milestone in being the first to fly a piloted electric vertical takeoff and landing air taxi or eVTOL from one public airport being Marina (OAR) to Monterey (MRY).
www.tradingview.com
To end last week and start this week we see price on NYSE:JOBY plummeting and this decline has confirmed a very strong reversal pattern, the Head and Shoulders!
Now, Price has made a solid breakout of the Neckline or Support of the Pattern so we can suspect a potential pullback to the Neckline for a Retest before moving down further in the coming days.
Based off the Potential Extension of a Confirmed Breakout and Validated Retest of a Head and Shoulders Pattern, we can suspect that Price will fall the same length as from the Head to the Neckline, being approx. $4.63, which would land Price not only right in the middle of the Fibonacci Golden Ratio Zone but also a Previous High from June of 2023 @ $11.98! --> This will be the next Buy Opportunity!
With NYSE:JOBY expanding by purchasing Blade Air Mobility who operated in lounges and terminals in the US and Europe and plans to deploy commercially in 2026, this could be a great stock to stock up on!
www.tradingview.com
18/08/25 Weekly OutlookLast weeks high: $124,475.68
Last weeks low: $116,828.03
Midpoint: $120,651.85
Another new ATH for BTC but are there signs of weakness beginning to show?
Last week Bitcoin hit a new ATH just shy of $124,500, a remarkable achievement but the reaction from that level to me is not a good one. Using the RSI indicator it is clear that on the daily time frame both the July top and now the most recent top form a bearish divergence. Higher time frame bearish divergences are strong trend reversal indicators. On the hour timeframe both tops also formed a local bearish divergence, to me this is a double sign of an exhausted rally.
This is not to say the end of the cycle is here by no means, what it does suggest is that the bulls are tired and a correction could be round the corner. From here I think logically the $111,000 & $108,000 levels could provide support this week on any pullback continuation. From a macro perspective we still have rate cuts to come next month, An ever growing M2 Global Money Supply to feed the market and a hungry institutional investor race to acquire digital assets. All this points towards the bullaun continuing but In my opinion after a cooling off period, after all August and September are famously bad months for BTC for returns.
Ethereum on the other hand continues to impress this a record $2.85B ETF net Inflows. $3.75B net inflows for digital assets as a whole. No break of ATH as yet but the momentum is certainly there. BTC will need to stand strong for ETH to push past $4,800.
This week I'm keeping a close eye on how BTC reacts to any pullbacks, judging market order flow to see if this is a shallow pullback or maybe a prolonged one that results in a rangebound environment.
FED chair Powell does speak this week so possible volatility should he announce anything significant.
Good luck this week everybody!

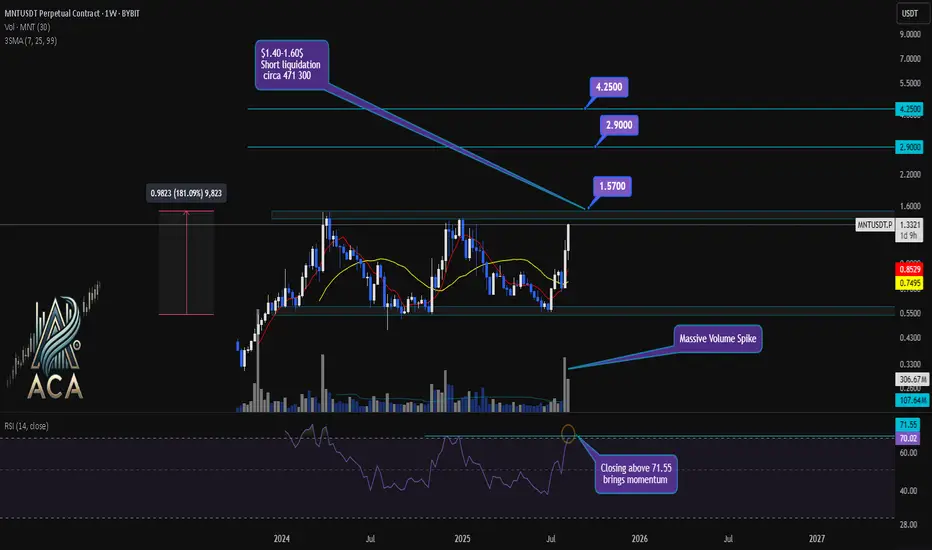
MNTUSDT Weekly Chart Analysis | Momentum & Key Targets UnveiledMNTUSDT Weekly Chart Analysis | Momentum & Key Targets Unveiled
🔍 Let’s dive into MNTUSDT perpetual contracts and decode the current price action, focusing on order flow, volume, liquidations, and momentum for top trading setups.
⏳ Weekly Overview
The weekly chart shows MNTUSDT surging out of a prolonged consolidation box, supported by a massive volume spike. This breakout is adding significant bullish momentum, as the RSI closes above the 71.55 level — a classic signal for trend acceleration and institutional interest.
🔺 Key Bullish Setup:
- Consolidation Box Break: Closing above the $1.57 level marks a safe entry; the order book above is lighter, giving price more freedom to move.
- Short Liquidation Cluster: Between $1.40-$1.60, nearly 471,300 MNT shorts are set for liquidation. Once price pushes through, liquidity fuel could trigger rapid upside.
- Upside Targets: Next objectives are $2.90 (approx. 90% up) and $4.25 (approx. 180% from the breakout), perfectly aligning with RR1 projections out of consolidation.
- Volume & Momentum: A massive volume influx supports the move, and RSI bolting past 71.55 on weeklies brings undeniable momentum.
📊 Order Flow & Futures Netflow:
- CoinGlass Futures Netflow: Recent statistics point to a healthy net inflow for MNT after a period of outflows, reflecting renewed market interest and capital rotation into longs.
- Market Cap: $4.50B, cementing its presence among high-liquidity altcoins.
🚨 Conclusion:
Breaking the current consolidation box, backed by a huge volume spike and overbought weekly RSI, signals powerful momentum. The $1.57 level offers a low-risk entry, and clearing short liquidation pockets between $1.40-$1.60 could send MNT to $2.90 and $4.25 in quick succession. Order book dynamics favor further upside, especially as resistance thins above $1.57.
Stay sharp, watch volume and RSI, and monitor liquidations for confirmation of the bullish continuation.
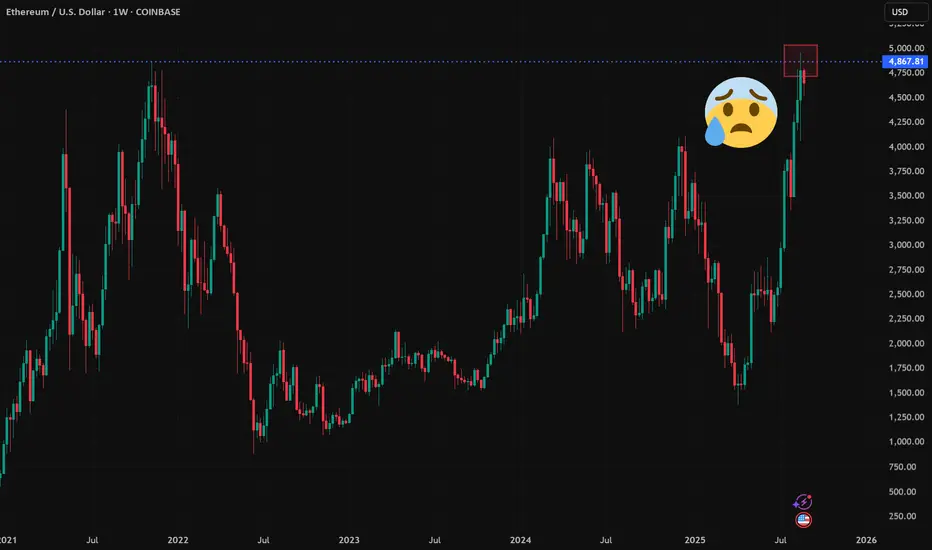
ATH FOR Ethereum!!!Hello friends🙌
As you know, Ethereum has been on an upward trend these days and we can say that buyers have entered, but not completely...👀
🔊Now, considering the resistance that Ethereum is facing, namely the number 3900 to 4100, we need to see what reaction the price will see this time when the price reaches this resistance for the 4th time?
✔We will most likely make a small correction and this time this major resistance will be broken again and we will witness a higher ceiling.
✔Otherwise, I have an important and key support that we have identified for you and if the price drops, this support is a good area to buy again.
And finally, observe risk and capital management⚠
🔥Follow us for more signals🔥
*Trade safely with us*

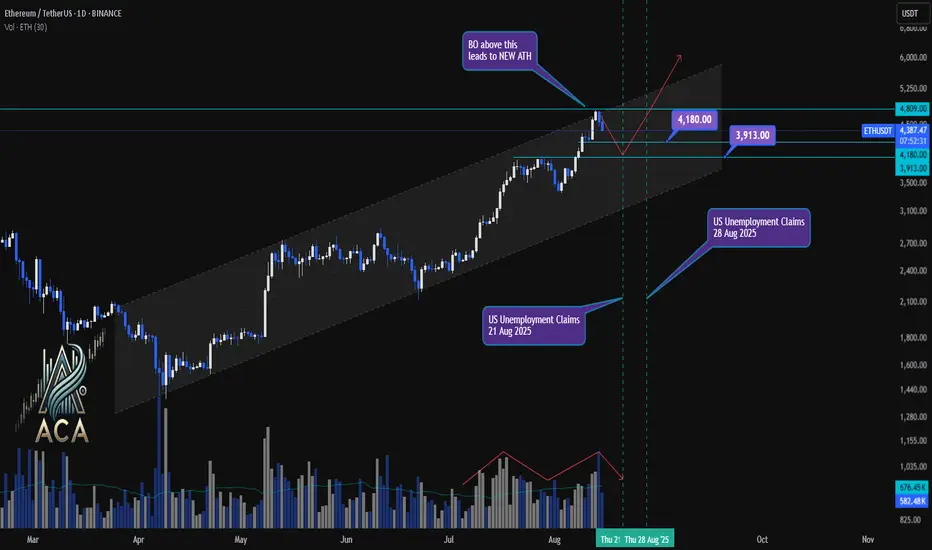
ETHUSDT 1D Chart Update | Channel Structure, Economic EventsETHUSDT 1D Chart Update | Channel Structure, Economic Events & ATH in Focus
🔍 Here’s the latest breakdown of ETH/USDT price action on the daily chart—channel dynamics, correction levels, and upcoming catalysts.
⏳ Daily Overview
Ethereum is trending strongly within an ascending channel, respecting both mid-level and upper resistance. After a local correction, price is rebounding with sturdy volume participation—signaling renewed interest from buyers.
📉 Correction Levels & Volume
- Recent correction found support at the $3,913 zone, with the $4,180 mark now acting as next key level.
- Volume has picked up on bullish candles, confirming the strength of this bounce.
- Correction appears healthy: price stayed within the channel, higher lows maintained.
📊 Channel, Economic Events & Breakout Setup
- ETH continues trading inside the established channel, posting higher highs and higher lows.
- Two major US economic events ahead—Unemployment Claims releases on Aug 21 and Aug 28, 2025—that could trigger volatility.
- Watch for a breakout (BO) above $4,809: crossing this sets the stage for a new all-time high (ATH).
🎯 Key Levels & Scenario
- $3,913: Correction support zone; ideal spot for high RR (risk/reward) long entries if retested.
- $4,180: Immediate resistance; flipping this could attract trend-following bulls.
- $4,809: Channel top and major breakout threshold. If price closes above, expect acceleration toward new ATH territory.
🚨 Conclusion:
ETH is pushing firmly inside its channel, with correction and volume patterns favoring bullish continuation. Key economic events may provide the volatility needed for a breakout move. Above $4,809, watch for new ATHs; dips to $3,913–$4,180 offer attractive re-entry zones for aggressive traders. Stay adaptive as August catalysts unfold.
ETH Elliot Wave to Smash the BIG 5k ATHmarked out some precise Elliot Wave levels on ETH:
recently closed W3 at 4788, which gives a W4 targets 4343.56 and 4167
leading to W5 breaking the big 5k mark with targets 5081.20 or 5171.78 (with deeper pullback in W4).
this gives a nice short opportunity entering just below the HTF supply zone at 4618.92 (divergence suggests another small bounce)
followed by an epic long to new ATH entering at 4313.56 (and 4167 on a deeper W4) with TPs at 4899 and 5081

ETHUSD declines after reaching ATHETHUSD declines after reaching ATH
ETHUSD declined after reaching the ATH at 4,800.00. In our recent report we wrote that the asset is forming the divergence on the RSI. It worked out pretty well. Fundamenntally, we have 2 big news, same as for the BTCUSD. U.S. Treasury Secretary Scott Bessent announced that the government won’t add more Bitcoin to its strategic reserves. This tgriggered not only the bitcoin, but other crypto coins as well. The latest U.S. Producer Price Index (PPI) data also came in weak, with the core PPI rising 3.7% year-over-year, exceeding the anticipated 2.9%. This suggests tariffs are working as planned and could lead to higher inflation in the near future.
Technically, the price stays below the SMA50 on hourly timeframe, the asset looks to overbought, considering such news, so the correction is expected with final target of 4,000.00.

ETH about to hit All Time High! And now? Now what? Are we going to see a new ATH?
What are your ideas. According to the Fib analysis I made a few days ago, it can go up to 17k USD.
Do we need to wait another cycle for that? What are your thoughts?

13.08 2025 TARGET DONEAs I was typing yesterday about my target for the BTC price I don't have to wait long for it and the price make it happen very quick and now we have a clear pattern, so are now is time to short this market?. After yesterday I see a big potential for the price to go lower but also we can go higher because we have fuel to go higher.

ETHUSD is nearby ATHETHUSD is nearby ATH
ETHUSD has been growing since August 3, without any visible correction. Since that time the asset gained 39.38%. However, currently ETHUSD is experiencing bearish divergence on 1-h timeframe, although the price is nearby its ATH. Highly likely that the price will start a decline in nearest hours with the final target of 4,350.00. The possible breakdown of an EMA20 here is a supportive factor for a downward correction.
