Gold (GC1!) Forecast: The Squeeze & Release Path via DSRTL MatriCategory: Trend Analysis / Chart Patterns
Symbol: GC1! (Gold Futures)
In this analysis, we use the DSRTL-ML (Dynamic Support & Resistance) engine to map the current structural context for Gold. The indicator is tagging the state as “TESTING RES – Bias: Neutral”, highlighting a consolidation phase right underneath a major resistance band. Structurally, this is a spot where static friction meets dynamic momentum.
1. The Current Structure: Compression Phase
The Matrix currently sits at S2 | D3 (Te
Auxusd
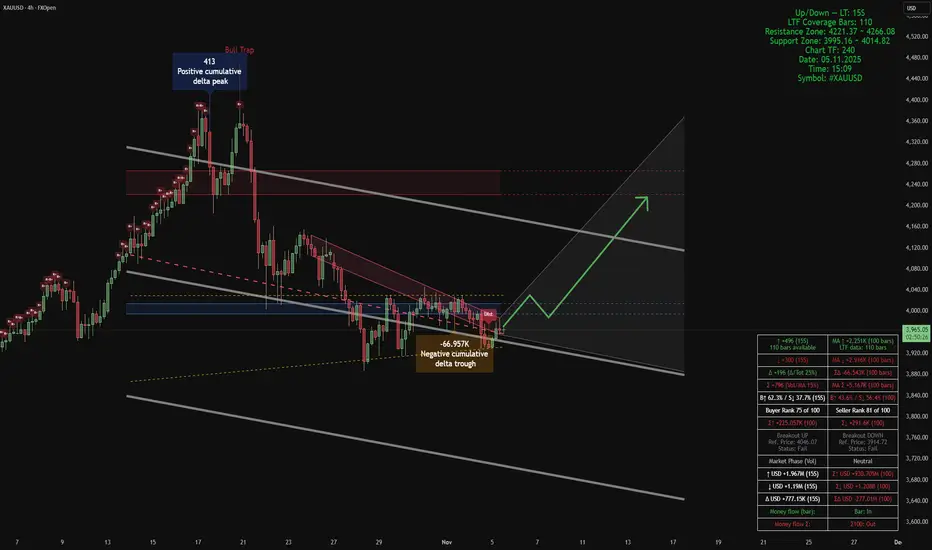
Chart Analysis (XAUUSD, 4H), Smart Volume–Structure Matrix Smart Volume–Structure Matrix | Smart Money Flow & Dynamic Blocks
This chart combines four complementary analytical modules, each providing a unique perspective on market structure and smart money flow:
- Smart Money Support/Resistance: Identifies buy/sell volume-based zones of accumulation or distribution.
- ATAI Volume (Breakout/Phase/OB-OS): Detects directional volume pressure, market phases (Accumulation/Distribution), and overbought/oversold extremes.
- Smart Money Dynamics Blocks (Pearso
XLong
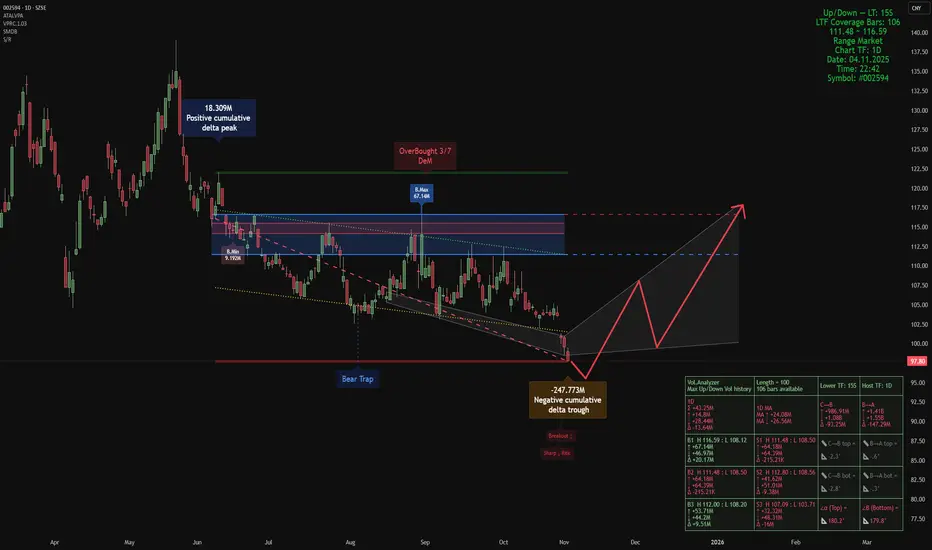
Smart Money Composite View — BYD Company Limited Class ASmart Money Composite View — #002594 (1D), BYD Company Limited Class A
Indicators used:
• Smart Money Support/Resistance
• Smart Money Dynamics Blocks (Pearson Matrix)
• ATAI •Volume Pressure Analyzer v1.2 — Pure Up/Down (Editorial Pick)
We fuse these three into a single composite read. With offset = 48, the setup highlights where price sits relative to smart-money demand/supply, how liquidity is being absorbed, and where momentum can re-emerge.
Market read (composite)
• Price is trad
Smart Money Support/Resistance + ATAI Volume Analysis —PracticalApplication
When these two indicators work together — Smart Money Support/Resistance (Lite) and ATAI Volume Analysis with Price Action — the chart begins to speak a clearer language: one defines where the reaction zones form, and the other explains what happens inside them. The purpose is not prediction but understanding the balance between smart money pressure and retail momentum.
1. Parameter Alignment
On the right side of the chart, the green info panel confirms that both indicators share
Gold setup for coming week.Hi everyone
This is our setup going into the last week of July trading week.
We could possibly see market retest the 3321-3324 zone & make its way back up to 3347 area, this will also be an area to be monitored for possible break out that will lead back to 3362.
We are looking to get a possible downward pressure from 3345 area to 3303.
Let always look at what market presents & bag potential profits at pivitol areas.
Have a good weekend & good trading week coming up
Gold - Small rejection before $3400?Gold has been in a clear downtrend on the 4-hour timeframe, and during one of its recent declines, it left behind a 4-hour Fair Value Gap (FVG). Price is now climbing back toward this imbalance zone, suggesting that a critical test of resistance may be approaching.
Bounce from strong support
Just a few days ago, Gold found solid footing at a strong support area, which triggered a bounce. Since then, it has been pushing higher and is now nearing the 4-hour FVG. This zone represents a significa
Gold - $3160 before the next move up?Introduction
Gold is currently exhibiting interesting price behavior across multiple timeframes, reflecting a mix of short-term bullishness within a broader context of consolidation. On the one-hour chart, gold is trading within a well-defined rising channel, suggesting a controlled upward correction following a strong impulsive move downward. This upward movement appears to be a retracement rather than a full reversal, especially when analyzed in conjunction with the higher timeframes.
Daily
Gold - Bearish continuation towards a strong support!Gold has been in a strong and consistent uptrend, supported by macroeconomic uncertainty and a favorable risk environment. However, on the lower timeframes, price action is showing signs of temporary weakness following a sharp sell-off a few days ago.
Currently, on the 4h chart, Gold appears to be forming a bearish continuation pattern, specifically a pennant. This type of consolidation after a fast drop often suggests potential for further downside. If the pennant breaks to the downside, the p
Today analysis for Nasdaq, Oil, and GoldNasdaq
The Nasdaq closed higher on the daily chart. It held above 18,360 at the close, and today’s candle formed a golden cross as the MACD crossed above the Signal line, creating a potential buy signal. However, this signal will only be confirmed if the candle closes as a solid bullish bar, so it's too early to say that a buy confirmation has been established.
On the weekly chart, although the index has not yet reclaimed the 5-week MA, it has gapped above it. Overall, the index appears to be
Today analysis for Nasdaq, Oil, and GoldNasdaq
The Nasdaq closed lower following news of additional tariffs on China. On the daily chart, the index failed to break above the 20-day moving average and pulled back to the 5-day MA, continuing its box-range movement. Since the 5-day MA is still acting as support, the current trend can still be seen as a sideways consolidation, with 18,500 acting as a central pivot level.
The MACD on the daily chart has not yet clearly broken above the Signal line, so it remains uncertain whether it will
Today analysis for Nasdaq, Oil, and GoldNasdaq
The Nasdaq closed with a sharp surge following news of a possible delay in Trump’s tariff implementation. A 12% single-day rally on the daily chart is unprecedented — it was an extraordinary rise. On the daily chart, the 20-day moving average is acting as resistance, and to fully fill the April 3rd gap-down, the index would need to rise to around 19,750. If the Nasdaq continues to climb and fills that gap, a potential pullback should be anticipated.
Although the MACD has turned sharply
Today analysis for Nasdaq, Oil, and GoldNasdaq
The Nasdaq closed lower after forming an upper wick at the 5-day moving average on the daily chart. If it had closed with a bullish candle, a technical rebound from the oversold condition could have opened the way to the 10-day moving average, but instead, it ended with a bearish candle.
The daily chart still shows a sell signal, but the best-case scenario would be for the market to form a double bottom pattern after confirming a short-term low and attempt another rise toward the 10-day
Today analysis for Nasdaq, Oil, and GoldNasdaq
The Nasdaq closed lower after experiencing extreme volatility the previous day. Following a gap-down open, the market attempted a bottoming process. However, the spread of fake news related to tariffs triggered a 10% intraday swing, making the Nasdaq trade more like an individual stock than a major index. Massive trading volume occurred due to margin calls from CFDs and hedge funds, and the market showed some signs of recognition around a potential short-term bottom.
On the weekly chart
Today analysis for Nasdaq, Oil, and GoldNasdaq
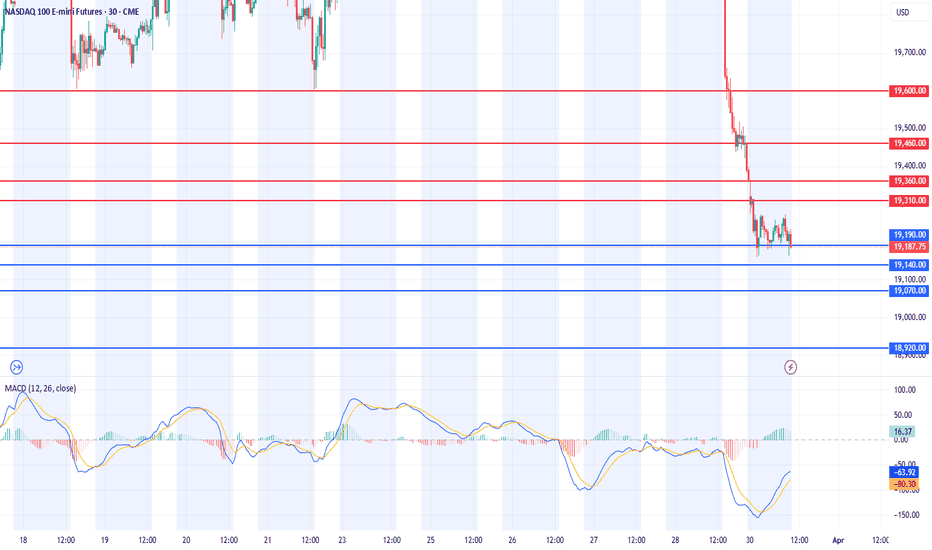
The Nasdaq closed sharply lower due to the aftermath of tariff impositions. Following a significant gap-down, the index broke below the lower Bollinger Band, intensifying selling pressure. Yesterday’s bearish candlestick confirmed a sell signal, leading to an expanded third wave of selling. The index has now reached the previous support zone near 18,500, with additional volatility expected due to today’s Non-Farm Payrolls (NFP) report and Fed Chair Powell’s speech.
On the monthly chart,
Today analysis for Nasdaq, Oil, and GoldNasdaq
The Nasdaq closed higher on the daily chart. However, following the announcement of mutual tariffs after the previous session’s close, the index experienced a significant gap-down. On the daily chart, the MACD has crossed below the signal line, generating a sell signal, though confirmation is still pending. If today's session closes with a bearish candle, we must monitor whether this leads to a third wave of selling, signaling further downside.
Due to the gap-down, the price is now sign
Today analysis for Nasdaq, Oil, and GoldNasdaq
The Nasdaq closed higher on the daily chart. Although a sell signal briefly appeared in the previous session, the MACD failed to form a bearish crossover with the signal line, instead finding support and rebounding. The index strongly bounced from its low, reaching the 5-day moving average (MA) before closing with an upper wick.
Since the MACD is supporting the signal line and potentially resuming an upward trend, the key level to watch is whether the price can break through the strong
Today analysis for Nasdaq, Oil, and GoldNasdaq
The Nasdaq closed lower with a gap-down amid growing recession fears. Although it did not reach the 20-month moving average (MA) on the monthly chart, last month’s long bearish candlestick has resulted in a sell signal on the monthly futures chart—the first time in three years since February 2022. From a monthly perspective, the 16,900–17,500 range appears to be a good buying zone, but it is important to monitor whether the index reaches this level within this month’s candle. The 20-mont
Today analysis for Nasdaq, Oil, and GoldNasdaq
The Nasdaq closed sharply lower, forming a long bearish candlestick, as recession fears intensified. The index fell toward the lower Bollinger Band on the daily chart, while the MACD moved closer to the signal line, indicating a correction.
On the weekly chart, the Nasdaq faced resistance slightly above the 5-week MA, forming an upper wick and closing lower. The MACD is falling steeply, and the signal line is also in a downtrend, suggesting the potential for an overshooting move downwar
Today analysis for Nasdaq, Oil, and GoldNasdaq
The Nasdaq closed lower, facing resistance at the 240-day moving average on the daily chart. With a significant gap between the price and the 5-day moving average, a pullback toward the 5-day MA was anticipated. The index did find support at the 5-day MA, closing with a lower wick. The key question now is whether the current correction wave will fill the gap created on Monday, as it faced resistance at the 240-day line. If you’re looking to buy on dips, it’s best to focus on the gap area
Today analysis for Nasdaq, Oil, and GoldNasdaq
The Nasdaq closed higher, forming a gap up on the daily chart. It showed a strong, one-directional rebound up to the 5-week moving average on the weekly chart.
Since the 5-week MA overlaps with the 60-week MA, it's unlikely to break through easily without a short-term correction.
On the daily chart, the MACD has formed a golden cross, meaning that even if a pullback occurs, the strategy should remain buy-on-dip oriented.
There is still an open gap down to 19,960, which could be filled a
Weekly and Monday analysis for Nasdaq, Oil, and GoldNasdaq
The Nasdaq closed higher, forming a long lower wick as it rebounded. On continuous futures, the index bounced off the 60-week MA, while the daily chart shows a recovery after briefly dropping below the 240-day MA. Looking at the weekly chart, two weeks ago, a large bearish candle decisively broke below a key range, and last week, the Nasdaq failed to break above the 3-week MA, leading to further downside. This week, however, a rebound toward the 5-week MA near 21,050 remains possible.
O
Safe-Haven Demand Lifts Gold Amid US Tariff UncertaintyGold rose above $2,920 per ounce, nearing record highs, as a weaker dollar and trade uncertainty drove safe-haven demand. Trump granted US automakers a one-month exemption from 25% Canada-Mexico tariffs and hinted at more changes. A US official suggested lifting the 10% tariff on Canadian energy if trade conditions are met. Meanwhile, China filed a revised WTO complaint in response to new US tariffs. Investors await the non-farm payrolls report for Fed policy signals.
Key resistance stands at $
Today analysis for Nasdaq, Oil, and GoldNasdaq
The Nasdaq closed lower as market volatility increased due to tariff concerns. Although the index dropped below the 240-day moving average, it formed a lower wick, indicating an attempt to establish a short-term bottom. On continuous futures, the 240-day MA is slightly below 20,000, meaning that the 20,100–20,000 zone is a key support area where a technical rebound is likely following the recent sharp decline. If the market falls into this zone, it could present a swing buying opportunit
Today analysis for Nasdaq, Oil, and GoldNasdaq
The Nasdaq closed sharply lower, rejecting resistance at the lower boundary of its previous range and dropping to the 240-day moving average. Testing the 240-day MA was an expected technical move, and after facing resistance at the 120-day MA, the index retested the 20,300–20,500 zone. This price action has formed the head of a head-and-shoulders pattern, making it crucial to watch for potential rebound attempts. However, since both the MACD and signal line have moved below the zero line