BTCUSD SELL 94152On the 4-hour chart, BTCUSD is trading in a range. Currently, attention should be paid to the resistance around 94152, which is a potential shorting point for a bearish bat pattern, and it is also within the previous supply range.
Bat

GBPJPY Bullish Setup: Combining a Classic & Advanced PatternToday we’re looking at GBPJPY, and what stands out is a high-quality bullish opportunity that blends both a classic pattern formation and an advanced pattern formation into one trade idea.
On the higher timeframes, price recently broke out of a bullish pennant pattern and has recently pulled back to retest the prior structure level that was violated during the breakout.
During the pullback, price action has begun forming a potential bullish Bat pattern.
Three Ways to Trade This Opportunity
1. Trade the Bat Pattern Only
The Bat pattern is a stand-alone trading opportunity. You can execute the trade purely based on the harmonic completion zone, managing risk and taking profits at traditional Bat pattern targets.
2. Use the Bat as Confirmation for the Bigger Breakout Trade
In this approach, the Bat pattern becomes your reason for entry into the larger bullish continuation move that originated from the pennant breakout. Here, the focus is less on harmonic targets and more on holding for trend continuation.
3. Combine Both Approaches (Hybrid Strategy)
This is often the most flexible option. You can:
Take partial profits at traditional Bat pattern levels, but keep a portion of the position open to participate in the larger breakout-driven move
This allows you to reduce risk, pay yourself early, and still maintain exposure to a potentially strong continuation.
Please let me know if you have any questions and feel free to share you views on this pair below.
Akil

ETHUSD SELL 3370On the daily chart, ETHUSD has stabilized and rebounded. Currently, attention should be paid to the resistance around 3370, which is a potential shorting position for a bearish bat, and it is also within the previous supply zone.

BTCUSD SELL 104400On the daily chart, BTCUSD has stabilized and is trending upwards, with the short-term bullish trend in control. Currently, the resistance level to watch is around 104400, which is a potential shorting entry point for a bearish bat pattern and is also within a previous supply zone.

LYB - US LongA slow trade, but nice dividend paid quarterly.
Price back at historic levels
Weekly RSI and MACD showing triple bullish divergence indicating a potential reversal.
Bullish Bat pattern
3 Targets
Approx 9% Stop Loss

USDCHF SELL 0.7973On the 4-hour chart, USD/CHF has stabilized and rebounded, with bulls currently in control in the short term. Attention should be paid to the area around 0.7973, which is a potential shorting entry point for a bearish bat pattern.

4H TRADE IDEA FOR FOR XAUUSDGOLD Is on an overall uptrend and still going to push higher later on, but currently we are on a retracement, and it's going to keep pushing all through today, and resume its continuation

BAT Analysis (4H)From the point we marked as the start, BAT appears to have entered a bullish diametric pattern.
It now seems to be in wave F, which is a bearish wave.
We have identified two entry points for BAT, where positions can be opened using a DCA approach.
The targets have been marked on the chart.
A daily candle close below the invalidation level will invalidate this analysis.
For risk management, please don't forget stop loss and capital management
When we reach the first target, save some profit and then change the stop to entry
Comment if you have any questions
Thank You

Longterm Elloit wave SBUX 12/18/2025In my view, Starbucks has completed its first major wave, which began in 1992. We can observe that wave (b) retraced more than 80% of wave (a), indicating a high probability that wave (c) could form an expanded flat correction.
Moreover, SBUX has tested its long-term trendline multiple times without breaking above its all-time high, which suggests a bearish outlook. A Bat harmonic pattern further supports this view, projecting a target range around 17–20, which also aligns with a major historical support/resistance zone for SBUX.

BAT Analysis (1D)The structure of BAT is bullish, but we should not forget that it is approaching a key level.
BAT is getting close to a strong liquidity pool.
If price reaches the LP zone, we will look for sell / short positions toward the marked targets.
A daily candle close above the invalidation level will invalidate this analysis.
Do not enter the position without capital management and stop setting
Comment if you have any questions
thank you

$BAT 1WThe BITMEX:BAT in the weekly timeframe is in a downtrend and is trading within a descending channel.
The price is forming lower highs and lower lows.
The channel's midline is a critical and important level, which could create a bullish bounce.
However, if it breaks below this level, a price drop to the channel's bottom is anticipated.

XAUUSD is watching the support level at 4257On the 4-hour chart, XAUUSD has retreated from its highs. Currently, watch for support around 4257. If it doesn't break below 4257, it may resume its bullish trend. However, if the price breaks below 4257, it will continue to fall, with further support around 4191, a potential buy point for a bullish bat pattern.

GBPUSD has formed a bearish bat patternOn the daily chart, GBPUSD encountered resistance after testing the previous supply zone, forming a bearish bat pattern in the short term. Currently, shorting opportunities may arise, with a downside target around 1.3285, and a further downside target of 1.3191 if this level is broken.

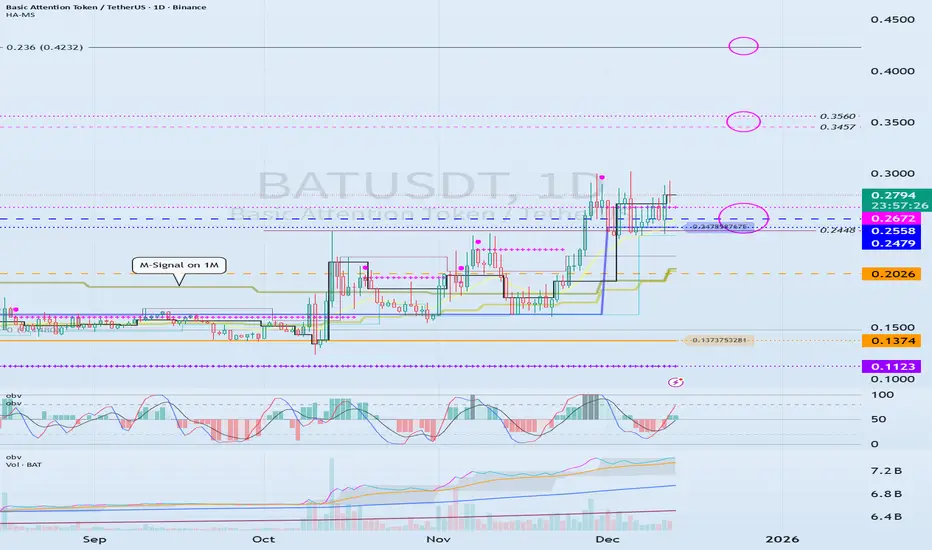
See if it can rally after holding support at 0.2558-0.2672
Hello, fellow traders!
Follow us to get the latest updates quickly.
Have a great day!
-------------------------------------
(BATUSDT 1M Chart)
After a significant decline, the price is forming a close above the M-Signal indicator on the 1M chart.
Accordingly, if the price remains above the M-Signal indicator on the 1M chart, the long-term uptrend is expected to continue.
Since the StochRSI 80 indicator is forming at 0.2448, we should examine whether it finds support near this level and can rise.
A full-scale uptrend is likely to begin when it rises above the Fibonacci level of 0.236 (0.4232).
If a full-scale uptrend begins, the target point is around 0.8357.
-
(1D chart)
Therefore, the key question is whether it can find support near the 0.2479-0.2672 range and rise above 0.3457-0.3560.
If it declines, we should examine whether support is found near the M-Signal indicator on the 1M chart.
Therefore, support around 0.2026 is crucial.
-
Thank you for reading to the end.
I wish you successful trading.
--------------------------------------------------
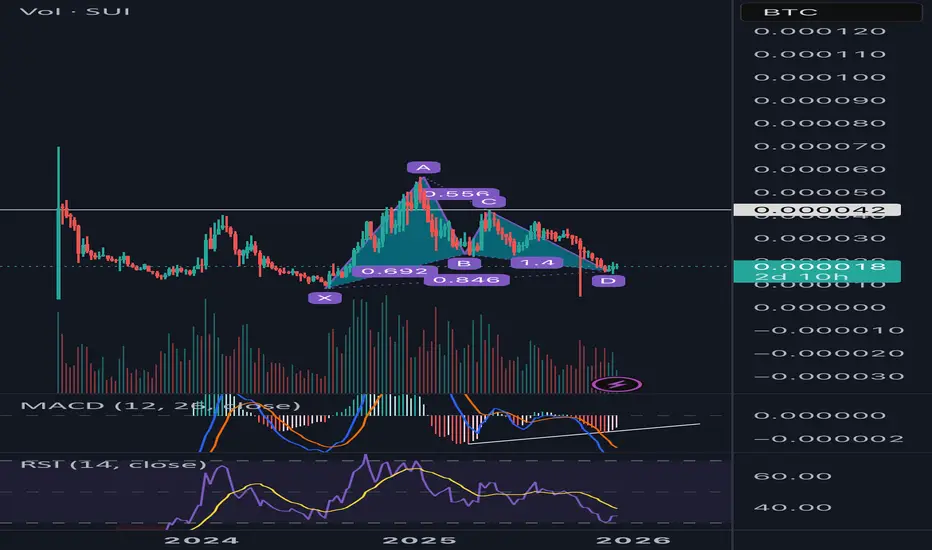
SUI/BTC Weekly: One of the Cleanest Bullish Bat PatternSUI/BTC has just completed a textbook Bullish Bat harmonic exactly at the 0.886 XA retracement while simultaneously finishing a 7-month falling wedge. This is rare high-timeframe confluence that historically leads to violent altcoin outperformance against Bitcoin — exactly the type of setup that kicks off altseason rotations.Chart Overview (1W SUI/BTC) Multi-month falling wedge since July 2025 high
Price has respected the lower wedge boundary 4 times
Exact completion of a Bullish Bat at the 0.886 retracement (PRZ = 0.0000138–0.0000142)
Current price sitting at ~0.000018 (rejection candle off the PRZ)
Bullish Bat Measurements (all ratios within tolerance) XA: base leg
AB = 0.692 retracement of XA
BC = 0.556 retracement of AB
CD = 1.40 extension of BC
XD = 0.846 (target 0.886 hit with <5% error) → perfect Bat completion
Additional Confluence MACD histogram flipping positive + bullish crossover forming
RSI broke its multi-month downtrend at the exact low
Volume spike at the PRZ + declining volume on the pullback = exhaustion
Pattern sits inside the larger $OTHERS/BTC falling wedge that is also approaching apex
Narrative Fuel (already in motion) Sui TVL exploding past $2.6B
USDS stablecoin (Stripe-backed), wBTC integration, ETF filings
Highest fees & real revenue among new L1s
Institutional products launching (Grayscale Trust, 21Shares/Bitwise filings)
Conclusion
This is not just another altcoin setup — it’s a weekly harmonic reversal inside a multi-month falling wedge with momentum and fundamentals aligning perfectly.
Setups like this have preceded the strongest alt/BTC moves of previous cycles.
SUI is positioned to lead the next leg of altseason when Bitcoin dominance finally cracks.Risk management: Keep invalidation tight, but conviction can be high.
This is the type of structure you look back on and say “that was the bottom.”Position: Long SUI (spot or responsible leverage)
Timeframe: 2–12 weeks for initial move, potential multi-month runner Let the wedge break and the Bat fly.
BAT - Is This the Start of a Bigger Continuation?📈BAT has been steadily shifting from accumulation into a clear bullish structure , forming higher lows and pressing back into the major resistance from earlier this quarter.
⚔️Price is now retesting the red breakout level, which previously acted as resistance during the correction phase.
As long as BAT holds above this level, we will be looking for continuation setups, expecting buyers to maintain control and push toward the major resistance around 0.3550.
🏹A clean retest followed by bullish rejection would provide the ideal continuation entry.
However, if price breaks below the level again, this scenario becomes invalid in the short term.
Are you tracking BAT’s breakout structure too? Let me know 👇🔥
⚠️ Disclaimer: This is not financial advice. Always do your own research and manage risk properly.
📚 Stick to your trading plan regarding entries, risk, and management.
Good luck! 🍀
All Strategies Are Good; If Managed Properly!
~Richard Nasr

USDCHF BUY 0.7903On the daily chart, USDCHF has pulled back in the short term. Currently, we can pay attention to the support around 0.7903, which is a potential buy point for a bullish bat pattern. At the same time, this position is within the previous demand zone.

SHORT: Clear Bearish Bat on the 4H. BMNR is flashing a clear Bearish Bat Harmonic pattern.
Target is the 0.618 FIB around $31.

EURUSD upside target: 1.1868On the daily chart, EURUSD has formed a double bottom pattern, indicating that bulls have the upper hand in the short term. Currently, the market presents opportunities to buy on pullbacks, with support around 1.167 and an upside target around 1.1868. This level is a potential shorting entry point for a bearish bat pattern and is also within a previous supply zone.

BAT is getting close to the buyers' zone (3D)After multiple drops, it seems that BAT is getting close to a strong support level. In this zone, it is possible to buy gradually in spot.
The targets are indicated on the chart.
The closure of a daily candle below the invalidation level will invalidate this analysis.
Do not enter the position without capital management and stop setting
Comment if you have any questions
thank you

USDCAD BUY 1.3774On the daily chart, USDCAD has fallen from its highs. Currently, pay attention to the area around 1.3774, which is a potential buy point for a bullish bat pattern. At the same time, this level is within the previous demand zone.

CADCHF - Potential Bearish BatCAD/CHF is completing a clean Bearish Bat pattern at 0.58658.
Price is entering a major supply zone, forming RSI bearish divergence, and pushing above the value area into a low-volume rejection area. These conditions create a high-probability sell setup.
Entry:
Sell 0.58550 – 0.58800 (after confirmation)
Stop Loss:
0.58950 – 0.59100 above X and liquidity
Targets:
TP1: 0.576–0.577 (0.382 retracement + POC zone)
TP2: 0.570–0.571 (0.618 retracement + VAL)
TP3: 0.563–0.565 (macro structure)
Harmonic completion + fib clustering + structural supply + VPVR resistance + RSI divergence = textbook bearish reversal conditions.

EURGBP BUY 0.8680On the daily chart, EURBBP is fluctuating at high levels. Currently, attention should be paid to the support level around 0.8680, which is a potential buy point for a bullish bat pattern and is also located within the previous demand zone.
