GOLD BEARS ARE GAINING STRENGTH|SHORT
GOLD SIGNAL
Trade Direction: short
Entry Level: 3,824.27
Target Level: 3,583.49
Stop Loss: 3,983.30
RISK PROFILE
Risk level: medium
Suggested risk: 1%
Timeframe: 1D
Disclosure: I am part of Trade Nation's Influencer program and receive a monthly fee for using their TradingView charts in my analysis.
✅LIKE AND COMMENT MY IDEAS✅
Bearish Patterns

AUD/CAD SELLERS WILL DOMINATE THE MARKET|SHORT
AUD/CAD SIGNAL
Trade Direction: short
Entry Level: 0.913
Target Level: 0.906
Stop Loss: 0.918
RISK PROFILE
Risk level: medium
Suggested risk: 1%
Timeframe: 9h
Disclosure: I am part of Trade Nation's Influencer program and receive a monthly fee for using their TradingView charts in my analysis.
✅LIKE AND COMMENT MY IDEAS✅

GBP/JPY SHORT FROM RESISTANCE
Hello, Friends!
GBP/JPY pair is trading in a local uptrend which we know by looking at the previous 1W candle which is green. On the 1H timeframe the pair is going up too. The pair is overbought because the price is close to the upper band of the BB indicator. So we are looking to sell the pair with the upper BB line acting as resistance. The next target is 200.003 area.
Disclosure: I am part of Trade Nation's Influencer program and receive a monthly fee for using their TradingView charts in my analysis.
✅LIKE AND COMMENT MY IDEAS✅

NG1! BEARS ARE STRONG HERE|SHORT
NG1! SIGNAL
Trade Direction: short
Entry Level: 3.177
Target Level: 2.934
Stop Loss: 3.339
RISK PROFILE
Risk level: medium
Suggested risk: 1%
Timeframe: 9h
Disclosure: I am part of Trade Nation's Influencer program and receive a monthly fee for using their TradingView charts in my analysis.
✅LIKE AND COMMENT MY IDEAS✅

GBP/NZD SENDS CLEAR BEARISH SIGNALS|SHORT
Hello, Friends!
We are targeting the 0.978 level area with our short trade on GBP/NZD which is based on the fact that the pair is overbought on the BB band scale and is also approaching a resistance line above thus going us a good entry option.
Disclosure: I am part of Trade Nation's Influencer program and receive a monthly fee for using their TradingView charts in my analysis.
✅LIKE AND COMMENT MY IDEAS✅

EUR/NZD BEST PLACE TO SELL FROM|SHORT
Hello, Friends!
It makes sense for us to go short on EUR/NZD right now from the resistance line above with the target of 1.988 because of the confluence of the two strong factors which are the general downtrend on the previous 1W candle and the overbought situation on the lower TF determined by it’s proximity to the upper BB band.
Disclosure: I am part of Trade Nation's Influencer program and receive a monthly fee for using their TradingView charts in my analysis.
✅LIKE AND COMMENT MY IDEAS✅

EUR/CAD BEARS WILL DOMINATE THE MARKET|SHORT
EUR/CAD SIGNAL
Trade Direction: short
Entry Level: 1.632
Target Level: 1.625
Stop Loss: 1.636
RISK PROFILE
Risk level: medium
Suggested risk: 1%
Timeframe: 9h
Disclosure: I am part of Trade Nation's Influencer program and receive a monthly fee for using their TradingView charts in my analysis.
✅LIKE AND COMMENT MY IDEAS✅

EUR/USD SENDS CLEAR BEARISH SIGNALS|SHORT
Hello, Friends!
We are now examining the EUR/USD pair and we can see that the pair is going up locally while also being in a uptrend on the 1W TF. But there is also a powerful signal from the BB upper band being nearby, indicating that the pair is overbought so we can go short from the resistance line above and a target at 1.173 level.
Disclosure: I am part of Trade Nation's Influencer program and receive a monthly fee for using their TradingView charts in my analysis.
✅LIKE AND COMMENT MY IDEAS✅

GOLD SHORT FROM RESISTANCE
GOLD SIGNAL
Trade Direction: short
Entry Level: 3,743.82
Target Level: 3,553.39
Stop Loss: 3,870.43
RISK PROFILE
Risk level: medium
Suggested risk: 1%
Timeframe: 1D
Disclosure: I am part of Trade Nation's Influencer program and receive a monthly fee for using their TradingView charts in my analysis.
✅LIKE AND COMMENT MY IDEAS✅

EUR/GBP BEARS ARE GAINING STRENGTH|SHORT
Hello, Friends!
EUR/GBP pair is in the downtrend because previous week’s candle is red, while the price is clearly rising on the 12H timeframe. And after the retest of the resistance line above I believe we will see a move down towards the target below at 0.867 because the pair is overbought due to its proximity to the upper BB band and a bearish correction is likely.
Disclosure: I am part of Trade Nation's Influencer program and receive a monthly fee for using their TradingView charts in my analysis.
✅LIKE AND COMMENT MY IDEAS✅

SILVER SELLERS WILL DOMINATE THE MARKET|SHORT
SILVER SIGNAL
Trade Direction: short
Entry Level: 4,409.7
Target Level: 4,246.7
Stop Loss: 4,517.2
RISK PROFILE
Risk level: medium
Suggested risk: 1%
Timeframe: 9h
Disclosure: I am part of Trade Nation's Influencer program and receive a monthly fee for using their TradingView charts in my analysis.
✅LIKE AND COMMENT MY IDEAS✅

USD/CAD BEARISH BIAS RIGHT NOW| SHORT
USD/CAD SIGNAL
Trade Direction: short
Entry Level: 1.387
Target Level: 1.379
Stop Loss: 1.392
RISK PROFILE
Risk level: medium
Suggested risk: 1%
Timeframe: 12h
Disclosure: I am part of Trade Nation's Influencer program and receive a monthly fee for using their TradingView charts in my analysis.
✅LIKE AND COMMENT MY IDEAS✅

USD/CHF BEST PLACE TO SELL FROM|SHORT
Hello, Friends!
USD/CHF pair is trading in a local downtrend which know by looking at the previous 1W candle which is red. On the 3H timeframe the pair is going up. The pair is overbought because the price is close to the upper band of the BB indicator. So we are looking to sell the pair with the upper BB line acting as resistance. The next target is 0.789 area.
Disclosure: I am part of Trade Nation's Influencer program and receive a monthly fee for using their TradingView charts in my analysis.
✅LIKE AND COMMENT MY IDEAS✅

USD/JPY BEARS ARE STRONG HERE|SHORT
Hello, Friends!
We are targeting the 147.228 level area with our short trade on USD/JPY which is based on the fact that the pair is overbought on the BB band scale and is also approaching a resistance line above thus going us a good entry option.
Disclosure: I am part of Trade Nation's Influencer program and receive a monthly fee for using their TradingView charts in my analysis.
✅LIKE AND COMMENT MY IDEAS✅

NZD/CHF BEARISH BIAS RIGHT NOW| SHORT
NZD/CHF SIGNAL
Trade Direction: short
Entry Level: 0.466
Target Level: 0.464
Stop Loss: 0.468
RISK PROFILE
Risk level: medium
Suggested risk: 1%
Timeframe: 1h
Disclosure: I am part of Trade Nation's Influencer program and receive a monthly fee for using their TradingView charts in my analysis.
✅LIKE AND COMMENT MY IDEAS✅

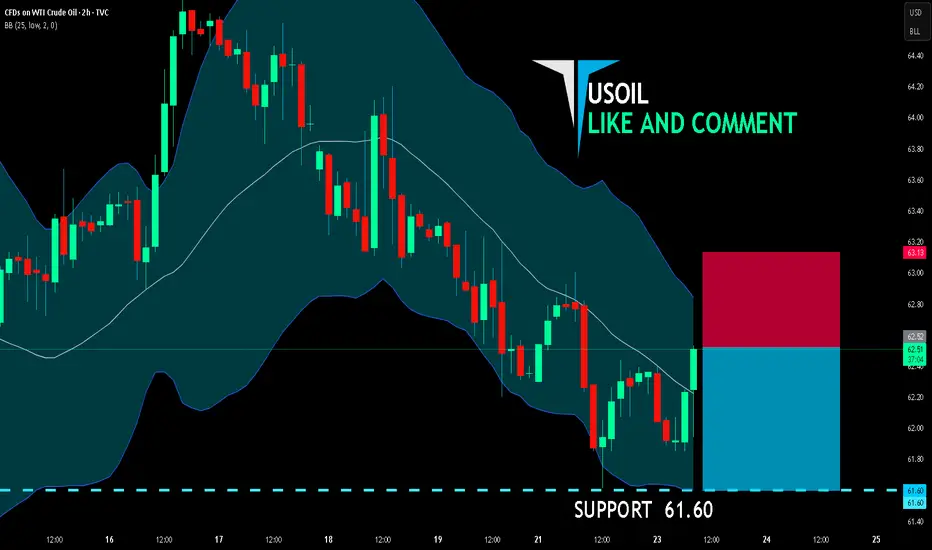
USOIL SHORT FROM RESISTANCE
USOIL SIGNAL
Trade Direction: short
Entry Level: 62.52
Target Level: 61.60
Stop Loss: 63.13
RISK PROFILE
Risk level: medium
Suggested risk: 1%
Timeframe: 2h
Disclosure: I am part of Trade Nation's Influencer program and receive a monthly fee for using their TradingView charts in my analysis.
✅LIKE AND COMMENT MY IDEAS✅
AUD/USD BEARS WILL DOMINATE THE MARKET|SHORT
AUD/USD SIGNAL
Trade Direction: short
Entry Level: 0.660
Target Level: 0.657
Stop Loss: 0.661
RISK PROFILE
Risk level: medium
Suggested risk: 1%
Timeframe: 1h
Disclosure: I am part of Trade Nation's Influencer program and receive a monthly fee for using their TradingView charts in my analysis.
✅LIKE AND COMMENT MY IDEAS✅

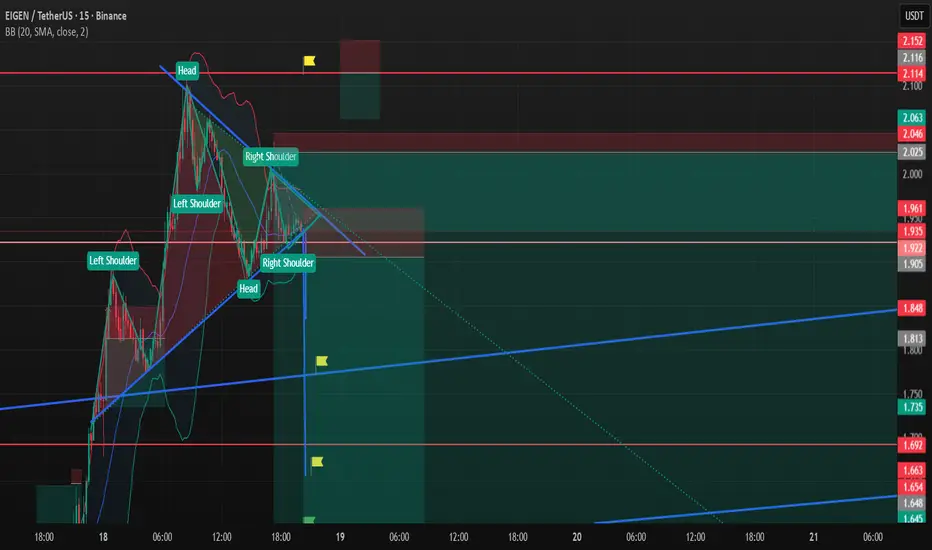
Eigen Short SetupI couldnt publish targets for the last idea it was in rush here I am for the second chart of the same position and also I added a new short position you can follow if you couldnt catch
There is both bullish and bearish head and shoulder formation I assume bearish version will work
Always manage your own risks this is not a investment advise I am not responsible neither your loss nor profit.
Targets
TP1 Blue trendline
TP2 1.658
TP3 1.590
GOLD SELLERS WILL DOMINATE THE MARKET|SHORT
GOLD SIGNAL
Trade Direction: short
Entry Level: 3,698.25
Target Level: 3,667.27
Stop Loss: 3,718.92
RISK PROFILE
Risk level: medium
Suggested risk: 1%
Timeframe: 1h
Disclosure: I am part of Trade Nation's Influencer program and receive a monthly fee for using their TradingView charts in my analysis.
✅LIKE AND COMMENT MY IDEAS✅

AUD/NZD BEST PLACE TO SELL FROM|SHORT
Hello, Friends!
Previous week’s green candle means that for us the AUD/NZD pair is in the uptrend. And the current movement leg was also up but the resistance line will be hit soon and upper BB band proximity will signal an overbought condition so we will go for a counter-trend short trade with the target being at 1.118.
Disclosure: I am part of Trade Nation's Influencer program and receive a monthly fee for using their TradingView charts in my analysis.
✅LIKE AND COMMENT MY IDEAS✅

CAD/CHF BEARS ARE STRONG HERE|SHORT
Hello, Friends!
CAD/CHF is trending down which is obvious from the red colour of the previous weekly candle. However, the price has locally surged into the overbought territory. Which can be told from its proximity to the BB upper band. Which presents a great trend following opportunity for a short trade from the resistance line above towards the demand level of 0.570.
Disclosure: I am part of Trade Nation's Influencer program and receive a monthly fee for using their TradingView charts in my analysis.
✅LIKE AND COMMENT MY IDEAS✅

USDJPY Ultimate Price Action Analysis:📊 USDJPY Forecast 🔮💹 (147.961) Closing 20th Sept 2025 | 12:50 AM UTC+4
🕵️♂️ Market Snapshot
USDJPY closed at 147.961, showing mixed signals as bulls attempt to hold ground near critical levels while sellers eye a potential reversal. ⚖️
🏦 Technical Framework
🔹 Chart Patterns
📈 Possible Elliott Wave 5th leg exhaustion near 148.5–149.2.
🌀 Harmonic PRZ forming around 149.0.
🏯 Ichimoku Cloud shows resistance overhead, baseline support at 147.3.
⚠️ Watch for bull trap if price fails 148.2.
🔹 Indicators
RSI 📊: 62 → mild overbought.
BB 🔔: Price hugging upper band = volatility spike.
MA Cross 🔀: Golden cross intact, but momentum flattening.
VWAP ⚡: Anchored VWAP = 147.6 → strong pivot.
🕐 Intraday Outlook
Buy Zone 💵: 147.40 – 147.60 (support + VWAP confluence).
Sell Zone 💸: 148.50 – 148.80 (resistance + harmonic).
Take Profit 🎯:
Longs → 148.20 / 148.50
Shorts → 147.10 / 146.80
Stop Loss 🛑:
Longs < 147.20
Shorts > 149.00
⏳ Swing Trading Outlook
Bullish Scenario 🐂: Break & close above 149.20 → next target 150.50 – 151.20.
Bearish Scenario 🐻: Close below 146.80 → correction toward 145.40 – 144.70.
📌 Key Levels
Resistance: 148.20 / 148.80 / 149.20
Support: 147.40 / 146.80 / 145.40
🎯 Strategy Summary
✅ Intraday: Buy dips near support, sell rallies near resistance.
✅ Swing: Watch 149.20 breakout or 146.80 breakdown for larger moves.
⚡ Volatility expected → trade with strict risk control.
🌍 Market Context
Fed & BoJ policy divergence remains key.
Geopolitical jitters in Asia could trigger safe-haven flows → boosting JPY demand.
🔥 Trade Smart | Manage Risk | Respect Levels 🔥
For individuals seeking to enhance their trading abilities based on the analyses provided, I recommend exploring the mentoring program offered by Shunya Trade. (Website: shunya dot trade)
I would appreciate your feedback on this analysis, as it will serve as a valuable resource for future endeavors.
Sincerely,
Shunya.Trade
Website: shunya dot trade
⚠️Disclaimer: This post is intended solely for educational purposes and does not constitute investment advice, financial advice, or trading recommendations. The views expressed herein are derived from technical analysis and are shared for informational purposes only. The stock market inherently carries risks, including the potential for capital loss. Therefore, readers are strongly advised to exercise prudent judgment before making any investment decisions. We assume no liability for any actions taken based on this content. For personalized guidance, it is recommended to consult a certified financial advisor.

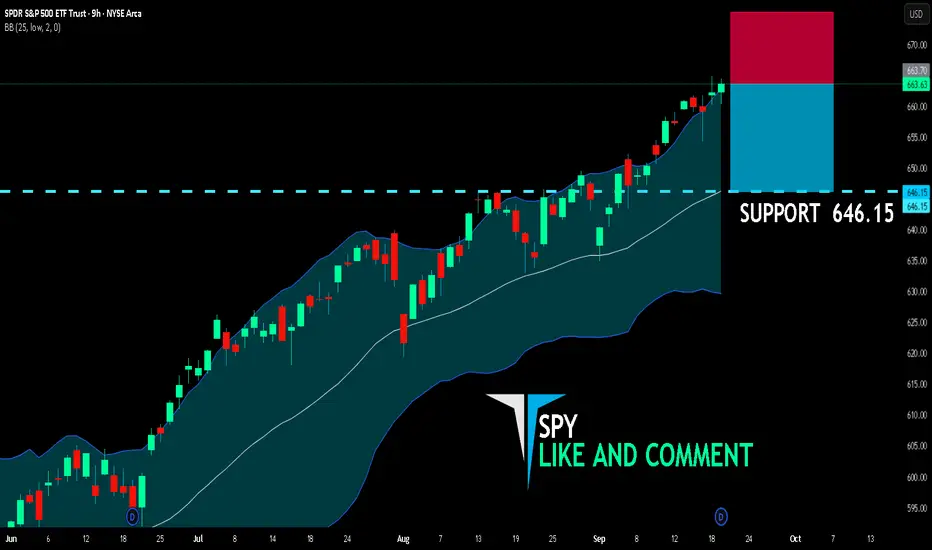
SPY SHORT FROM RESISTANCE
SPY SIGNAL
Trade Direction: short
Entry Level: 663.70
Target Level: 646.15
Stop Loss: 675.36
RISK PROFILE
Risk level: medium
Suggested risk: 1%
Timeframe: 9h
Disclosure: I am part of Trade Nation's Influencer program and receive a monthly fee for using their TradingView charts in my analysis.
✅LIKE AND COMMENT MY IDEAS✅