BITCOIN (BTC/USD): Consolidates—Breakout or Breakdown Ahead?⚠️Bitcoin is currently consolidating following a significant bearish rally.
The price is coiling within a horizontal trading range on a 4-hour timeframe.
Based on the price's reaction to these boundaries, two potential scenarios are anticipated:
Bullish Scenario:
Should the price break and close above 104,640 on a 4-hour timeframe, a bullish trend continuation is expected.
The target for this scenario is 108,000.
Bearish Scenario:
Conversely, if the price drops and closes below 98,780 on the 4-hour timeframe, a bearish movement is anticipated.
The objective for this scenario is 96,000.
Given the current oversold market conditions, a bullish bias is held.
However, further observation is warranted to confirm the market's direction.
What are your expectations?
Bearish Patterns

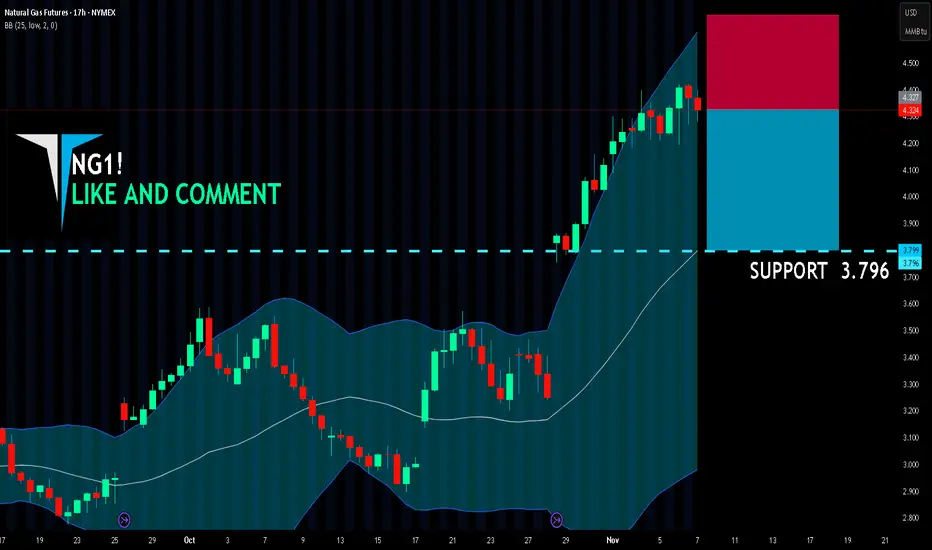
NG1! BEST PLACE TO SELL FROM|SHORT
NG1! SIGNAL
Trade Direction: short
Entry Level: 4.327
Target Level: 3.796
Stop Loss: 4.678
RISK PROFILE
Risk level: medium
Suggested risk: 1%
Timeframe: 17h
Disclosure: I am part of Trade Nation's Influencer program and receive a monthly fee for using their TradingView charts in my analysis.
✅LIKE AND COMMENT MY IDEAS✅
CAD/CHF BEARS WILL DOMINATE THE MARKET|SHORT
Hello, Friends!
CAD/CHF pair is trading in a local uptrend which we know by looking at the previous 1W candle which is green. On the 1D timeframe the pair is going up too. The pair is overbought because the price is close to the upper band of the BB indicator. So we are looking to sell the pair with the upper BB line acting as resistance. The next target is 0.561 area.
Disclosure: I am part of Trade Nation's Influencer program and receive a monthly fee for using their TradingView charts in my analysis.
✅LIKE AND COMMENT MY IDEAS✅

AUDUSD Potential DownsidesHey Traders, in today's trading session we are monitoring AUDUSD for a selling opportunity around 0.65100 zone, AUDUSD is trading in a downtrend and currently is in a correction phase in which it is approaching the trend at 0.65100 support and resistance area.
Trade safe, Joe.

CHF/JPY SELLERS WILL DOMINATE THE MARKET|SHORT
CHF/JPY SIGNAL
Trade Direction: short
Entry Level: 190.016
Target Level: 189.715
Stop Loss: 190.214
RISK PROFILE
Risk level: medium
Suggested risk: 1%
Timeframe: 1h
Disclosure: I am part of Trade Nation's Influencer program and receive a monthly fee for using their TradingView charts in my analysis.
✅LIKE AND COMMENT MY IDEAS✅

Bottom of BTC?Everyone says the crypto market is already in a bearish season, but I have a different scenario
Yes in the past few weeks BYBIT:BTCUSDT has dropped significantly, around -21% from its peak at $126,195. However, I see that on the weekly chart, the price is still holding above $100,731 and $98,185. As long as the weekly candle doesn’t close below $102,329, there’s still a chance for BYBIT:BTCUSDT to continue its bullish move.
Now, let’s zoom in to the hourly chart to find potential areas for a price rebound.
On the hourly timeframe, there was a break below $100,288, with the next downside target around $99,548 – $98,961. But if we look closely, the drop that happened on November 6th, 2026, at 02:00 AM (GMT+7) wasn’t as aggressive as the previous one.
It seems that the seller’s momentum has started to fade since that period, which could indicate a shift from sellers to buyers.
Since the selling pressure is weakening, my scenario is that the decline in BYBIT:BTCUSDT will likely stop around $99,548 – $98,961, and from there, a significant rebound may follow.
That’s my view on BYBIT:BTCUSDT , what’s yours?

GBPUSD Eyes 1.31000 Rejection as Fed Cut Bets Look Overstated!Hey Traders,
In today’s trading session, we’re monitoring GBPUSD for a selling opportunity around the 1.31000 zone. The pair remains within a broader downtrend and is currently in a correction phase, approaching a key resistance area where previous sell-side momentum originated.
Structure:
GBPUSD has been struggling to sustain any meaningful rebound, with each rally meeting renewed selling interest. The 1.31000 zone aligns with both structural resistance and the descending trendline, making it a crucial level to watch for potential downside continuation.
Fundamentals:
The likelihood of a December rate cut from the Fed remains high. The ADP employment report came in solid, and ISM Services showed continued strength, suggesting that the labor market and service sector remain resilient.
As these stronger readings filter through, the market could begin to gradually price out that December rate cut expectation, reinforcing USD strength and pressuring GBPUSD further.
Next move:
Watching for price rejection near 1.31000 — sustained bearish pressure here could open the door toward a deeper retracement in the coming sessions.
💬 What’s your take on the Fed pricing dynamic? Drop your thoughts below!
Trade safe,
Joe.

EURUSD (1H)- I think EURUSD will continue to go up a little bit to hit the Resistance Area at (1.5656 - 1.5757) right after the Liquidity Sweep area to fill a Fair Value Gap.
- The Resistance Area is also at the 50% retracement between the Low on Nov.5 and the High on Oct.29
- Once Resistance Area is reached, I think price will continue to head back down towards an Order Block in the 4H time frame which is (1.146 - 1.139)

$XOM with a bearish outlook following its earnings #StocksThe PEAD projected a bearish outlook for NYSE:XOM after a negative over reaction following its earnings release placing the stock in drift A with an expected accuracy of 25%.

$BAC with a bearish outlook following its earnings #StocksThe PEAD projected a bearish outlook for NYSE:BAC after a positive over reaction following its earnings release placing the stock in drift B with an expected accuracy of 42.86%.

GOLD BEARS ARE STRONG HERE|SHORT
GOLD SIGNAL
Trade Direction: short
Entry Level: 4,007.34
Target Level: 3,924.43
Stop Loss: 4,062.61
RISK PROFILE
Risk level: medium
Suggested risk: 1%
Timeframe: 4h
Disclosure: I am part of Trade Nation's Influencer program and receive a monthly fee for using their TradingView charts in my analysis.
✅LIKE AND COMMENT MY IDEAS✅

GBP/JPY BEARS WILL DOMINATE THE MARKET|SHORT
Hello, Friends!
Previous week’s green candle means that for us the GBP/JPY pair is in the uptrend. And the current movement leg was also up but the resistance line will be hit soon and upper BB band proximity will signal an overbought condition so we will go for a counter-trend short trade with the target being at 200.420.
Disclosure: I am part of Trade Nation's Influencer program and receive a monthly fee for using their TradingView charts in my analysis.
✅LIKE AND COMMENT MY IDEAS✅

GBP/NZD SENDS CLEAR BEARISH SIGNALS|SHORT
Hello, Friends!
GBP/NZD is trending down which is evident from the red colour of the previous weekly candle. However, the price has locally surged into the overbought territory. Which can be told from its proximity to the BB upper band. Which presents a classical trend following opportunity for a short trade from the resistance line above towards the demand level of 2.296.
Disclosure: I am part of Trade Nation's Influencer program and receive a monthly fee for using their TradingView charts in my analysis.
✅LIKE AND COMMENT MY IDEAS✅

GBPUSD is Tanking Under The Pressure of a Strong Dollar!!Hey Traders, in today’s trading session we’re monitoring GBPUSD for a selling opportunity around the 1.31000 zone. The pair has broken below a key support level and is now showing signs of a potential retracement, possibly setting up a continuation to the downside.
From a fundamental standpoint, the Federal Reserve’s firm tone and the reduced likelihood of a rate cut in December continue to support dollar strength, keeping pressure on the pound.
Watching closely for rejection signals near 1.31000 that could confirm bearish momentum resuming.
Trade safe,
Joe

URUSD Faces Pressure Near 1.15100 as DXY Holds Strong Above 100!Hey Traders,
In today’s trading session we are monitoring EURUSD for a selling opportunity around the 1.15100 zone. The pair is trading within a broader downtrend and is currently in a correction phase, approaching the trend resistance at 1.15100.
Structure:
EURUSD continues to form lower highs and lower lows, suggesting that sellers remain in control. The 1.15100 zone stands as a key resistance where bearish momentum could resume.
Fundamentals:
This setup aligns with the recent DXY analysis, where the Dollar Index is holding firm around 100.000 after hawkish Fed remarks downplayed the likelihood of a December rate cut. A resilient Dollar backdrop strengthens the bearish case for EURUSD as policy divergence continues to favor the greenback.
Next move:
We’ll be watching price action at 1.15100 for potential rejection and continuation lower.
Trade safe,
Joe.

The Double Bottom Trap That Traders Might Miss1. The Comfort Zone of Classic Patterns
Few formations attract traders’ attention like a double bottom. It’s one of those timeless chart patterns that promise hope after a long decline—a visual story of selling exhaustion followed by a bullish reversal.
But markets rarely reward what’s obvious. In futures trading, especially when examining instruments like Bitcoin Futures (BTC) and Micro Bitcoin Futures (MBT), patterns are only half the story. What truly moves price isn’t just the shape on the chart—it’s the order flow behind it.
That’s where understanding FO (Filled Orders) and UFO (UnFilled Orders) becomes essential. Both represent past and potential liquidity imbalances, and reading their relationship can transform how traders interpret “classic” setups.
2. The Bitcoin Setup: A Tale of Two Bottoms
The current BTC daily chart paints what seems like a textbook double bottom. Two price troughs form near the same horizontal area around $104,000, setting up the typical “W” shape many traders see as a bullish reversal pattern.
However, when we dig deeper into the order flow structure, the illusion begins to fade.
A FO Support level exists near $103,860, meaning that this area previously attracted enough buyers to halt a decline—but those orders have already been filled and we know this given the fact that price turned at that price level before.
The next UFO Support zone sits much lower, around $95,640. That’s where unfilled buy orders are expected to remain waiting, untouched.
This distinction matters. While FO zones mark previous turning points, UFO zones highlight potential turning points that still contain resting liquidity. In simple terms, FO areas represent “used energy,” while UFO areas represent “stored energy.”
3. FO vs. UFO – The Order Flow Reality Check
Let’s define these two concepts with precision:
FO (Filled Orders): Price zones where significant buying or selling already occurred. These levels once reversed price, but because those orders were executed, fewer remain to defend the level again.
UFO (UnFilled Orders): Price zones containing pending buy or sell orders not yet triggered. They represent areas of fresh imbalance and therefore carry a higher probability of influencing future price moves.
In our Bitcoin case, the FO Support around $103,860 has done its job already—it stopped price before. But now, the unfilled buying interest lies lower, implying that the market may need to travel down to reach fresh demand at $95,640.
On the other side, UFO Resistance hovers near $112,410, enveloping the top of the double bottom structure. Should the price rebound toward that level, sellers waiting there could re-enter the scene, potentially capping any bullish recovery.
The conclusion? This pattern isn’t as bullish as it looks.
4. When Bullish Shapes Hide Bearish Probabilities
Most traders spot the double bottom and immediately think “trend reversal.” Yet, the distance between FO and UFO levels tells a more subtle story.
Since FO Support levels carry reduced strength after being tested, they’re more likely to break than hold. In this context, the probability favors a downside continuation rather than an immediate bounce.
If price breaches $103,860, the next probable destination becomes the UFO Support at $95,640. Only then, after reaching that pocket of unfilled demand, might a significant rebound have higher odds.
It’s a reminder that technical patterns, while valuable, must always be filtered through liquidity context. A pattern without order flow validation is like reading the market’s outline without its story.
5. Quantitative Insight: A Probabilistic Lens
Think of this in probabilistic terms:
When FO zones sit above UFO zones, the market often continues toward the unfilled liquidity.
When UFO zones lie closer to current price, reversals occur faster because demand (or supply) is still waiting to be executed.
In our example, BTC shows a larger gap between FO and UFO support levels, signaling lower immediate reversal odds. The chart may appear bullish, but the underlying order flow distribution points to weakness first, strength later.
This is not a prediction—it’s an observation of potential. It allows traders to structure their expectations based on where fresh participation is more likely to emerge.
6. Risk Management: Navigating the Trap
For traders considering setups around this structure, risk management is crucial.
Entry awareness: Avoid entering long positions purely because a double bottom “looks bullish.” Consider waiting for evidence of unfilled demand being triggered (confirmation at or near UFO Support).
Stop-loss placement: Stops below FO Support can easily be hunted in liquidity sweeps; better to align risk control with genuine unfilled demand areas.
Reward-to-risk thinking: A test of the UFO Support near $95,640 could later offer a more favorable upside-to-downside ratio than buying prematurely at $104,000.
Remember, pattern-based entries without liquidity confirmation often carry poor asymmetry—small upside with large downside risk.
7. Futures Structure and Margin Awareness
Both BTC and MBT represent Bitcoin exposure via futures contracts, but their sizing differs dramatically.
BTC equals 5 Bitcoin per contract, making it suitable for larger, institutional players. (1 Tick = 5 = $25. Required Margin = $132,500)
MBT, the Micro Bitcoin Futures, equals 0.1 Bitcoin per contract, offering flexibility for smaller accounts and finer position scaling. (1 Tick = 5 = $0.50. Required Margin = $2,600)
Understanding margin requirements is essential—these products are leveraged instruments, and small price changes can result in large percentage gains or losses.
8. Key Takeaway: The Hidden Lesson
This entire setup illustrates a powerful educational point:
Chart patterns may draw the eye, but order flow tells the truth.
The double bottom may invite buyers, but the imbalance between FO and UFO zones exposes an underlying weakness. Traders who rely solely on visual patterns may walk straight into a trap. Those who align patterns with liquidity insights, however, read the market at a deeper level.
In the current context, BTC and MBT might need to visit lower support levels before finding true stability. Watching how price behaves around these unfilled order zones will reveal whether this double bottom turns into a lasting floor—or just another false start.
When charting futures, the data provided could be delayed. Traders working with the ticker symbols discussed in this idea may prefer to use CME Group real-time data plan on TradingView: www.tradingview.com - This consideration is particularly important for shorter-term traders, whereas it may be less critical for those focused on longer-term trading strategies.
General Disclaimer:
The trade ideas presented herein are solely for illustrative purposes forming a part of a case study intended to demonstrate key principles in risk management within the context of the specific market scenarios discussed. These ideas are not to be interpreted as investment recommendations or financial advice. They do not endorse or promote any specific trading strategies, financial products, or services. The information provided is based on data believed to be reliable; however, its accuracy or completeness cannot be guaranteed. Trading in financial markets involves risks, including the potential loss of principal. Each individual should conduct their own research and consult with professional financial advisors before making any investment decisions. The author or publisher of this content bears no responsibility for any actions taken based on the information provided or for any resultant financial or other losses.

SILVER BEARS ARE GAINING STRENGTH|SHORT
SILVER SIGNAL
Trade Direction: short
Entry Level: 4,774.1
Target Level: 4,681.8
Stop Loss: 4,835.8
RISK PROFILE
Risk level: medium
Suggested risk: 1%
Timeframe: 1h
Disclosure: I am part of Trade Nation's Influencer program and receive a monthly fee for using their TradingView charts in my analysis.
✅LIKE AND COMMENT MY IDEAS✅

EUR/CHF BEST PLACE TO SELL FROM|SHORT
Hello, Friends!
EUR/CHF pair is trading in a local uptrend which we know by looking at the previous 1W candle which is green. On the 9H timeframe the pair is going up too. The pair is overbought because the price is close to the upper band of the BB indicator. So we are looking to sell the pair with the upper BB line acting as resistance. The next target is 0.926 area.
Disclosure: I am part of Trade Nation's Influencer program and receive a monthly fee for using their TradingView charts in my analysis.
✅LIKE AND COMMENT MY IDEAS✅

EJ Makes Massive Descent, Could Further Falls Come?Here is OANDA:EURJPY on the 4Hr Chart and after making a new Higher High @ 178.818, has created a Lower Low @ 176.098, surpassing the most recent Higher Low @ 176.629.
This is a Break in Trend and we should suspect price to fall further on EJ if price can:
- Confirm Trend Change by printing a Lower High
Now on the chart, based on the Lower Low, the Fibonacci Tool lays out a couple favorable areas
First, being the last Higher Low @ 176.629 which lays right below the 23.6% Retracement level @ 176.740.
Secondly, the 50% Retracement Level @ 177.458 where there was Consolidation before the decline in price.
*This deep of a pullback could threaten the Bearish momentum built up from the break down and creating the Lower Low.
Fundamentally, the Yen seen a rise in strength after a couple key things happened:
- BOJ held Interest Rates unchanged @ .5%
- Toyko CPI numbers came out hotter than expected with a Forecast of a .1% increase to 2.6% with Actual coming in at 2.8%, a .3% increase!
*This gives the BOJ to hike rates to help with inflation taking off too hot and this could very well strengthen the Yen more!

GBPUSD within Bearish StructureHi Traders!
With price failing to swing higher I'm still seeing it's within bearish structure. The 1.35000 area looks like a strong resistance/supply zone. If price fails to break and close above it, that reinforces my bearish bias.
As of now, the current bounce looks corrective- possibly a retracement toward the 1.3500 zone before sellers step in again.
If price rejects near 1.35000 and continues to break below, then the next level I'd be considering would be 1.30000.
In addition, DXY is sitting at a higher low zone on a higher TF. It hasn't broken its longer-term uptrend yet. The price action looks like it's attempting a base/reversal. If it holds within 98.000-98.500 and starts pushing up, that could align with GBPUSD weakness.
*DISCLAIMER: I am not a financial advisor. The ideas and trades I take on my page are for educational and entertainment purposes only. I'm just showing you guys how I trade. Remember, trading of any kind involves risk. Your investments are solely your responsibility and not mine.*

AUDUSD Potential DownsidesHey Traders, in today's trading session we are monitoring AUDUSD for a selling opportunity around 0.65300 zone, AUDUSD is trading in a downtrend and currently is in a correction phase in which it is approaching the trend at 0.65300 support and resistance area.
Trade safe, Joe.

AUDUSD Breakout and Potential Retrace!Hey Traders, in today's trading session we are monitoring AUDUSD for a selling opportunity around 0.65800 zone, AUDUSD was trading in an uptrend and currently is in a correction phase in which it is approaching the retrace area at 0.65800 support and resistance area.
Trade safe, Joe.

EUR/NZD SHORT FROM RESISTANCE
EUR/NZD SIGNAL
Trade Direction: short
Entry Level: 2.031
Target Level: 1.999
Stop Loss: 2.053
RISK PROFILE
Risk level: medium
Suggested risk: 1%
Timeframe: 1D
Disclosure: I am part of Trade Nation's Influencer program and receive a monthly fee for using their TradingView charts in my analysis.
✅LIKE AND COMMENT MY IDEAS✅
