The Grayscale Ethereum Trust at Risk of Exacerbated DeclineETPs such as Grayscale's ETHE here utilizes APs (Authorized Participants) which are essentially broker dealers and large financial institutions such as banks, hedge funds and other investment firms to maintain liquidity of the Exchange Traded Product. These APs capitalize on the spread between the ETHE shares and the underlying product, in this case Ethereum, to make a yield through arbitrage.
Put simply, if demand for ETHE begins to rises above current supply, Authorized Participants can create new shares by depositing actual ETH with Grayscale. In return, Grayscale grants the AP newly minted ETHE shares. The AP then is able to list these shares on the secondary market where retail traders can buy them.
Historically these APs were able to mint new ETHE through this process of depositing ETH to Grayscale but they weren't able to redeem their ETHE shares back to ETH, however with the very recent onset of In-kind redemption and creation being permitted by the SEC , we are more likely to see a huge shift in the trend of redemptions.
Now that the SEC has enabled these in-kind redemptions, we could see these APs opt to redeem their ETHE shares for ETH just so they could sell said ETH on the open market or use it as liquidity for privately negotiated block trades on CME futures market during times of stress.
Say if there were sudden inflationary shocks, bond yields rose, or we had systemic banking risks, or even margin risk due to the underperformance of other sectors these institutions may have exposure to, we would likely see them let go of their riskiest assets first before resorting to selling other assets such as stocks and equities, especially those within the defensive categories. This would put Grayscales ETPs in direct danger of collapse as they lose liquidity from their APs and more importantly so it would put these underlying assets at risk of significant decline as the APs continue redeeming, adding supply to the open market, and selling.
This would not only result in negative pressure being put on the underlying assets but will also most likely result in Grayscales ETPs falling a significant amount more than the underlying due to the drainage off liquidity and the resulting widening of spreads. Asa result I think the end game for a lot of these crypto adjacent ETPs and Stocks will be that they go bust especially the leveraged products even including stocks like MSTR which effectively act as a leveraged exposure ETF to Bitcoin. In spite of this negative view I do have some optimism for XRP but overall I am quite bearish on the crypto market and all of the adjacent products being created from it.
In short: ETH along with BTC, which started out to as something to separate itself from the fiat banking system is now completely integrated and at the mercy of the fiat banking system along with all the macroeconomic risks that come with it.
Technical Outlook for the Grayscale Ethereum ETP:
We have a Bearish 5-0 that is completing at the 0.786 retrace we've recently made higher highs but that was likely on the onset of the SEC news release from a couple days ago being interpreted at a bullish capacity, however as the news settles I think it will be more of a negative outcome and us trading to the PCZ off that news provides a good opportunity to sell call spreads and buy puts on ETHE here.
Bearish 5-0
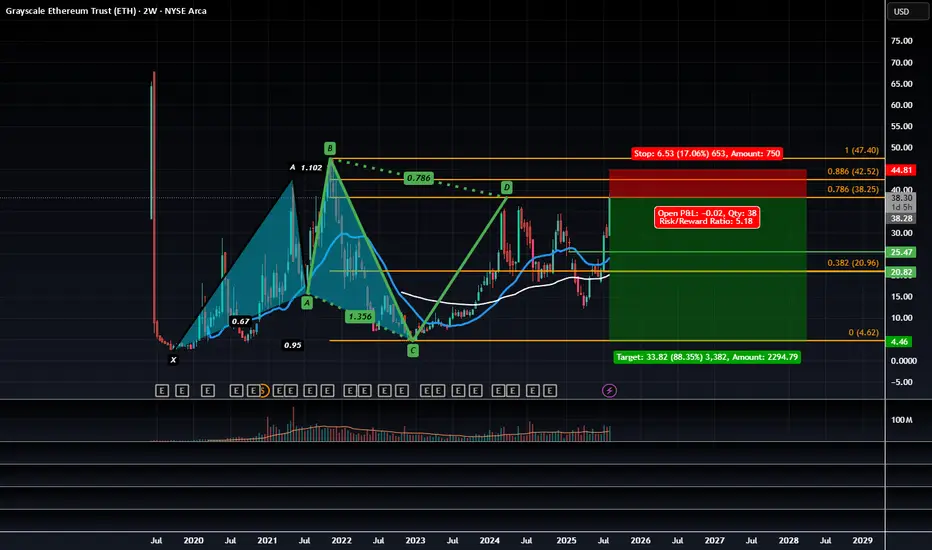
Ethereum Struggles to Complete above the 0.786 Bearish 5-0 ZoneWhile on the intra-bar price action on ETH has gotten pretty excited above the 0.786 it is still worth considering that ETH has not completed any bars above the 0.786 since the breakout and that at a moments noticed much of the current price action above the main 0.786 PCZ could later find itself being filtered out of the Renko charts as a whole depending on how many Average True Ranges above the 0.786 PCZ ETH possible move.
Based on the fact that the current candle is simply still in the projection phase I'd caution longs here and remain accumulative of longer dated puts. There is also a 2x leveraged ETF of ETH called ETHU which has OTM monthly call options trading at 20-40 dollar premiums. I'd consider farming off of those premiums in the form of Bear Vertical Spreads as a way to hedge off the costs of holding the long puts.
Overall, we are still trading at the PCZ of the Bearish 5-0 which seems to also be in the similar shape of a Bearish Head and Shoulders pattern; the measure move of which could take ETH down to around $355 upon the break of $1,600

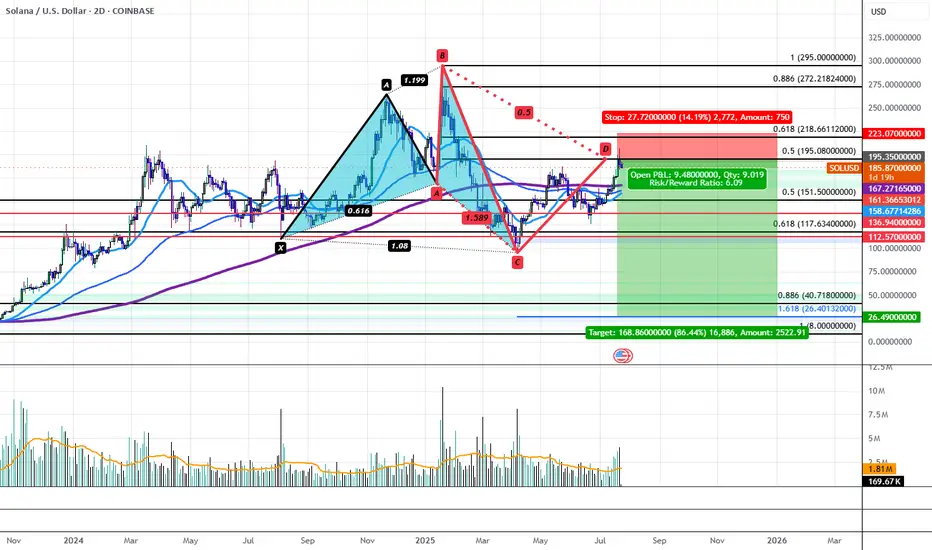
Solana's Bearish 5-0 is Locking in a Bearish Reversal to $26.40Solana has recently run up to Horizontal Resistance Zone of $195-$210 aligning with the PCZ of a Bearish 5-0 and has begun to impulse downwards with volume to back it. This could be the start of a greater move down that would take SOL back to the low of the distributive range at $95.16. If the level breaks, we would then target a drop down to the $40.72-$26.40 confluence area aligning with the all-time 0.886 retrace as well as the 1.618 extension from previous swing low to high. Only at these levels could we even possibly begin to consider Bullish Entries on Solana.
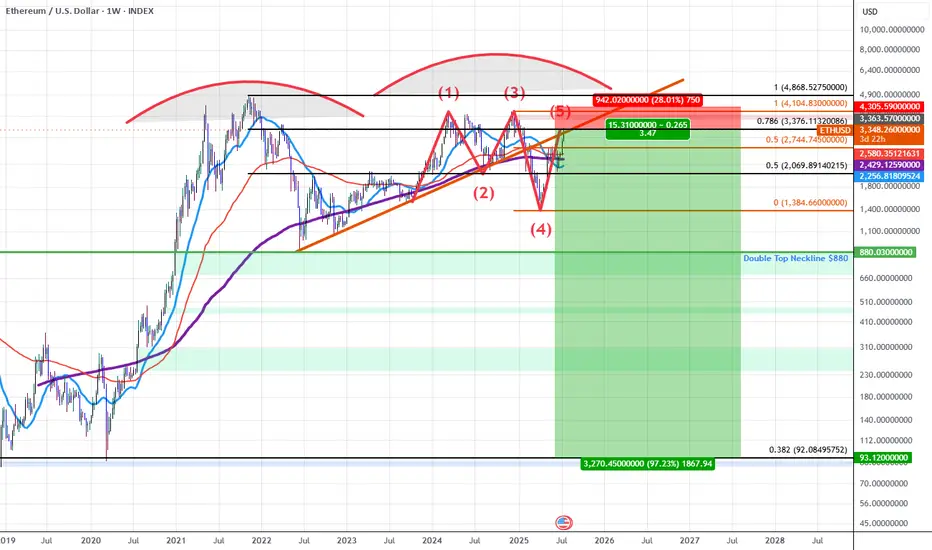
ETHUSD: Double Top into A Bearish 5-0 Breakdown (Extended)Updated Commentary: ETH has extended a bit further than projected as the Pattern Completed at the 0.618 but ETH gapped into the 0.786 instead. The gap up aligned with an upside gap fill on the CME futures as well as a gap fill on the grayscale ETH futures ETF $ETHE. The easier move from here to simply add to the ETH shorts and adjust the stop to be above the previous highs while sizing up at the 0.786 and playing off this gap higher as an anomaly. Beyond this, my view on ETH at the current 0.786 retrace remains the same as the original Idea posted as ETH rose into the initial 0.618 PCZ the details of which I will also include once again below as it still remains relevant.
ETH for the last 5 years has been developing a Double Topping pattern which has put in a series of lower highs during the most recent 2nd run up. As we've confirmed these lower highs we've broken down below trendline and are finding resistance at the trendline which happens to have confluence with the PCZ of a Bearish 5-0 wave formation near a 0.786 retrace.
As we begin to find weakness and Bearish price action begins I suspect price will make it's way towards the neckline of the double top aligning with the $880 price level if ETH breaks below that level there will be no significant support until it reaches the all-time 0.382 retrace down at around $92.10.
In short it seems ETH is in the early stages of a macro breakdown which could result in value declines greater than 80%.
I also suspect that we will see many of the assets that ran up significantly going into this week to sharply reverse those run-ups as this week comes to a close and the new week begins mainly due to the effects of OpEx, this includes: Bitcoin, MSTR, SOL, XLC, META, and BTBT. Long-dated Put accumulation on these assets at these levels is far easier to manage than naked short positions and that's how I will go about positioning here.
ATOMUSD: Holding 21-week SMA After Completion of Bullish SharkATOMUSD has Double Bottomed on the weekly timeframe at the PCZ of a Bullish Shark and is now holding above the 21-week SMA. If it holds, we could see ATOM breakout of the range and rise all the way up to a 61.8% retrace. From there it may then turn into a Bearish 5-0 but for now I'm just focused on the potential Bullish move upwards.
The Shark pattern here is admittedly controversial given the fact the C leg is an equal high to the A leg rather than being a higher high, but I think it is something that this pattern could maybe get away with.

ZARJPY: Massive Head and Shoulders with Bearish DivergenceIn addition to the Bearish 5-0 I pointed out before on a previous chart, the ZARJPY has also formed a Potential Bearish Head and Shoulders that is visible on timeframes even as high as the monthly with Bearish Divergence on the MACD and RSI. If The Carry Trade truly is to be dissolved, the ZARJPY should be among the currency pairs that are most severely affected, as it has the highest interest rate differential and therefore generates the highest yield for the time being.

LMT: Bearish 5-0 with Hidden Bearish DivergenceLMT, after Double Topping at the PCZ of a Bearish Deep Crab, has decided to attempt to finish off this bearish range with a Bearish 5-0, if successful, we could see LMT push significantly below $400.

A Promising Trading StrategyThe star trade of the week. I'm currently waiting for a shorting opportunity on the bearish shark pattern off the weekly chart.
Trading off the weekly chart directly would send my initial risk through the roof. While we could always reduce our trading size when trading off the higher timeframe, it doesn't make sense to me.
I'll be waiting for a bearish 5-0 pattern to complete at 110.56. My initial stop-loss is at 110.96, which is approximate -40pips or -400USD/lot.
My first target is at 109.96, which is approximately 1,000USD/lot.
However, there's also a bullish shark pattern that has completed at 109.96, so there's no reason why you can't engage on that as well.
Remember, it's important to plan your trade and trade your plan. Never follow any trader blindly.

ADBE: Bearish 5-0 Bearish Entry Anticipating PPO ConfirmationBack in December 2021, ADBE gave us a Bearish ABCD entry that led us into a Shark BAMM Pattern. Once it made it to the BAMM target, it bounced back up to where it is now. The interesting thing is that the PPO is looking like it's ready to roll over, and it happens to be at what would be a Potential Bearish 5-0 entry. If the PPO crosses below the upper extremes, we could see this go for a lower low, and if we are to judge how far it can go harmonically, I'd say it could go all the way to the 1.414, which would be the PCZ of a Potential Bullish ABCD.
For additional context, I have left the Bearish Entry setup from 2021 in the Related Ideas Section below.

Great Wins on WTI💰 Celebrating two great wins on WTI in June! But let me clarify, I'm not chasing streaks—I focus on proper setups. Let's dive into the current situation for WTI, aka US Oil.
📈 The market is testing the support line on the weekly chart. While some traders see it as strong support and anticipate buying opportunities, multiple retests increase the likelihood of a break. That's why my highest priority is shorting WTI and monitoring key levels.
⏰ On the 4-hourly chart, I'm cautious about shorting at the Bearish 5-0 pattern. If I spot an RSI divergence, my perspective may change.
⬇️ Instead, I'm patiently waiting for the Bearish Shark Pattern at 72.03 for a shorting opportunity.
⏱️ On the 1-hourly chart, if you're seeking a buying opportunity, watch for a confirmed candlestick pattern on the Bullish Bat setup at 69.61.
📊 Share your trade plan for WTI! What's your top investment product?

Luna Classic: Bearish 5-0 on the Daily LUNC if Breaking Below the 89 Day EMA while showing MACD Bearish Divergence on the Daily after Two very weak Attempted Rallies towards the PCZ of a Potential Bearish 5-0 and now it looks to recover the gaps below the sub one-ten-thousandths level.
I thimnk it Could go as low as 47 Millionths but i will mostly be targetting the zone between 72-55-millionths
LShort

$ANY: Momentum Shifting Spring and Bullish SharkANY looks to be springging off an also support level that aligns with the 1.618 Fibonacci Extension of a Log Scale Bullish Shark while at the same time the RSI seems to be shifting it's momentum into the Bullish Control Zone; Hold these levels long Enough and it could rise up to the 50% Retrace up at around 2 dollars.

It's ONLY ONE Direction, DOWN!!The Bearish 5-0Pattern has been confirmed at 82.91; traders who want to jump in for a shorting opportunity could wait for a retest at that level.
Alternatively, you could wait for a Triple Top Retest at 83.22 on the 1-hourly chart(left).

RBOB Gasoline Future Macro Bearish 5-0Gasoline Futures is very near the PCZ of a Bearish 5-0 but is actually showing a very notable amount of weakness at the 0.382 and is Bearishly Diverging if this keeps up we will see Gasoline Breakdown out of the Bearish Consolidation and probably go back to pre-2020 Levels.

The easiest 100pips profits to captureAs early as 8 Feb 23, I've been shouting LONG the Shark, LONG the Shark(at this to my community). The trading analysis report was written on TradingView.
The Bullish Shark Pattern has been bouncing off the Bearish 5-0 patterns, and this combo, it produces more than 100pips of profit potential.
It has bounced up and down 5 times; that's not too bad. 5x100pips = 500pips.
I'm excited to wait for the next confirmation to get involved in this trade.

USOIL: Remaining Stubborn within the RangeUSOIL has managed to stay slightly above the PCZ of a Bearish Butterfly as well as to not break down any trendlines and avoid the bottom of the Range; However, Despite how strong it may look it still has dailed to break structure and it has been showing lots of Bearish Divergence. So long as the range holds i suspect that we will trade back below the 1.618 and eventually go for the Bearish Break Down Targets that could lead to a Bearish 5-0 to take us down to Atleast $56.27.

NZDJPY - Combo TradeWe could be a bit early for this 5-0 Pattern trading setup. That is because the daily chart has not confirmed; the candlestick pattern confirmation is required.
I pull the trading confirmation of the 1-hourly chart. This is a trading management I've been using and refining for the past 5years.
There are 2 kinds of trading management for the such combo.
ComboTrade - Valid trading setup off the higher timeframe, but we engaged the trade on the smaller timeframe
UpsizeTrade - Valid trading setup on the smaller timeframe and final target stretch to complete the higher timeframe.
Both are high-risk trade management, which means the chances of stop-loss being hit are higher, but the profit factor(reward) is amazing.
Of the two selections, upsize trade has the higher risk.

NASDAQ100: Hidden Bearish Divergence at PCZ of Bearish 5-0The Nasdaq has made a 50% Retrace to the PCZ of a Bearissh 5-0 while showing Hidden Bearish Divergence just below the Supply Line of the Equidistant Channel; I think it will continue down from here. I don't however have a strong bearish opinion on the other Indexes, just the Nasdaq because the Nasdaq in particular has not presented us with Potentially Bullish Arguments like the other indexes have.

AUDUSD: Bearish 5-0 on Quarterly Timeframe Seaking 50% DeclineAUDUSD has this strange Inverse Cup with Handle / Bearish Head And Shoulders sorta look to it, but more clearly, it has formed a very real Massive Bearish 5-0 that has been in the making for many years and it has recently tested the PCZ as resistance at the 50% retrace and confirmed it with huge amounts of MACD Hidden Bearish Divergence. If this plays out fully, then we can expect that the Australian Dollar to lose well over 50% of its value from here out.

BTC/BVOL Bullish Continuation, VIX Bearish BAMM, DXY Bearish 5-0BTC looks to be continuing the move it started yesterday after hunting for the stops below the POC and then defending the EU Brinks Box During the US Brinks session.
BVOL is Bullishly Diverging at the lows Signaling a rise in BTC Volatility is imminent.
The SPX is Bouncing off of a Liquidity Zone and off of the 1.618 Extension PCZ of a Bullish Shark that may now take it back to the supply line and confirm a Partial-Decline for the second time.
The VIX S&P Volatility Index seems to be struggling at the Moving Averages and setting up for a Deep Crab Bearish BAMM that will take it down to $14
The DXY is showing weakness at the PCZ of a potential Bearish 5-0 that will probably take it down to equal or lower lows than the previous low.

NZDJPY - Bearish 5-0 PatternIf you are looking for a Bearish Trading Opportunity, a Bearish 5-0 Pattern gives us a trading opportunity to do so.
What's not so nice about this trading setup, is that the RSI is not at the overbought position.

AUDCAD - 5-0PatternA Bearish 5-0 Pattern give traders who want to look for a shorting opportunity, an opportunity to engage the trade. It is important to wait for 3bar reversal and not seeing candle break above and close above the red dotted line for the minimum confirmation.

BTCUSD: Bullish Cypher at Weekly Support Congestion ZoneBTC leading to the Fed SPeaking in the 21st may see a rally from the Support Zone it's been trading within. It formed this Bullish Cypher/Shark on the Daily and rallied about 61.8% of the way before failing and pulling back down again. This sorta action is very dangerous as it makes me think it could be a Bearish 5-0 that could lead to us making a lower low and if we do that we will likely come back down to atleast the 786 retrace below at 17.8k. But as of right now the move down to PCZ of this Harmonic has been fast and on above average volume with a wide spread so i believe that we have a high chance of recovering the bearish price action and trading back to the top of the range as the new trading week begins, and if we break above the range we could see a secondary target of $26.5k
