THE KOG REPORTTHE KOG REPORT:
In last week’s KOG Report we said we would look for price to hold that lower region and then attempt the incline into the higher defence where we expected a RIP. That move completed successfully giving our traders not only the opportunity to long but to capture the retracement as well. We then said we would stick with the plan and aim for the target on the break which we completed on Friday to close off.
It was a 100% week in Camelot, every target hit to the pip including another successful red box and hot spot week.
So, what can we expect in the week ahead?
With news over the weekend, we could gap again on the open like last week. Thankfully, none of our trader’s gap chase unless we see a clear sign, so please remember that again this week. We have the bias level 4520 which is the level that needs to break open to then target the 4555-8 region where one of our targets is sitting. Below we have support initially at the 4404 bias level but below that 4485.
The ideal scenario here is a pull back into the 4485-75 region and for price to hold! Above we have a key level 4420, that would be the first target and hurdle. Based on these levels we could see this become the potential range, so please play caution.
Our level of interest this week stands at the 4440-35 which will be the bullish above bias and the potential level for price to attempt being 4465.
RED BOX BIAS:
Break above 4520
Break below 4504
Please do support us by hitting the like button, leaving a comment, and giving us a follow. We’ve been doing this for a long time now providing traders with in-depth free analysis on Gold, so your likes and comments are very much appreciated.
As always, trade safe.
KOG
Bestindicator

Volume-Based Market AnalysisUsing Indicators:
Smart Money Support/Resistance and ATAI Volume Analysis with Price Action V1.03
Analytical Configuration
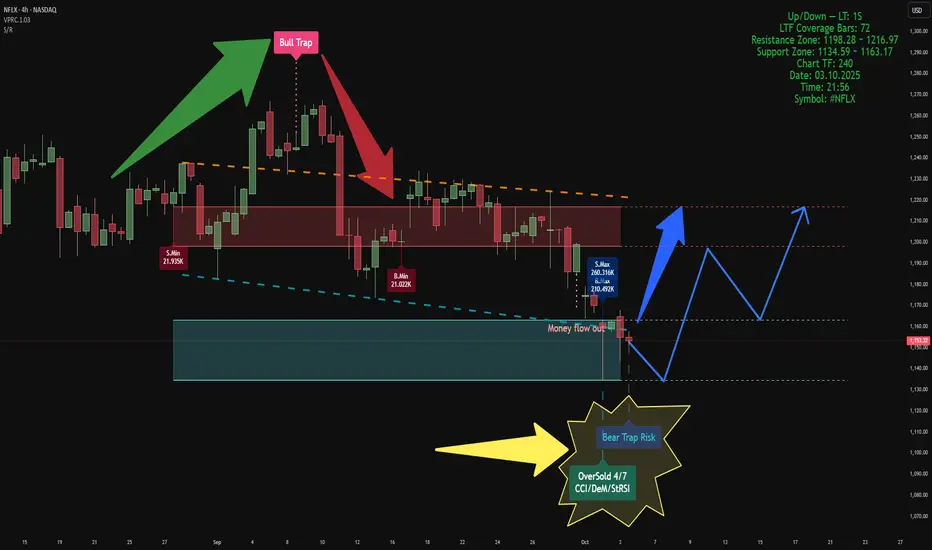
This analysis combines two advanced indicators. The calculation period for both has been set to 52 bars, based on a lower timeframe of 1 second (1S), which provides 72 valid LTF candles. This configuration ensures that volume-based calculations remain within the valid data window for maximum accuracy.
Current Market Context
On the latest candle, a Bear Trap Risk signal appeared right after detecting an OverSold condition. This combination usually suggests weakening selling pressure near the end of a bearish leg and indicates the potential for buyer reaction. At that candle, both buy and sell volumes reached their highest values within the 52-bar window, but sellers maintained a slight advantage — approximately 260K sell volume versus 210K buy volume. This dominance by sellers in the OverSold zone reinforces the concept of volume exhaustion
Key Zones
• Support Zone: 1134 – 1163 USD
• Resistance Zone: 1198 – 1217 USD
Price is currently oscillating between these two zones. Based on the data, a short-term move toward the lower edge of the support zone is possible. If strong support holds, a rebound toward the upper boundary of resistance can be expected to retest or potentially break above it.
Structural Observation
In previous data, ATAI identified a Bull Trap at the resistance zone, which initiated the current bearish leg. Now, the emergence of a Bear Trap Risk near the support boundary is an intriguing reversal signal. If this trap functions similarly to the previous Bull Trap but in the opposite direction, we could expect a movement from the support base toward the resistance ceiling in the upcoming phase.
Summary
According to both indicators’ volume-based calculations, this is the most probable short-term scenario. However, this analysis is purely technical and volume-driven, and does not constitute any form of financial or investment advice.
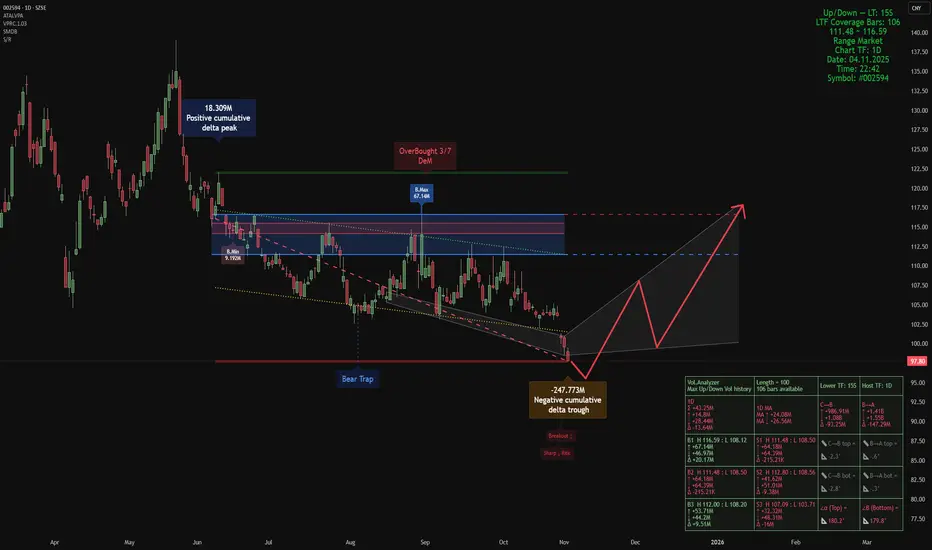
Smart Money Composite View — BYD Company Limited Class ASmart Money Composite View — #002594 (1D), BYD Company Limited Class A
Indicators used:
• Smart Money Support/Resistance
• Smart Money Dynamics Blocks (Pearson Matrix)
• ATAI •Volume Pressure Analyzer v1.2 — Pure Up/Down (Editorial Pick)
We fuse these three into a single composite read. With offset = 48, the setup highlights where price sits relative to smart-money demand/supply, how liquidity is being absorbed, and where momentum can re-emerge.
Market read (composite)
• Price is trading below the 112–118 supply block, which currently acts as the dominant resistance. The failed attempts into this band and the overhead “OverBought” tag mark it as the active sell wall.
• The current swing printed a large negative cumulative delta trough (~-247.8M) right at the lower reaction zone (bear-trap baseline + descending structure). That’s classic absorption of aggressive selling rather than fresh distribution.
• Wing geometry is near-flat (α≈180° / β≈179.8°), signalling compression: momentum has bled off while liquidity rotates. This is typically the pause before a directional decision.
• The grey path on the chart sketches the logical reaction sequence: a relief leg first into the mid-band (~108), where supply should be re-tested, and—only if absorption continues—an extension toward 112–118. Until price reclaims and holds above ~108, the structure remains a redistribution risk under that supply.
Invalidation: A decisive close below the recent trough low (the bear-trap baseline on the chart) would negate the recovery sequence and opens lower prices.
This analysis is a personal market view and is not investment advice.
Smart Money Support/Resistance + ATAI Volume Analysis —PracticalApplication
When these two indicators work together — Smart Money Support/Resistance (Lite) and ATAI Volume Analysis with Price Action — the chart begins to speak a clearer language: one defines where the reaction zones form, and the other explains what happens inside them. The purpose is not prediction but understanding the balance between smart money pressure and retail momentum.
1. Parameter Alignment
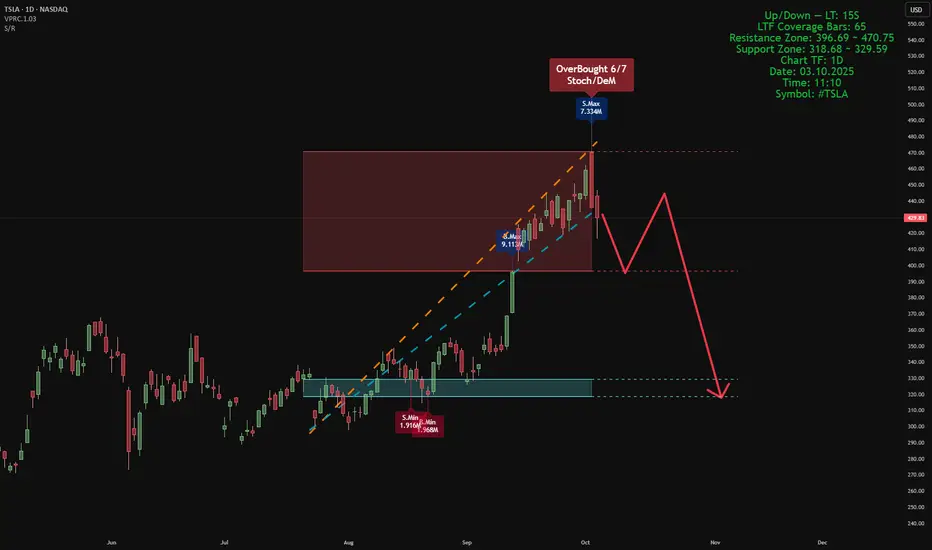
On the right side of the chart, the green info panel confirms that both indicators share identical configurations. In this example, the lookback period is set to 52, chosen deliberately because it must be smaller than the total number of LTF coverage bars (65). For the Smart Money Support/Resistance indicator, the projection is set to 26 — extending the detected zones forward without adding excessive visual noise. This alignment is crucial; mismatched parameters can desynchronize volume readings and structural boundaries.
2. Reading the Chart
In this sample chart, the upper red area represents a Smart Money resistance zone — a region of concentrated selling pressure detected from lower timeframe volume. Simultaneously, ATAI Volume Analysis signals an Overbought (6/7) condition, meaning multiple oscillators confirm exhaustion while seller volume (S.Max) begins to outweigh buyer volume (B.Min). This overlap suggests that liquidity has shifted and the prior bullish impulse is weakening. From here, price may consolidate within the zone or initiate a structured retracement toward the blue support area, previously defined by accumulation volume. The red projected path simply visualizes one potential structural scenario; it is not a prediction or trade signal.
3. Broader Context
This example serves only as a demonstration of how these two tools interact when properly tuned. Different assets and timeframes naturally yield unique structures and behaviors, yet the principle remains consistent: define the territory first with Smart Money Support/Resistance, then interpret market behavior within it using ATAI Volume Analysis.
This content is for educational purposes only — not financial advice. User feedback and practical observations play a key role in refining future versions of both indicators.
ALERT: ALT SEASON INCOMING? 🚨 ALERT: ALT SEASON INCOMING? 🚨
Take a close look at the BTC/ETH chart — we’re seeing early signs of a major rotation out of Bitcoin and into Ethereum and altcoins. Historically, when the BTC/ETH ratio starts to fall, it's a clear signal that capital is flowing into altcoins, marking the beginning of alt season.
🔍 The ratio is showing bearish divergence and approaching a key support zone. If this level breaks, ETH is likely to outperform BTC significantly — and we all know what follows: altcoins explode.
📉 BTC dominance is stalling, ETH gaining strength, and altcoins are waking up. The market is shifting. Don't get caught late.
🚀 Get ready. The alt season might just be starting now.
#AltSeason #Crypto #BTC #ETH #TradingView #CryptoTrends

For Educational purpose only.The primary objective of the trading strategy is to generate consistent returns while managing risk effectively. Define whether you are trading for short-term profits, long-term growth, or a combination of both.

Gold CFDs at Critical Juncture: $2,800–$2,900 Range Dictates Xauusd "Gold" is bullish in long term but in short tem it will be more downward and short positions are strong we have to trade accordingly. As it has break the trend line and make some candles in downward so we have to take proper entry for short time.
Wait for a confirmed breakout/breakdown before committing to larger positions. Scalping is viable if price oscillates within the $2,800–$2,900 range.

How I identify the best forex pairs to trade:Here is how I identify the best forex pairs to trade:
In the top left panel, the indicator 'Compare Forex' displays the PERFORMANCE of each major currency.
The USD (red line) has been the strongest currency for the past 2 months on H6 charts.
By identifying the strongest currency, all that remains is to trade the USD against all the other currencies since they are weaker.
= Smooth stress-free charts.
I look at my trades 2-3 times a day to see if they are still blue or red. Takes a few minutes.

Indicator Paper Trade Battle! Noro's Triple RSI vs. Project XIndicator Paper Trade Battle: Noro's Triple RSI Vs. Project X 📈💥
In this exciting video, we’re putting two powerful trading indicators head-to-head in a paper trade battle: Noro's Triple RSI vs. Project X. Watch as we analyze and compare their performance to determine which one comes out on top!
We’ll cover:
-Detailed breakdown of Noro's Triple RSI and Project X indicators
-Step-by-step analysis of paper trades using each indicator
-Real-time comparisons and insights on their effectiveness
-Key takeaways to help you decide which indicator to incorporate into your trading strategy
Join me for this thrilling showdown and see which indicator proves to be the best for capturing profitable trades. Don't forget to like, comment, and subscribe for more trading battles and expert analysis. Let's find the ultimate indicator together! 🚀📊 And remember to hit the Boost Button on this video to support our Trading View community!

VedantaVedanta Limited is an Indian multinational natural resources company that primarily operates in the fields of oil and gas exploration, production, and processing; metals and mining; and power generation. Vedanta Limited is a subsidiary of Vedanta Resources Limited, a global diversified metals and mining company.

ADA Cardano Potential Retracement SoonIf you haven`t bought ADA just before the rally:
Then using the Fibonacci Retracement tool, I believe there will be a new buy opportunity in the $0.58- $0.62 range!

GBPNZD 111 PIP GAIN!!! KLS GBPNZD provided a beautiful trade set up using our KLS tool. The Key Level system indicator provides us with two key levels multiple times throughout the trading week. Once higher timeframe aligns and parameters are met, then two key levels will appear on your chart automatically.
We achieved a nice 2:1 trade set up with GN for a nice 111 pips profit.
1st key level 2.04203. Blue Line
2nd key level 2.03747. Red Line
How to determine directional bias?
with the KLS you cut your analysis and chartime in HALF. Directional bias is determined by key level placement order.
Blue Key level (KL) above Red KL = Bullish sentiment. Look to take longs only
Red Key Level (KL) above Blue KL = Bearish sentiment. Look to take shorts only

Expectations for CADJPYAn entire breakdown as to what I expect CDADJPY to do this week coming up. I also go over what I use to determine these movements. How I look at the market, how I can be 90% winning and growing my account every week. The chart looks crazy but I explain why.

how to utilize orderflow to your tradingif you don't trade orderflow, you are somewhat guaranteed to loose money. see how i utilize orderflow to my trading

what is the right timeframelearn the truth about timeframe. the hidden truth that is hiding in plain sight

XAUUSD.GOLDXauusd might retest the resistance before falling, but in case if it breaks support then we will wait for retest and then take a sell order And we can see that Golden indicator is also showing us bearish movements.

GODREJCP Long Buy Idea🏆GOFREJCP new buying opportunity in daily TF.🔥
Stock supertrend beakout . & traded near automated trendline support area. same big trend is bullish & after short selling one buying movement start in this stock.
Daily RSI level is Above 60 & lower timeframe RSI level above 60 bullish🟢. same time Weekly & monthly RSI is near 53.so one chance to upside movement.
so if stock again touch near 865 level buy it small & Stoploss is near 845 & target is 🎯957
watchout stock chart for better understand technical analysis.

👑 THE UNCROWNED BEST INDICATORS PT.1That's the Part.1 of my collection of Uncrowned best indicators for trading.
I choose to call this post " uncrowned " because these indicators are firstly free resources and second well utilized and combined are much better than most of the paid indicators.
Often the best indicators are forgotten just because seem too basic or have no marketing behind them.
I can assure you, the top perform algorithm traders at least use for sure one of these 5 indicators. ( or more.. )
Making a great algorithm requires time to find the right combination of indicators and patience in backtesting.
If you don't know some of these indicators, I suggest you have a look, you can find them for free here in Tradingview.
N.1 AROON
The Aroon indicator is a technical indicator that is used to identify trend changes in the price of an asset, as well as the strength of that trend. In essence, the indicator measures the time between highs and the time between lows over a time period. The idea is that strong uptrends will regularly see new highs, and strong downtrends will regularly see new lows. The indicator signals when this is happening, and when it isn't.
The indicator consists of the "Aroon up" line, which measures the strength of the uptrend, and the "Aroon down" line, which measures the strength of the downtrend.
The Aroon indicator was developed by Tushar Chande in 1995.
Here is an Idea of how to use it, very basic. You can combine this indicator with your own favorite ones to create your best strategy.
Check the settings to find the right setup.
N.2 STOCH RSI
I personally love The Stochastic RSI. This indicator as the normal stochastic shows ranges between zero and 100 and is created by applying the Stochastic oscillator formula to a set of relative strength index (RSI) values rather than to standard price data. Using RSI values within the Stochastic formula gives traders an idea of whether the current RSI value is overbought or oversold.
The StochRSI oscillator was developed to take advantage of both momentum indicators in order to create a more sensitive indicator that is attuned to a specific security's historical performance rather than a generalized analysis of price change.
The StochRSI was developed by Tushar S. Chande and Stanley Kroll and detailed in their book "The New Technical Trader," first published in 1994. While technical indicators already existed to show overbought and oversold levels, the two developed StochRSI to improve sensitivity and generate a greater number of signals than traditional indicators could do.
The StochRSI deems something to be oversold when the value drops below 20, meaning the RSI value is trading at the lower end of its predefined range, and that the short-term direction of the underlying security may be nearing a low a possible move higher. Conversely, a reading above 80 suggests the RSI may be reaching extreme highs and could be used to signal a pullback in the underlying security.
Along with identifying overbought/oversold conditions, the StochRSI can be used to identify short-term trends by looking at it in the context of an oscillator with a centerline at 50. When the StochRSI is above 50, the security may be seen as trending higher, and vice versa when it's below 50.
The StochRSI should also be used in conjunction with other technical indicators or chart patterns to maximize effectiveness, especially given the high number of signals that it generates.
N.3 ATR Average True Range
I think the ATR is the base of any algorithm or at least every algorithm trader has at least one setup with this indicator to calculate the Stop loss or the Take profit or both together.
The average true range (ATR) is a technical analysis indicator, introduced by market technician J. Welles Wilder Jr. in his book New Concepts in Technical Trading Systems, that measures market volatility by decomposing the entire range of an asset price for that period.
The ATR may be used by market technicians to enter and exit trades and is a useful tool to add to a trading system. It was created to allow traders to more accurately measure the daily volatility of an asset by using simple calculations. The indicator does not indicate the price direction; rather it is used primarily to measure volatility caused by gaps and limit up or down moves. The ATR is fairly simple to calculate and only needs historical price data.
The ATR is commonly used as an exit method that can be applied no matter how the entry decision is made.
N.4 The Bullish and Bearish Engulfing
Well, this indicator, free by tradingview show exactly the presence of Bullish and Bearish reversal made from Engulfing pattern.
It can be a great confirmation indicator for your strategy if used together with other indicators inside your algorithm.
N.5 WAE - Waddah Attar Explosion
Last but not least, an incredible free indicator. Great for confirmation entry as well as Volume and trend direction.
Trading volume can help an investor identify the momentum of a currency pair and confirm a trend. If trading volume increases, prices generally move in the same direction and can provide a heads-up if volume diminishes. Once volume begins to diminish and the fuel for the trend starts to dry up, a reversal or ranging market may be on the horizon. This particular volume indicator has only three components to interpret, visually straightforward, easy to understand, and user-friendly.
I hope at least one of these Five uncrowned indicators will become part of your arsenal.
Please, support my work with likes and comments!

The BEST Trading IndicatorWith the ever increasing number of indicators, it makes sense that beginner traders’ wish to cut the steep learning curve by trying to find which indicator is the best and the most profitable to choose from.
It’s overwhelming to start trading with so many jargon terms like, the MACD, RSI, Stochastics, ADX, Bollinger Bands and so on…
Luckily, you won’t ever have to worry about any of these indicators.
Here’s why…
The quest to find the perfect trading indicator
There is a big misconception when it comes to learning how to trade.
Most new people start by going onto Google to search for the ‘best trading strategy’ or the ‘best trading indicator’ to speed up their success.
Everybody wants to find that perfect trading indicator that will help them profit 80% to 100% of the time.
Yet, at most, there are only 5% of traders’ out there who are able to make a consistent income with trading.
I have two main reasons on this matter, which I’ve gathered since 2003.
Reason 1:
All indicators are history
With local and international markets such as the stock market, Forex and even with crypto-currencies, there are billions of rands traded every day.
With the ongoing economic, socio and political events taking place, every transaction from either a company, private individual or even a bot is entirely unique and UNEXPECTED.
So which indicator is the best to choose from?
Well before you go and do research on each indicator there is to trade with, let me spare you the time and tell you this…
Every technical indicator and oscillator out there, is based on one thing.
HISTORICAL DATA.
When you add an indicator onto a chart, it can only show one of three things which are either the:
Current momentum.
Current trend direction or the.
Demand and supply based on buying and selling volume.
Not one indicator has any form of predictive qualities. Even with the dawn of Artificial Intelligence and Quantum Computing, there will most likely never be that one indicator that will be able to predict the future with accuracy and certainty every time.
However, let’s say there is that one Quantum Computer that is able to take every news event, internal and external factor into account. The information assembled and collected, will still be based on past data.
By now you may be feeling like your life has been a lie with all the marketing fluff out there with the 100% win-rate and get rich quick scams, but I assure you there is one legit way to succeed from trading.
Reason 2:
Each element is essential
It doesn’t take just one trading strategy to bank a consistent income.
It doesn’t take just a few rules to follow and,
It doesn’t take a whole lot of money to fund your account to make it as a trader.
No, in actual fact it takes four equally important elements namely:
MARKETS:
You need to find the best markets that are out there to trade and when to trade them.
METHOD:
You need to create or adopt a proven trading strategy that will fit your personality. (Price action with a few patterns is all that's needed to spot probability trades).
MONEY:
You need to have just a couple of money management rules, to follow every time you take a trade.
MIND:
You need to find a way to develop trading self-confidence as well as a strong mindset throughout your career.
This is where so many different trading companies, publications and even education institutions seem to miss the mark.
They either specialise ONLY in psychology, trading analysis or just on money management. Unfortunately, this is one hobby or lifestyle where being an expert in ONE field will not guarantee your success.
ETH Breaks Through Resistance! What's Next?In this post I'm going to cover important support/resistance levels on Ethereum and where I think we're going from here.
As you can see from our last post, ETH rejected perfectly off of the 1229 level and hit our support of 1150 to the tee on Nov 28th! Since then, it's been on a steady uptrend and recently broke that 1229 level and exploded to 1300!
The next big resistance I'm looking at is 1367. This was the previous resistance for most of Oct and I can see us rejecting there at least once. Right now we can see the Wave Fusion indicator flashed two Blood Moons which took us from 1315 to 1280. Right now I'm looking at 1274 as being the micro support on the hourly as it also coincides with the trendline support. If that breaks, I'm looking at 1229 to act as our new MAJOR support as it was resistance 3 times in the past week. If we end up breaking that, then I'm afraid we could go all the way down to 1150 again.
I'm waiting for a buy signal on Wave Fusion before pulling the trigger but closely watching the three support levels mentioned above.
If you have any questions on my technical analysis or indicators used, please leave a comment below or send me a PM :)
Thanks for reading!

MCDOWELL-N New HIGH in Future Days 🔥🏆🎯Watchout Chart For Better Understand in technical analysis help🎯🎯

Called the ETH Short! What's the Next Target?Using our latest indicator "Wave Fusion" combined with support/resistance lines enabled us to call the ETH short and catch the recent drop! On the ETH 1hr chart, you can see I've drawn various support/resistance levels combined with my Wave Fusion indicator below. In the past, this indicator has show to be very accurate with calls (rocket symbol the long from 1172 to 1229) and the red shaded area called the short (from 1229 to the current level of 1167). By combining the resistance level of 1229 and the short indication we received, we were able to accurately take a short position with our stop just above the recent high.
Right now I'm looking at 1150 as being the next micro support (based off that level holding on the 23rd) and 1098 being the major support (as it's held multiple times in the past). I'll be looking for Wave Fusion to post a buy signal (green shaded area, green diamond, rocket, or moon) as ETH gets close to either support level. If we have that, we can be more confident in our trade until we reach that 1229 resistance.
If you have any questions on the indicators mentioned here, or how to use support/resistance lines, please comment below, send me a DM, or check any of my links next to my profile picture. I also released a video on how to use the Wave Fusion indicator on my YT.
Thanks for reading!

