Why MCD Will Yield a 10% in WeeksWhy MCD Will Yield a 10% in Weeks
NYSE:MCD is one of those companies that may seem so immense that it’s hard to imagine the stock having much room to grow.
However, the reality is that its expansion plans remain ambitious. In 2026 alone, the company expects to o pen more than 2,000 new restaurants. Furthermore, its recent marketing campaigns are performing very well in key segments, successfully winning back lower-income customers who had drifted away from the brand due to inflation .
From a technical perspective , this fundamental strength is reflected in an ascending triangle.
This pattern shows how investor confidence has steadily built up, eventually pushing NYSE:MCD to break through the $321 resistance level that capped gains throughout 2025.
The initial targets for this breakout sit at 7% and 13% , depending on which Fibonacci levels are used as a reference.
This is particularly important because the stock is now entering uncharted territory. Without previous price action to guide us, Fibonacci levels become our primary tool for identifying targets.
Do you believe MCD can continue to deliver strong returns in the stock market as it has in recent years?
👇 WANT MORE?
🚀 Hit the rocket, read my profile and follow so we can find each other again.
Beyond Technical Analysis

NAS100 - 2ND TRADE TODAYTeam, Earlier we hit our 1st target range, I ALSO mentioned to booked partial 30 when it hit above 24815
We are now re-entry at 24725 - 24715
STOP LOSS at 24650
NOTE: once it break above 24760, bring stop loss to BREAK EVEN
Target 1 at 24760-80
Target 1 at 24815-24845
Target 3 at 24865-24915
NOTE: if stop loss hit, wait for entry around 24400- will keep you update.
Lets go

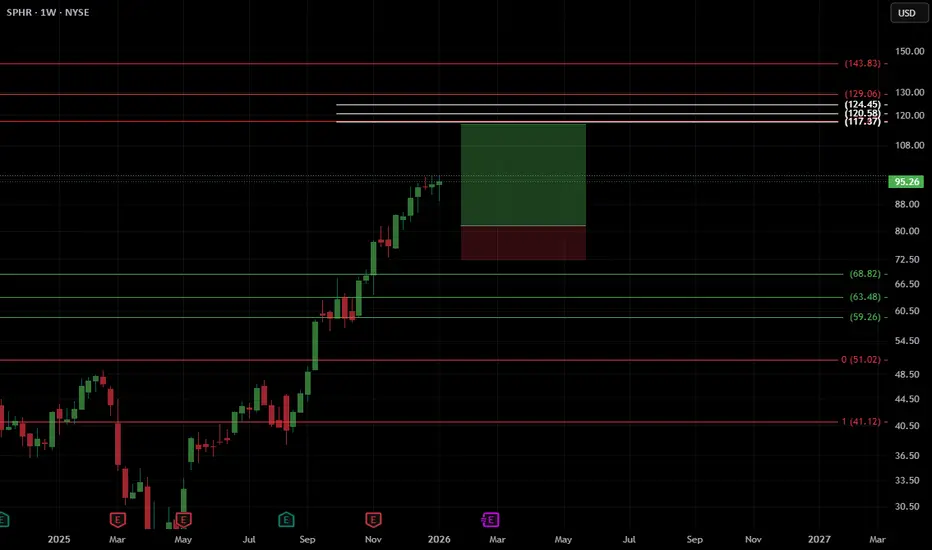
$SPHR , SetupEntry : 82
TP : 117.37
SL : If you wish
⚠️ Financial Disclaimer:
This post is not financial advice. I am not your financial advisor, your life coach, or your legally responsible adult.
Always do your own research and never trade based solely on internet comedy.
Pure Storage (PSTG): Re-Accumulation Base + AI Context/StorageOverview Summary
We’re tracking NYSE:PSTG as a core exposure within Green Zone Capital’s "AI-Physical Bottlenecks" thesis, specifically the storage/data-throughput/context layer that supports enterprise AI, inference workloads, and the broader data-center buildout.
After a strong expansion leg, PSTG has pulled back and is now consolidating above a well-defined weekly demand zone (~$65–$75). This region has acted as a structural pivot multiple times and is now being defended again, suggesting re-accumulation rather than distribution.
From a broader lens, AI is not just a compute story and is more-so a data movement and storage story. As more enterprises deploy AI workflows, storage performance, efficiency, and reliability become increasingly critical constraints. PSTG fits directly into that multi-year backdrop, while the chart presents a clean technical structure to frame risk.
Green Zone Capital remains bullish on PSTG with a long-term horizon, and will continue to scale into strategic pullbacks within the broader uptrend. Our current setup is:
Bias: Long
Type: Long-Term Accumulation
Entry Zone: $60–$75
Target Zone: $150–$160+
Invalidation: Weekly Close below ~$55
Technical Analysis
PSTG is currently holding a multi-touch weekly base where prior resistance has flipped into support. The chart shows a clear sequence of higher lows into the 2024–2025 breakout, followed by a corrective pullback that has now stabilized inside a re-accumulation range.
The key signal here is behavioral: after the prior impulse move, price retraced and is now absorbing supply rather than breaking down. A sustained hold above this zone increases the probability of a trend continuation move, first toward a retest of the prior swing highs, then into a broader continuation leg.
If this base holds, PSTG has room to re-enter expansion mode and work toward the next major upside objectives aligned with the longer-term trend structure.
Macro/Fundamental Thesis
The AI cycle is driving an unprecedented demand curve for data storage, retrieval, and throughput. Training, inference, and enterprise deployment all depend on rapid access to massive datasets, making storage a non-optional infrastructure layer.
As data centers optimize for scale, power, and performance, efficient storage architecture becomes increasingly important. This ties directly into the “physical layer” reality of AI: the bottlenecks aren’t only chips, they’re power, cooling, networking, and storage systems that keep compute productive.
Pure Storage sits in the path of that structural trend. If AI adoption accelerates across enterprises (and not just hyperscalers), the storage layer becomes one of the clearest second-order beneficiaries, positioning PSTG as a compelling long-term compounder when paired with a technically-defined accumulation zone.

ISM over 50 is Needed for Bull, but Liquitity / Debt Lowest...The ISM is finally pushing back above 50, which has been required for each of the last 2 major 'Bull Markets' prior to 2025.
But the last bull market didn't even get close.
What is the likely outcome?
Also the ratio of US Net Liquidity + M2 Money Supply / US Debt (FRED) continues to head lower to the lowest levels ever recorded.
Right now, ISM has finally pushed back above 50, which says “manufacturing is growing again.” At the same time, the “US Net Liquidity + M2 / US Debt” ratio is near record lows, which tells us debt is still compounding faster than true liquidity and money in the system.
The surface data looks healthy, but the cushion under the system is getting thinner.
In that context, the Fed quietly stopped QT in December 2025 but hasn’t officially launched QE.
That’s a classic halfway house: they’re no longer draining liquidity, but they’re not yet openly printing to support markets or the government’s interest bill. They know rates have already made the federal interest tab uncomfortably large, but they don’t want to wave a big “we’re monetizing the debt” flag while ISM and growth data look okay.
So what are they likely to do next?
Go slow on cuts: They’ll talk tough on inflation and only cut gradually, trying to lower the average interest cost on the debt over time without admitting that’s the real goal.
Use stealth liquidity tools: With QT over, the next steps are more behind‑the‑scenes—managing reserves, using repo facilities, and working with Treasury on issuance—before they ever label anything “QE.”
Lean on financial repression: Over the next few years, the path of least resistance is to let inflation and nominal growth run just enough above real rates to slowly erode the debt burden, instead of “fixing” it with real austerity.
For traders and crypto investors, the key takeaway is: today’s mix (ISM back in expansion, QT stopped, but no official QE and a worsening debt/liquidity ratio) is a setup for choppy policy and periodic “something broke” moments.
Each time stress appears, the odds rise that the Fed shifts from this quiet pause into more obvious liquidity support—historically the windows when Bitcoin, gold, and other scarce assets tend to outperform.
Either way, will be watching to see if the ISM can continue climbing, or if this is a classic Bear Flag pattern. Macro metrics don't usually follow standard 'TA' patterns, but since they're all based on human psychology, we'll see.
I think markets continue lower to BTC $50k, until Sept/October. But we'll have to see!

2 Wins and a Loss! Down $200. Learn From My Mistake.I'm learning how to adjust to a max loss of $200 for the day, and I'm struggling because of it. Keeping stops tight and adding to winning positions IS the way to go, but this video shows how not to do it. Instead of having an "unlimited" take profit (which will work maybe 5-10% of the time, have a fixed RR, even if it's 1:1.
Remember, the higher the RR, the lower your win rate. Find something that works for you. Don't blindly copy someone else's strategy; that almost never works. Also, don't pay for courses, signals, or anything anyone else is peddling. Everything you need to know about trading is available free online.
Trade 1 micro with an RR of 1 and see how your psychology changes. Take your time. You'll get there. Expect it to take more than a year. Give yourself credit for not giving up.
Trade smart, manage your risk, and be well.
Terry

GOLD : (Scalp Trade Recap Before Drop)(Gold Trade Recap) - gold managed to push up to a fair amount before tanking down ,so if you had an (SL) to (BE) or (Partial Profit) then means you should be in on some blues or (50/50 /Entry)
(My Trade Recap) - Entry : 5059.612
(TP)- 5074.212
(SL) - 5031.636
That’s a trade we had early on today ,stay tuned for more updates however the market conditions seem to be changing, so be carefully cautious

USD/JPY Short Intra-Day Opportunity (ACT NOW)A demand zone was broken on the 15m timeframe creating a bearish zone of inflection. This is a strong opportunity to go short. I recommend going down to 1m timeframe and allowing price action to dictate your entry, it is 16:1 as is but tightening up on the 1m timeframe could multiply that to an even higher R.
Potential: 16R
Probability of entry follow-through: 20%
This is just an opportunity. Once follow-through occurs, take trade to the blue zone shown in illustration. If you obtain an unrealized profit of more than 5R consider protecting your efforts by trailing internal structure until trailing stop loss is hit or target is reached.
IF PRICE CLOSES ABOVE THE BEARISH ZONE OF INFLECTION, SCRAP THIS SETUP AND RE-EVALUATE APPROACH.


$RDW , SetupENTRY : CMP
TP1 : 12.68
TP2 : 28.65
TP3 : 43.84
TP4 : 89.43
SL : If you wish
My SL is never a SELL, just an alarm to stop adding money and wait for better dca
Follow, Boost, Thank You !!
⚠️ Financial Disclaimer:
This post is not financial advice. I am not your financial advisor, your life coach, or your legally responsible adult.
Always do your own research and never trade based solely on internet comedy.

GOLD Consolidation Both sides Phase Gold remains in a tight consolidation phase, with price action moving sideways as investors wait for a decisive breakout. The metal slipped toward the 5050 area today, trimming gains from the previous session as expectations for aggressive Federal Reserve rate cuts were slightly reduced.
Despite the recent NFP release, the market failed to deliver a strong directional move. Instead, gold continues to trade within a broad 5000–5100 range, reflecting indecision and balanced momentum between buyers and sellers. This compression suggests that a sharp move could follow once a clear breakout occurs.
From a technical perspective, a sustained break above 5110 could trigger bullish momentum, opening the door for upside targets near 5127 and potentially 5165. On the other hand, failure to hold current levels may renew selling pressure. A drop below 5000 would expose the key support around 4935, which stands as a major downside level.
You may find more details in the chart,
Trade wisely best of luck buddies,
Ps; Support with like and comments for better analysis Thanks for Supporting.

ETH — Price Slice. Capital Sector. 1663.24 BPC 8.1© Bolzen | The Architect | BPC Framework
Bolzen Market Institute
🏷 ETH — Price Slice. Capital Sector.
Publication date on TradingView: 12.02.2026
🏷 1663.24 — at the time of publication, the price had not been reached.
🏷 BPC — The Bolzen Price Covenant — Strength Index: 8.1
The energy block reflects the intentions of capital. The direction of capital flow is determined dynamically. The key mechanism of liquidations lies in the tendency of price to gravitate toward areas where real participants of the system are concentrated — regardless of whether they are in longs or shorts.
Such zones represent areas of asymmetric advantage: when the price approaches them, some participants are forced to close positions at a loss, others lock in profits, and a third group (institutional players) uses this flow to enter in the direction of the next concentration zone.
Institutional players generate energy blocks through miners. Subsequently, these energy blocks form the range of capital movement across various timeframes for exchange speculators. However, the ultimate goal in ensuring liquidity is to reach the energy block mark.
The results are presented in the dashboard for the international arena. It is necessary to manually determine, without third-party software, the direction of the impact node and the concentration of real system participants. This is achieved through high cognitive and intellectual effort — without templates and solely through pure chart analysis.
Three-dimensional analytics is intellectual property. The methodology is closed and does not require evaluation from the standpoint of the old world. We offer the ability to think but do not provide trading recommendations and are not educators.
We thank you and regard TradingView as an impartial platform for demonstrating the transition into a new analytical reality.
Quantum structure of obligations and capital movement in price formation within energy blocks.
🏷 Vertical chart — Energy Grid Dashboard.
🏷 Static tape No. 1: The price is published according to the production order of the energy block.
🏷 The energy block price is already ordered — not by time but by the priority of block execution. It is important not to confuse: block priorities dynamically reorganize in response to hidden energetic impulses, while the execution order of prices fixes their manifestation in the market. Each price in the dynamic tape is linked to energy production measurement indicators, unavailable to the general public. Those who see the structure before its manifestation do not follow the price — they anticipate it.
EΞ2Φ8Ψ45Θ·ζ⁻¹·106Λ732·Ω²
📎 Screenshot:
🏷 When trading from levels, use liquidation zones from BPC 10 and higher.
🏷 Bolzen Liquidity Map — ETH (numerical equivalent of the map):
Updated versions of the Bolzen Liquidity Map — ETH are in restricted access.
The permanent Energy Grid Dashboard for ETH and BTC is publicly available and intended for international institutional review.
Dear international community,
I thank the TradingView moderation for their neutrality and support of analytical work on a global scale, as well as everyone who follows my research. This platform serves as a space to demonstrate the contribution to analytical development.
Attention and time are your key resources. ATH — is emotion; timeframes — are your best allies. Thank you.
— The Architect
BPC — The Bolzen Price Covenant

BITCOIN IS GETTING READY FOR A MASSIVE MOVE!!!!! (trap) Yello Paradisers! Enjoy the video!
And Paradisers! Keep in mind to trade only with a proper professional trading strategy. Wait for confirmations. Play with tactics. This is the only way you can be long-term profitable.
Remember, don’t trade without confirmations. Wait for them before creating a trade. Be disciplined, patient, and emotionally controlled. Only trade the highest probability setups with the greatest risk to reward ratio. This will ensure that you become a long-term profitable professional trader.
Don't be a gambler. Don't try to get rich quick. Make sure that your trading is professionally based on proper strategies and trade tactics.

ETH — Price Slice. Capital Sector. 1667.41 BPC 12© Bolzen | The Architect | BPC Framework
Bolzen Market Institute
🏷 ETH — Price Slice. Capital Sector.
Publication date on TradingView: 12.02.2026
🏷 1667.41 — at the time of publication, the price had not been reached.
🏷 BPC — The Bolzen Price Covenant — Strength Index: 12
The energy block reflects the intentions of capital. The direction of capital flow is determined dynamically. The key mechanism of liquidations lies in the tendency of price to gravitate toward areas where real participants of the system are concentrated — regardless of whether they are in longs or shorts.
Such zones represent areas of asymmetric advantage: when the price approaches them, some participants are forced to close positions at a loss, others lock in profits, and a third group (institutional players) uses this flow to enter in the direction of the next concentration zone.
Institutional players generate energy blocks through miners. Subsequently, these energy blocks form the range of capital movement across various timeframes for exchange speculators. However, the ultimate goal in ensuring liquidity is to reach the energy block mark.
The results are presented in the dashboard for the international arena. It is necessary to manually determine, without third-party software, the direction of the impact node and the concentration of real system participants. This is achieved through high cognitive and intellectual effort — without templates and solely through pure chart analysis.
Three-dimensional analytics is intellectual property. The methodology is closed and does not require evaluation from the standpoint of the old world. We offer the ability to think but do not provide trading recommendations and are not educators.
We thank you and regard TradingView as an impartial platform for demonstrating the transition into a new analytical reality.
Quantum structure of obligations and capital movement in price formation within energy blocks.
🏷 Vertical chart — Energy Grid Dashboard.
🏷 Static tape No. 1: The price is published according to the production order of the energy block.
🏷 The energy block price is already ordered — not by time but by the priority of block execution. It is important not to confuse: block priorities dynamically reorganize in response to hidden energetic impulses, while the execution order of prices fixes their manifestation in the market. Each price in the dynamic tape is linked to energy production measurement indicators, unavailable to the general public. Those who see the structure before its manifestation do not follow the price — they anticipate it.
EΞ2Φ8Ψ45Θ·ζ⁻¹·106Λ732·Ω²
📎 Screenshot:
🏷 When trading from levels, use liquidation zones from BPC 10 and higher.
🏷 Bolzen Liquidity Map — ETH (numerical equivalent of the map):
Updated versions of the Bolzen Liquidity Map — ETH are in restricted access.
The permanent Energy Grid Dashboard for ETH and BTC is publicly available and intended for international institutional review.
Dear international community,
I thank the TradingView moderation for their neutrality and support of analytical work on a global scale, as well as everyone who follows my research. This platform serves as a space to demonstrate the contribution to analytical development.
Attention and time are your key resources. ATH — is emotion; timeframes — are your best allies. Thank you.
— The Architect
BPC — The Bolzen Price Covenant

NZDJPY higher bearish expected
OANDA:NZDJPY trend based analysis, short beris h push for expect.
SUP zone: 92.600
RES zone: 91.200, 90.800

ETH — Price Slice. Capital Sector. 1676.35 BPC 15© Bolzen | The Architect | BPC Framework
Bolzen Market Institute
🏷 ETH — Price Slice. Capital Sector.
Publication date on TradingView: 12.02.2026
🏷 1676.35 — at the time of publication, the price had not been reached.
🏷 BPC — The Bolzen Price Covenant — Strength Index: 15
The energy block reflects the intentions of capital. The direction of capital flow is determined dynamically. The key mechanism of liquidations lies in the tendency of price to gravitate toward areas where real participants of the system are concentrated — regardless of whether they are in longs or shorts.
Such zones represent areas of asymmetric advantage: when the price approaches them, some participants are forced to close positions at a loss, others lock in profits, and a third group (institutional players) uses this flow to enter in the direction of the next concentration zone.
Institutional players generate energy blocks through miners. Subsequently, these energy blocks form the range of capital movement across various timeframes for exchange speculators. However, the ultimate goal in ensuring liquidity is to reach the energy block mark.
The results are presented in the dashboard for the international arena. It is necessary to manually determine, without third-party software, the direction of the impact node and the concentration of real system participants. This is achieved through high cognitive and intellectual effort — without templates and solely through pure chart analysis.
Three-dimensional analytics is intellectual property. The methodology is closed and does not require evaluation from the standpoint of the old world. We offer the ability to think but do not provide trading recommendations and are not educators.
We thank you and regard TradingView as an impartial platform for demonstrating the transition into a new analytical reality.
Quantum structure of obligations and capital movement in price formation within energy blocks.
🏷 Vertical chart — Energy Grid Dashboard.
🏷 Static tape No. 1: The price is published according to the production order of the energy block.
🏷 The energy block price is already ordered — not by time but by the priority of block execution. It is important not to confuse: block priorities dynamically reorganize in response to hidden energetic impulses, while the execution order of prices fixes their manifestation in the market. Each price in the dynamic tape is linked to energy production measurement indicators, unavailable to the general public. Those who see the structure before its manifestation do not follow the price — they anticipate it.
EΞ2Φ8Ψ45Θ·ζ⁻¹·106Λ732·Ω²
📎 Screenshot:
🏷 When trading from levels, use liquidation zones from BPC 10 and higher.
🏷 Bolzen Liquidity Map — ETH (numerical equivalent of the map):
Updated versions of the Bolzen Liquidity Map — ETH are in restricted access.
The permanent Energy Grid Dashboard for ETH and BTC is publicly available and intended for international institutional review.
Dear international community,
I thank the TradingView moderation for their neutrality and support of analytical work on a global scale, as well as everyone who follows my research. This platform serves as a space to demonstrate the contribution to analytical development.
Attention and time are your key resources. ATH — is emotion; timeframes — are your best allies. Thank you.
— The Architect
BPC — The Bolzen Price Covenant

ETH — Price Slice. Capital Sector. 1678.40 BPC 26© Bolzen | The Architect | BPC Framework
Bolzen Market Institute
🏷 ETH — Price Slice. Capital Sector.
Publication date on TradingView: 12.02.2026
🏷 1678.40 — at the time of publication, the price had not been reached.
🏷 BPC — The Bolzen Price Covenant — Strength Index: 26
The energy block reflects the intentions of capital. The direction of capital flow is determined dynamically. The key mechanism of liquidations lies in the tendency of price to gravitate toward areas where real participants of the system are concentrated — regardless of whether they are in longs or shorts.
Such zones represent areas of asymmetric advantage: when the price approaches them, some participants are forced to close positions at a loss, others lock in profits, and a third group (institutional players) uses this flow to enter in the direction of the next concentration zone.
Institutional players generate energy blocks through miners. Subsequently, these energy blocks form the range of capital movement across various timeframes for exchange speculators. However, the ultimate goal in ensuring liquidity is to reach the energy block mark.
The results are presented in the dashboard for the international arena. It is necessary to manually determine, without third-party software, the direction of the impact node and the concentration of real system participants. This is achieved through high cognitive and intellectual effort — without templates and solely through pure chart analysis.
Three-dimensional analytics is intellectual property. The methodology is closed and does not require evaluation from the standpoint of the old world. We offer the ability to think but do not provide trading recommendations and are not educators.
We thank you and regard TradingView as an impartial platform for demonstrating the transition into a new analytical reality.
Quantum structure of obligations and capital movement in price formation within energy blocks.
🏷 Vertical chart — Energy Grid Dashboard.
🏷 Static tape No. 1: The price is published according to the production order of the energy block.
🏷 The energy block price is already ordered — not by time but by the priority of block execution. It is important not to confuse: block priorities dynamically reorganize in response to hidden energetic impulses, while the execution order of prices fixes their manifestation in the market. Each price in the dynamic tape is linked to energy production measurement indicators, unavailable to the general public. Those who see the structure before its manifestation do not follow the price — they anticipate it.
EΞ2Φ8Ψ45Θ·ζ⁻¹·106Λ732·Ω²
📎 Screenshot:
🏷 When trading from levels, use liquidation zones from BPC 10 and higher.
🏷 Bolzen Liquidity Map — ETH (numerical equivalent of the map):
Updated versions of the Bolzen Liquidity Map — ETH are in restricted access.
The permanent Energy Grid Dashboard for ETH and BTC is publicly available and intended for international institutional review.
Dear international community,
I thank the TradingView moderation for their neutrality and support of analytical work on a global scale, as well as everyone who follows my research. This platform serves as a space to demonstrate the contribution to analytical development.
Attention and time are your key resources. ATH — is emotion; timeframes — are your best allies. Thank you.
— The Architect
BPC — The Bolzen Price Covenant

Market cycle, Accumulation ,manipulation and distribution week.As I previously said we are going down , with this week having an accumulation phase and during the late stage of the week a mass sell off.
It stopped at 50% previous range so im almost sure tomorrow we will see asia and London going higher and NY am taking the lower side of both session ,lets see for PM but I thing a bit of a retrace will be happening this will be the closing candle of the week .

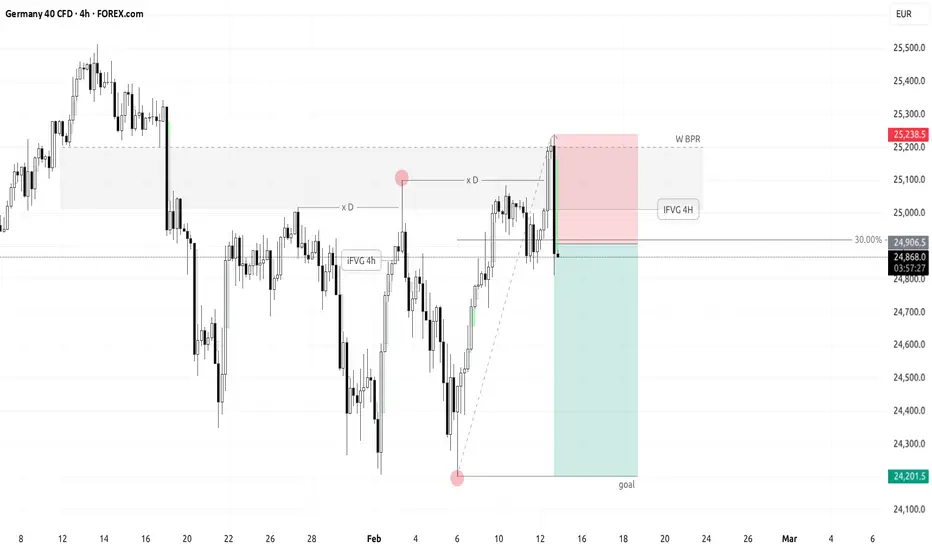
GER40 / SHORT / 12.02.26Entry reasons:
1-daily liquidity sweep within the weekly bearish imbalance
Inversion 4-hour bearish imbalance
30% retracement of the bearish impulse
ETH — Price Slice. Capital Sector. 1692.43 BPC 6.6© Bolzen | The Architect | BPC Framework
Bolzen Market Institute
🏷 ETH — Price Slice. Capital Sector.
Publication date on TradingView: 12.02.2026
🏷 1692.43 — at the time of publication, the price had not been reached.
🏷 BPC — The Bolzen Price Covenant — Strength Index: 6.6
The energy block reflects the intentions of capital. The direction of capital flow is determined dynamically. The key mechanism of liquidations lies in the tendency of price to gravitate toward areas where real participants of the system are concentrated — regardless of whether they are in longs or shorts.
Such zones represent areas of asymmetric advantage: when the price approaches them, some participants are forced to close positions at a loss, others lock in profits, and a third group (institutional players) uses this flow to enter in the direction of the next concentration zone.
Institutional players generate energy blocks through miners. Subsequently, these energy blocks form the range of capital movement across various timeframes for exchange speculators. However, the ultimate goal in ensuring liquidity is to reach the energy block mark.
The results are presented in the dashboard for the international arena. It is necessary to manually determine, without third-party software, the direction of the impact node and the concentration of real system participants. This is achieved through high cognitive and intellectual effort — without templates and solely through pure chart analysis.
Three-dimensional analytics is intellectual property. The methodology is closed and does not require evaluation from the standpoint of the old world. We offer the ability to think but do not provide trading recommendations and are not educators.
We thank you and regard TradingView as an impartial platform for demonstrating the transition into a new analytical reality.
Quantum structure of obligations and capital movement in price formation within energy blocks.
🏷 Vertical chart — Energy Grid Dashboard.
🏷 Static tape No. 1: The price is published according to the production order of the energy block.
🏷 The energy block price is already ordered — not by time but by the priority of block execution. It is important not to confuse: block priorities dynamically reorganize in response to hidden energetic impulses, while the execution order of prices fixes their manifestation in the market. Each price in the dynamic tape is linked to energy production measurement indicators, unavailable to the general public. Those who see the structure before its manifestation do not follow the price — they anticipate it.
EΞ2Φ8Ψ45Θ·ζ⁻¹·106Λ732·Ω²
📎 Screenshot:
🏷 When trading from levels, use liquidation zones from BPC 10 and higher.
🏷 Bolzen Liquidity Map — ETH (numerical equivalent of the map):
Updated versions of the Bolzen Liquidity Map — ETH are in restricted access.
The permanent Energy Grid Dashboard for ETH and BTC is publicly available and intended for international institutional review.
Dear international community,
I thank the TradingView moderation for their neutrality and support of analytical work on a global scale, as well as everyone who follows my research. This platform serves as a space to demonstrate the contribution to analytical development.
Attention and time are your key resources. ATH — is emotion; timeframes — are your best allies. Thank you.
— The Architect
BPC — The Bolzen Price Covenant

NAS1000 - STRATEGYTeam, it has been a while, lets make a quick trade on NAS
entry level at 24745-24765 ranges
STOP LOSS at 24680
Target 1 at 24860-24915
Target 2 at 25000-25085
once it break above 24800, bring stop loss to BREAK EVEN
pleaese NOTE: if stop loss hit, wait for entry around 24400-24600 - will keep you update.
Lets go

Bullish on USDJPYThe structure of the market is currently bullish, the market came back in our discount zone, its a swing trade, the previous drop was profit collection by the institution for the last quarter which is last year (October, November and December)

Bitcoin Bear Flag Breakdown in Play - Target $74k - $75kAnd this chart of Bitcoin we see the Bear Flag pattern playing out as forecast by the Red zigzag line a few weeks ago.
Price pushed up directly into the Red Cell Zone which are just visualizations of limit sell orders on the order books. Similarly, there are strong limit buy orders in the buy support green zone below around 84 to 85k.
But based on my prior study of the macro Head and Shoulders that likely will play out, even if we get it bounce here I do believe we will roll over and take out the buy support Zone below us and complete the Bear Flag measured move target down to 74k to 75k.
This will likely be the bottom, as Bitcoin is never gone below the price it was when a new incoming president won an election. 74k was a prior resistance level flipped as support and I expected to hold.
If it doesn't, then likely Bitcoin can head to 62k which would be the measured move on the macro Head and Shoulders in the prior study here.
In the meantime, lots of uncertainty in the markets, that could drive prices either way in the short term.
Today we have FOMC and although there is a 97% chance they do not cut rates, Powell's comments will be important and may move the markets depending on how hawkish or doveish he sounds.
With war tensions in the Middle East and Iran's escalatory language, Market participants are staying out as they don't like uncertainty.
On the other hand, hearing rumors that the US is buying Japanese yen to help prop up their currency and potentially start the money printer which would be bullish.
The DXY is also heading down, and if it breaks the 95 level then typically we enter another bullish phase as we saw in 2021.
Let me know your thoughts!
