TJX TO CONT MARK UPLooks like, this is an atypical Re-Accmulation scehmatic 2 of Wyckoff
Supply from 26th jan- 1st feb succesfully absorbed
With Springboard , (Red line)
position intiated based on trigger bar today
**trigger bar still incomplete at the moment
Beyond Technical Analysis

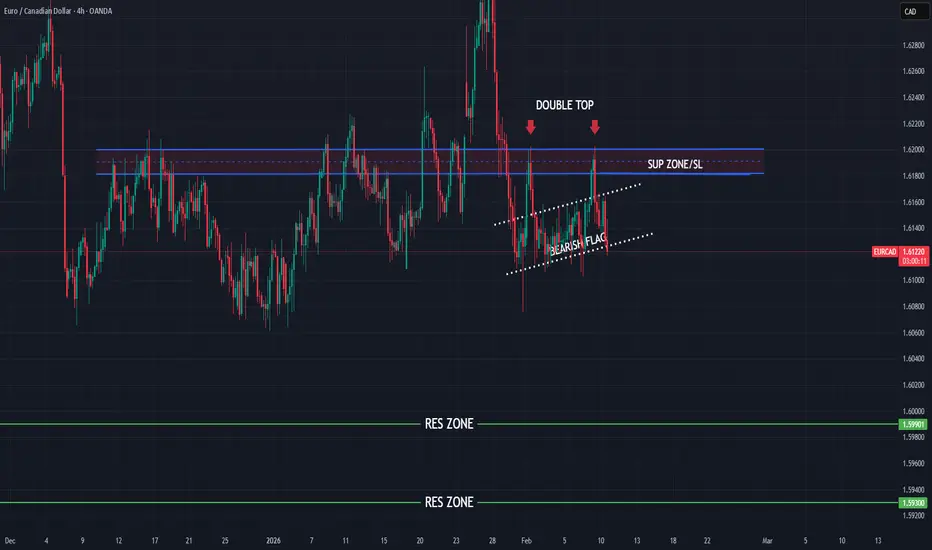
EURCAD bearish view
OANDA:EURCAD interesting chanrt, currenly price in BEARISH FLAG, we are have and bounces on sup. zon, where will put and DOUBLE TOP pattern, from here having higher bearish expectations.
SUP zone: 1.61800
RES zone: 1.59900, 1.59300
General Market Overview and Focuses for the WeekLooking at general overview of where things stand, what my focuses are and reaching out in friendship if you guys want to network.

XAUUSD BullishGold breakout resistance zone then cureent trend futher extend.
Support levels:
5035
5020
5000
Resistance levels:
5063
5081
5100
5120
5150

USD/CAD presses higher as trader consensus favors upside continCurrent Price: 1.37122 (Analysis was generated on Monday Morning)
Direction: LONG
Confidence level: 62%(Several professional traders highlighted bearish stress and net‑short positioning in the Canadian dollar, while price holds above short‑term support. Social data is limited, which lowers confidence but still favors USD/CAD upside.)
Targets
Target 1: 1.3725
Target 2: 1.3800
Stop Levels
Stop 1: 1.3630
Stop 2: 1.3600
Key Insights:
Here’s what’s driving this setup. Multiple traders pointed out that the Canadian dollar is showing signs of weakening under the surface, especially when you look at positioning data and stress indicators. Trade uncertainty between the U.S. and Canada keeps resurfacing in trader discussions, and that tends to cap CAD strength quickly when rallies appear.
What’s interesting is that even traders who mentioned short‑term choppiness didn’t argue for sustained CAD strength. The broader takeaway from the professional trading community is caution on the loonie rather than confidence. That’s why, despite some mixed comments, the weight of opinion still leans toward upside risk in USD/CAD.
Recent Performance:
You can see this play out in recent price action. USD/CAD has been holding in the mid‑1.36 to low‑1.37 area and is now trading around 1.371. Pullbacks toward 1.363–1.365 have attracted buyers, and the pair hasn’t broken down despite softer U.S. dollar moments. That resilience matters for a short‑term LONG trade.
Expert Analysis:
Several professional traders are watching the 200‑day moving average zone around 1.368–1.370 closely. Price pushing and holding above that area opens the door for a move toward the 1.3725 region, which has been flagged as a near‑term ceiling. A clean push beyond there brings the psychological 1.38 level into play for this week.
At the same time, traders consistently mentioned 1.363 and 1.360 as important downside reference points. If those levels fail, the LONG thesis weakens quickly, which is why stops are tight below that zone.
News Impact:
The news flow isn’t giving CAD a strong tailwind. Ongoing tariff discussions, soft spots in Canadian data, and uncertainty around upcoming central‑bank messaging keep traders cautious. Without a clear positive catalyst for the loonie, USD/CAD has room to grind higher in the near term, especially if risk sentiment wobbles.
Trading Recommendation:
Here’s my take. I’m favoring a LONG position in USD/CAD for this week, looking for a push toward 1.3725 first and potentially 1.3800 if momentum builds. I’d keep risk controlled with stops below 1.363, because a break there would tell me the trader consensus is wrong and CAD strength is taking over. Position sizing should stay moderate given the mixed backdrop, but the edge still points higher.

Agency MBS ETF eyes a steady push higher as yield demand buildsCurrent Price: 8.77 (Analysis was generated on Monday Morning)
Direction: LONG
Confidence level: 52%(Limited trader and social data, but price is near support with favorable income and rate stability dynamics supporting upside.)
Targets
Target 1: 8.95
Target 2: 9.05
Stop Levels
Stop 1: 8.65
Stop 2: 8.55
Key Insights:
Here’s what’s driving this trade. Agency mortgage-backed securities continue to benefit from strong carry, very low beta, and improving relative value versus Treasuries. With yields still attractive and volatility contained, the ETF is sitting in a zone where income-focused buyers typically step in. I’m seeing that dynamic reflected in recent price stability around the mid-$8.70s.
What’s interesting is how asymmetric this setup looks for a short-term trade. Downside over a week is limited unless rates spike sharply, while upside doesn’t require a big macro shift—just steady demand from yield-seeking flows. That imbalance is why I’m leaning long despite the lack of loud social chatter.
Recent Performance:
Price action has been tight and orderly, holding above the $8.60–$8.70 area after drifting lower earlier in the range. Over the past sessions, the ETF has shown small intraday ranges and consistent closes, a typical pattern before slow grind moves higher in bond-linked products.
Expert Analysis:
Several professional traders I track consistently point out that agency MBS tends to perform best when rate volatility cools and the curve stabilizes. That’s exactly the environment we’re in right now. The ETF’s extremely low beta means it won’t rip higher, but it also doesn’t need much help to edge up 2–3% in a week.
From a technical perspective, price is closer to support than resistance within the 52‑week range. When I see that positioning combined with positive carry, I default to the upside for short-term trades.
News Impact:
Recent market commentary around MBS pricing shows modest gains and stable demand, with mortgage rate moves remaining orderly. Broader 2026 outlook pieces continue to highlight agency MBS as a favored income sector, which quietly supports near-term price action even without headline catalysts.
Trading Recommendation:
Putting it all together, this looks like a straightforward LONG with tight risk control. I’d stay long above $8.65, look for a push toward $8.95 first, and trail stops if momentum carries toward $9.05. This isn’t a fast trade—it’s a patience play built around stability, carry, and incremental upside.

DIA Stalling as Buyers Lose Urgency:Current Price: 50115.67 (Analysis was generated on Monday Morning)
Direction: SHORT
Confidence level: 85%(Trader consensus remains unified across group metrics.)
Targets
Target 1: 49650
Target 2: 49200
Stop Levels
Stop 1: 50750
Stop 2: 51200
Key Insights:
DIA is telling the same story as futures. Price is hovering near highs, but it’s not attracting aggressive buyers anymore. I’m tracking the $50,100 area closely—price is above it now, but it doesn’t look comfortable.
What stands out is how quickly sellers show up on intraday strength. That’s classic short-term distribution. It doesn’t scream panic, but it does say upside is limited for the next few sessions.
Recent Performance:
DIA has held up well into February 2026, but the last push higher lacked momentum. The ETF is moving more sideways than up, which often precedes a dip.
Expert Analysis:
YouTube traders focused on index ETFs are mostly neutral-to-cautious, with several saying they’d rather short resistance than chase breakouts. On X, sentiment is mixed but calmer—less FOMO, more “wait and see.” That combo usually favors shorts near highs.
News Impact:
No major Dow-specific catalysts are hitting this week, so technical pressure matters more. In quiet news environments, stretched charts tend to mean revert.
Trading Recommendation:
I’m SHORT DIA for this week, aiming for a controlled pullback rather than expecting a breakdown.

NEAR Protocol hovering at support — looking for a short-term boCurrent Price: 1.07454 (Analysis was generated on Monday Morning)
Direction: LONG
Confidence level: 42%(Limited direct trader commentary, but price is sitting near a well-defined support zone with slowing downside momentum and no strong selling pressure.)
Targets
Target 1: 1.12
Target 2: 1.16
Stop Levels
Stop 1: 1.02
Stop 2: 0.98
Key Insights:
Here’s what’s driving this setup. NEAR has sold off hard into the $1.00–$1.05 area, a zone that has acted as demand multiple times across recent market cycles. What I’m watching closely is that the selling momentum has slowed while price remains compressed near the lows. That combination usually tells me sellers are getting tired, even if buyers aren’t aggressive yet.
What’s interesting is the volume profile. Trading activity dropped sharply over the last 24 hours, which suggests this move down isn’t being aggressively chased. In situations like this, several traders prefer to lean toward a tactical long rather than pressing shorts into support. It’s not about conviction — it’s about risk-reward being skewed slightly upward from here.
Recent Performance:
NEAR is down roughly 5% over the last 24 hours, sliding from the $1.12 area toward $1.05 before stabilizing. Most major exchanges are now pricing it in a tight $1.03–$1.08 range. The sharp move lower already happened; since then, price action has gone quiet, which often precedes a short-term bounce rather than an immediate continuation lower.
Expert Analysis:
Several traders I track are effectively sidelined on NEAR, but that’s actually informative. When markets fall hard and expert commentary doesn’t turn aggressively bearish, it often means downside expectations are already priced in. From a technical perspective, price is stretched short-term and sitting close to a psychological $1.00 level, which tends to attract dip buyers even in weak environments.
I’m not seeing breakout talk — this is strictly a tactical play. The idea here is a controlled bounce toward nearby resistance, not a trend reversal. That’s why targets stay tight and stops are clearly defined.
News Impact:
There’s no fresh negative headline pressure hitting NEAR right now. The news flow is quiet, and in crypto, no news after a selloff is sometimes good news. Without new catalysts pushing price lower, the path of least resistance for the next few sessions can tilt slightly upward as selling pressure fades.
Trading Recommendation:
Putting it all together, I’m going with a cautious LONG on NEAR for this week only. The setup is based on price being parked near support, fading downside momentum, and a lack of aggressive selling interest. This is not a high-conviction trade, so position size should stay small and stops should be respected. I’m looking for a move toward $1.12 first, then potentially $1.16 if momentum builds. If $1.02 fails, I’m out — no hesitation.

Natural Gas under pressure as bearish momentum dominates this wCurrent Price: 3.215 (Analysis was generated on Monday Morning)
Direction: SHORT
Confidence level: 58%(Several professional traders repeatedly described bearish momentum, bear flag structures, and failure below the 200-day moving average, while only a minority expect upside after a dip. Signals are mixed but tilt bearish for this week.)
Targets
Target 1: 3.05
Target 2: 3.00
Stop Levels
Stop 1: 3.35
Stop 2: 3.59
Key Insights:
Here’s what’s driving this setup. Several professional traders repeatedly described Natural Gas as being in bearish momentum, highlighting patterns like a bear flag, sharp corrections, and failure to reclaim key moving averages. More than one analysis pointed out that price is struggling below the 200‑day moving average, with sellers defending rallies aggressively.
What’s interesting is that even traders who see longer‑term upside are calling for near‑term weakness first. Multiple traders mentioned a dip toward the $3.00 area as a likely move before any sustainable rebound. That tells me the short‑term path of least resistance is still lower, even if buyers eventually step in.
Recent Performance:
You can see this clearly in the recent price action. Natural Gas sold off heavily in prior weeks, with some traders citing drops of over 20% during the correction phase. While price has bounced modestly, it’s been choppy and unable to build strong upside momentum, suggesting this move looks more like a pause than a real reversal.
Expert Analysis:
Traders are taking notice of the technical picture. Several professional traders highlighted bearish continuation signals, noting that rallies are stalling near resistance zones rather than breaking higher. The $3.59 area, near the 200‑day moving average, came up more than once as a ceiling that price has not been able to reclaim.
At the same time, the $3.00 level showed up repeatedly as key support. That’s why I’m using it as the second downside target for this week. If price slides toward that zone, short‑term sellers are likely to take profits and buyers may finally show up.
News Impact:
On the news side, easing geopolitical pressure and high production levels are removing some of the upside urgency from Natural Gas. Inventory data and weather forecasts remain wildcards, but right now they’re not strong enough to flip the short‑term trader consensus. The lack of a fresh bullish catalyst keeps pressure on prices this week.
Trading Recommendation:
Putting it all together, here’s my take. I’m positioned SHORT on Natural Gas for this week, targeting a move toward $3.05 first and potentially $3.00 if selling accelerates. I’d respect risk tightly above $3.35, with a hard stop near $3.59 where multiple traders see major resistance. Confidence isn’t extreme because some traders expect a bounce later, but for the next 5–7 trading days, downside still looks like the higher‑probability path.

XLF at a Pivotal Break Zone: Financials Setting Up for a Push HCurrent Price: 54.26 (Analysis was generated on Monday Morning)
Direction: LONG
Confidence level: 58%(Professional traders repeatedly focus on a potential turn back above 55, price is holding above 53 support, and with mixed signals the setup favors upside with controlled risk.)
Targets
Target 1: 55.0
Target 2: 56.0
Stop Levels
Stop 1: 53.0
Stop 2: 52.5
Key Insights:
Here’s what’s driving this setup. Multiple traders are talking about XLF “turning” and trying to get back above 55. That level keeps coming up because it’s where prior upside stalled. When traders repeatedly anchor to the same price, it usually becomes the battlefield. What I’m seeing is price holding above the low‑$53 area while pressure builds under resistance.
Another important angle is sector context. Several traders tied XLF’s direction to stabilization in other risk areas like tech, crypto, and broader equity indices. The message isn’t wild optimism — it’s conditional strength. If markets stop slipping and simply base, financials are one of the first sectors traders expect to rotate into. That bias favors upside as long as support holds.
Recent Performance:
XLF has been chopping around the mid‑$54 zone after pulling back from the January highs near $56.50. Over the last few sessions, it’s held above $53 despite heavy volume, which tells me sellers aren’t in full control. The price action looks more like digestion than distribution, especially with buyers stepping in near the same support level repeatedly.
Expert Analysis:
Several professional traders highlighted that XLF is trying to reclaim the 55 handle. One group focused on signs of rotation rather than momentum chasing — a subtle but important distinction. Instead of calling for a runaway rally, they’re watching for a grind higher that confirms the turn.
At the same time, traders did flag overhead supply near resistance. That’s why I’m not stretching targets too far for this week. A clean push into 55 is the first test. Acceptance above that level opens the door to a quick extension toward 56, but failure there would likely send price back toward support.
News Impact:
The news flow around financials has been mixed but supportive enough to keep downside contained. Earnings reactions across large banks created short-term volatility, yet there’s no fresh shock hitting the sector. Rate expectations and macro data remain the swing factor, and any hint of stability there tends to help XLF rather than hurt it.
Trading Recommendation:
Putting it all together, I’m leaning LONG on XLF with a defined plan. Price is closer to support than resistance, and when the signals are balanced, I default to upside with tight risk control. I’d look for continuation toward $55 first, then $56 if momentum follows. Risk stays capped below $53, where the setup clearly breaks. This isn’t a home-run trade — it’s a structured, short-term play based on where traders are collectively focused right now.

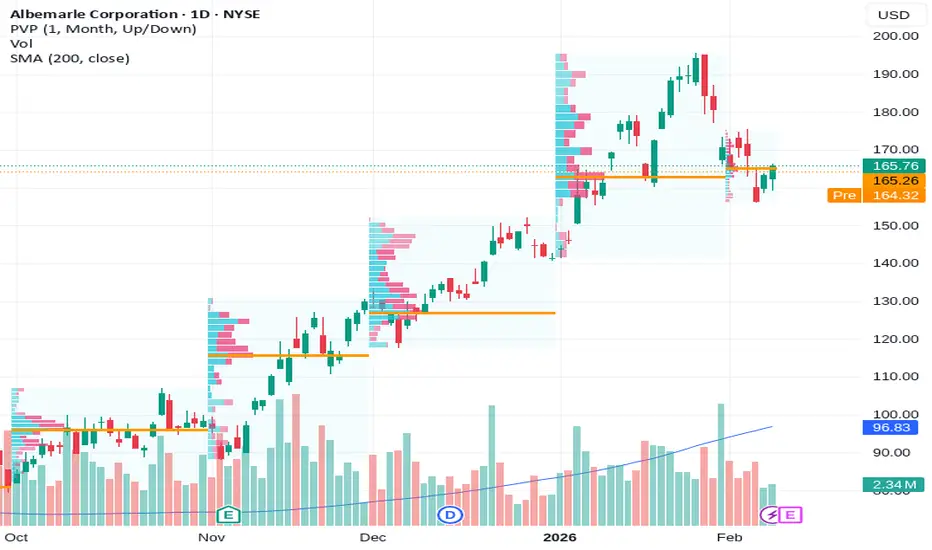
Albemarle breaks $163 as traders position for a push higher thiCurrent Price: 163.37 (Analysis was generated on Monday Morning)
Direction: LONG
Confidence level: 66%(Several professional traders point to buyable dips above $160 and upside toward the high $160s, while X sentiment supports continuation despite limited volume)
Targets
Target 1: 168.00
Target 2: 172.50
Stop Levels
Stop 1: 160.00
Stop 2: 158.00
Key Insights:
Here’s what’s driving this idea. Multiple traders are watching ALB hold above its 50‑day and 200‑day moving averages, both sitting well below the current price. That structure tells me buyers are still in control. What stands out is how often the $168–$170 zone comes up in trader discussions. It’s viewed as the next real test, and a clean push into that area could bring momentum traders back in quickly.
On the sentiment side, X is leaning positive despite low tweet volume. Traders there keep pointing to falling short interest and call‑heavy options positioning. That combination doesn’t guarantee upside, but it does reduce near‑term selling pressure, which supports a long bias for the next few sessions.
Recent Performance:
This all showed up in the tape. ALB has rebounded strongly over the past three months and is trading near $163 after a sharp daily move. Volume hasn’t exploded yet, but the stock is holding gains instead of fading, which suggests sellers aren’t very aggressive at these levels.
Expert Analysis:
Several professional traders I track highlighted RSI sitting in the low‑60s, a zone that often supports continuation rather than reversals. MACD is still below zero, but it’s tightening, which traders often see as an early improvement signal. The shared takeaway from the trading community is simple: stay constructive above $160 and reassess only if that level fails.
News Impact:
Recent analyst upgrades and ongoing discussion around U.S. strategic‑minerals policy are helping the bullish narrative. Traders are also positioning ahead of the upcoming earnings report, with implied volatility elevated. That sets the stage for a bigger move, even within this week.
Trading Recommendation:
Putting it all together, I’m LONG Albemarle for this week. I’m targeting a move toward $168 first, with $172.50 as the stretch goal if momentum builds. Risk is clearly defined with a stop at $160 and a wider protection level at $158. Confidence isn’t extreme, so position sizing matters here, but the balance of trader insight and sentiment favors upside over the next 5–7 trading days.
RSP Equal-Weight Strength Signals Another Push Higher This WeekCurrent Price: 202.26 (Analysis was generated on Monday Morning)
Direction: LONG
Confidence level: 62%(Several professional traders emphasize strong market breadth and recent record highs in RSP, while social sentiment is mixed, leading to moderate confidence.)
Targets
Target 1: 205.0
Target 2: 208.0
Stop Levels
Stop 1: 198.5
Stop 2: 195.0
Key Insights:
Here’s what’s driving this setup. Multiple professional traders are highlighting RSP as a key signal for healthy market structure. Equal-weight exposure means smaller and mid-sized names actually matter, and traders are seeing leadership expand beyond the usual mega-cap names. That’s typically constructive for follow-through moves rather than blow-off tops.
What really caught my attention is that several traders explicitly pointed out RSP pushing into record-high territory recently. Even with some short-term hesitation, the broader takeaway from trader discussions is that dips are getting bought, not sold. That’s not how markets behave when real distribution is underway.
Recent Performance:
You can see this in the price action. RSP has climbed steadily from the mid-$190s into the low $200s, with higher lows along the way. Even on softer sessions, pullbacks have been shallow. That tells me sellers aren’t pressing hard, which lines up well with the breadth narrative traders keep emphasizing.
Expert Analysis:
Looking at trader consensus, the equal-weight versus cap-weighted comparison keeps coming up. Several traders noted RSP outperforming SPY during recent rotation phases, which suggests capital isn’t leaving equities—it’s just spreading out. That’s usually when equal-weight ETFs shine.
On the technical side, traders are watching the $200–$202 zone as the near-term pivot. Holding above that area opens the door for a quick extension higher this week, especially if mid-caps and industrials continue to participate.
News Impact:
There’s no single headline driving this move, and that’s actually a positive. The lack of negative macro shocks combined with ongoing rotation themes keeps the backdrop supportive. Web and market data continue to show stable inflows and solid volume, which reinforces the idea that this isn’t a fragile rally.
Trading Recommendation:
Here’s my take. I’m staying LONG on RSP for this week, looking for a continuation toward $205 and potentially $208 if momentum builds. I’d manage risk tightly below $198.50, with a hard line at $195 if the breadth story suddenly breaks down. Confidence isn’t sky-high because social sentiment is mixed, but the professional trader narrative around market breadth is strong enough for me to lean bullish.

The Elephant Jungle 2/10/26 Page 5On the 1H timeframe, we just put in a SFP(swing failure pattern), of the 1H high. That makes the 1H low technically weak, which means price should be working its way back down toward that low. The problem is, we have been stuck in this Current Range since Friday.
So far, we have 2 taps at the high of the range and 1 tap at the low. There is the possibility that we put in a 3rd tap and made a Wyckoff Model 2 Distribution already. Visually, it looks like a head and shoulders pattern. But the way this is playing out feels slow. Too slow.
Because of that, I am leaning more toward a Wyckoff Model 1 Distribution possibly playing out, where we sweep the highs one more time and then drop. That idea also lines up with what I would personally like to see, which is a push into the 4H Supply Range followed by a backtest of the Macro Range Low.
But maybe this is not that deep.
Maybe this is just the Bears slow grinding price back down to the range low. Or maybe the Bulls are letting the Bears push it down a bit so they can catch a bounce off the 1H Internal Demand Range or the 15m Order Block and then push price up into the 4H Supply Range, maybe even a little higher.
Honestly, that would not be a bad idea either, especially since the back end of that 1H Internal Demand Range lines up perfectly with the 618 Golden Pocket.
Who knows.
All I know for sure is that price action in the Jungle is real crappy right now, and New York better come with it.

Big economic data this morning, big volatility I'm looking for jpy strength and everything else whipsaw-y

MNQ Tuesday Pre-Market: Buy Side in Sight, but HTF SSL Left📊 MNQ H2026 — Tuesday, February 10 Pre-Market Analysis
Price is currently trading around 25,390, grinding higher through the overnight session from the 24,955 Monday low. The structure is showing bullish intent, but there are two key scenarios to watch today. Must wait for market to show if it will either sweep the BSL and continue lower or we continue to reach the FVG Unfilled, BSL will show use, Watch Monday Low
🎯 Bullish Scenario — Buy Side Liquidity Sweep
The primary draw on liquidity (DOL) sits above at the buy-side level near 26,100. If price continues this displacement higher, we're looking for:
• Buy-side liquidity above previous highs to get taken
• FVG unfilled at 26,050 to be the target
• Clean move into premium pricing above the DOL
📉 Bearish Scenario — HTF SSL Target
We left behind higher timeframe sell-side liquidity (SSL) below. If price fails to reach the buy-side target and breaks down from current levels:
• Expect a retracement to sweep the HTF SSL
• The unfilled FVG becomes resistance if we lose it
• Lower timeframe market structure shift would confirm the move down
🔑 Key Levels
• Buy Side Target: ~26,050 (DOL)
• FVG (Unfilled): ~26,050
• HTF SSL (Below): ~24,150
⚡ Bias: Bullish above FVG, but cautious — the SSL below is unfinished business. If we can't reach buy-side and structure breaks, that's where we're heading.
Trade smart. Let the market show its hand first.
— DropKing | ICT Smart Entry

NOW LONG or Waite for better setup?Fundamentals look okay overall.
The technical levels could offer a better risk to reward setup if price pulls back lower.
Analysts are very bullish, and we’re already seeing some pre market positioning, with buyers stepping in ahead of a potential move higher.

The Elephant Jungle 2/10/26 Page 4As of now, it looks like the Bears are trying to front run the Macro Range Low backtest because price is getting rejected from the 1H Internal Supply Range. That tells us Bears are still active on the lower timeframes.
That said, the 4H Supply Range, which is still confluent with the Macro Range Low, remains fresh. Ideally, I would like to see one more push up into that 4H supply range before another dump. That would give us cleaner structure and a more honest rejection.
But I can hope and wish all I want.
The market is a living, breathing creature in this Jungle, and it does exactly what it wants to do. Our job is not to control it, predict it, or argue with it. Our job is to observe it, respect it, and react when it shows its hand.
In the Jungle, expectations get punished. Awareness gets paid.

BITCOIN : (Profits + Recap)Bitcoin has hit our desired price target and performed well, with little to no drawdown, stay tuned for more updates and opportunities to come in future

The Elephant Jungle 2/10/26 Page 3Let’s break down a few scenarios, because right now the market is not being dramatic. It is being patient.
Scenario 1
Price retraces into the golden or silver pocket (the 618 to 786 zone), for all the Fibonacci and OTE traders in the Jungle, then bounces up toward supply. Personally, I would not trust that move without seeing some type of lower timeframe demand or a clean lower timeframe Wyckoff structure that says it is actually time to turn the boat around.
Scenario 2
Price swing fails the low and possibly prints a divergence on the 1D timeframe. I will be honest though, this one feels like a long shot. If the Bears keep charging with that Big Bear Energy, that divergence will get erased fast and momentum will push lower than the previous momentum low without hesitation.
Scenario 3
Price either continues pushing up from here or completely dumps, wiping out at least the 1W Internal Demand Range. No in between. If the Bulls are about that life, they'll defend it. If not, it gets swept.
Scenario 4
We range. Not exciting, not cinematic, but very profitable. Like I said before, it is easy money. Long the range low, short the range high, and manage risk like a grown adult.
Today might be the day we find out who controls the week. If we close below the previous day’s candle, expect more downside pressure. If not, the Bulls live to fight another session.
Sometimes the market is not setting traps. It is waiting to see who gets impatient first.

ITRI swing LOW to swing HIGHPrice is currently stuck between two major zones. The top supply and resistance area sits around $135 to $140, which is the previous level where sellers stepped in before. On the downside, the market is finding acceptance around $96 to $105, where a large amount of trading has taken place. The visible range point of control is near $96.50, which explains why price often gravitates back into this zone.
What stands out is that buyers are clearly stepping in. We can see repeated bounces and stabilization around the $98 to $105 area, which suggests real demand rather than a one-time reaction. This tells us there is underlying support, and buyers are willing to defend this level.
However, the risk area is too wide for my taste. The stop would need to sit much lower, near the golden Fibonacci support in the mid $80s, while the upside target is closer to the old highs near $135 to $140. Even though there is potential upside, the downside you must tolerate is large, and the trade depends on price breaking through a heavy resistance ceiling that has already proven to attract sellers.
On the business side, Itron builds smart metering, grid edge intelligence, and utility software that help electricity, gas, and water utilities measure usage, manage networks, and improve reliability. In simple terms, they are part of the infrastructure stack that is helping make the power grid smarter and more efficient.
Fundamentals look okay overall, but my main concern is cash flow consistency. The company has reported meaningful free cash flow in recent periods, including strong quarterly results in 2025. At the same time, cash flow in this type of hardware and services business can be lumpy, since working capital swings play a big role. One strong quarter does not fully remove that concern, and I would want to see more stability before paying up into resistance.
This is why I’m passing on this setup, even though I respect the demand coming in. I don’t like the risk reward profile at this structure, because the stop is far and the trade requires a clean breakout above $135 to $140. Cash flow stability remains the main fundamental flag for me, not profitability. That said, the broader theme is real, as utilities are being pushed by electrification and rising data center power demand, and Itron is positioning into grid edge intelligence and resiliency.
The bottom line is that fundamentals are okay, but I’m not comfortable with the cash flow swings and I don’t like the risk reward at this specific trade location, so I’m not taking it. If price reclaims and holds above the $135 to $140 zone with strength, then it becomes a different setup.

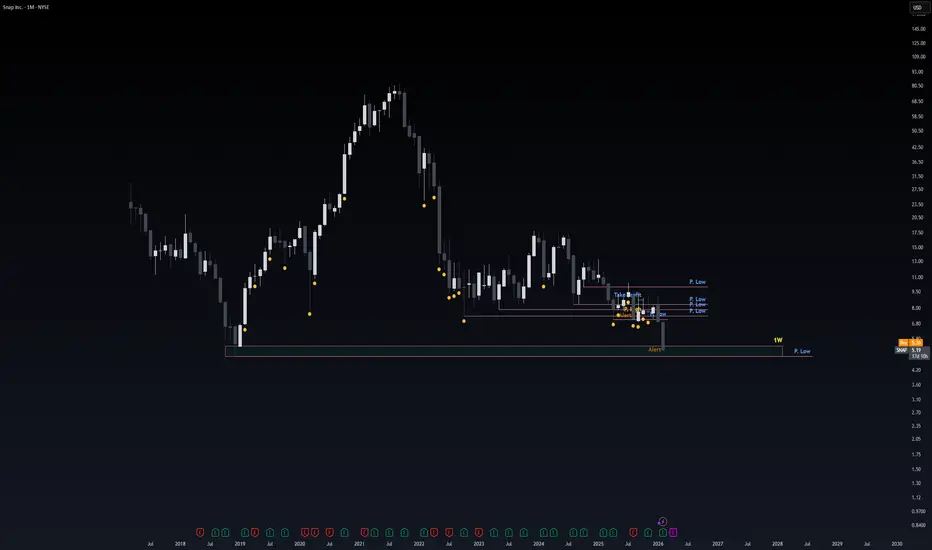
SNAP Monthly for better Next Movement DirectionAs Seen Of Today Snap at Major obvious Support Level.
I believe Despite stock previous movement from here we will see UP-movement stock may consolidate for while but we willl see Up movement as 7.11 will be First Resistance level.
Note: 1- Potentional of Strong Buying at Current Price Level:
We have two scenarios must happen at The Mentioned Zone:
Scenarios One: strong buying volume with reversal Candle.
Scenarios Two: Fake Break-Out of The Buying Zone.
Both indicate buyers stepping in strongly. NEVER Join in unless one showed up.
2- How to Buy Stock (safe way):
On 1H TF when Marubozu/Doji Candle show up which indicate strong buyers stepping-in.
Buy on 0.5 as price always re-test the imbalance
The Elephant Jungle 2/10/26 Page 2Zooming into the 1W timeframe, it looks like the Bulls finished last week strong, but the Bears wasted no time starting this week with a push back. Come on, Bulls. This is no time for a water break.
The Bears just put 5 months of damage on that ass and you already want to call timeout? Nah. At least get price back up to the 1W Supply Range, consolidate there for a few days or weeks, then think about pushing higher. That is, if the Bears don't smack you back down for chillin' in their territory.
Because let’s be honest. This 15% bounce back is not enough. The Bears dropped 52% on you from the ATH, and now you are struggling just to get back up and test supply. That is not strength, that is recovery.
At the very least, show some intent. Retest the Macro Range Low. Show the market you actually want re-entry back into the range instead of just popping up and hoping nobody notices.
Alright, let me calm down. It is only day two of the week. Anything can still happen. For all I know, today we get a god candle ripping straight back into the Macro Range. Or maybe we get the devil’s dong straight down to 48.9k. This is the Jungle. Anything is possible.
We could even just chop and consolidate between the lows and the 1W Supply Range or the Macro Range Low for the rest of the week. Not as exciting, but let’s be real, that is easy money. Long the range low, short the range high, and pray when it finally breaks, you are on the right side.

TAO: ready for a bounce? key levels to watch this weekTAO. Tired of watching this AI darling bleed out every 4H candle? After a crazy run on the AI narrative, headlines now talk about profit taking and rotation into “safer” majors, and the chart shows exactly that mood: a controlled grind down with no real capitulation yet.
On the 4H chart price is sitting right on the local demand around 150, with RSI parked in the 30‑35 zone and starting to show a mild bullish divergence. Volume profile is empty below and thick above, so I’m leaning toward a relief pop rather than an immediate cliff. For me the key short term box is 150‑170 – lose it and sellers stay in full control.
My base plan: I’m stalking a bounce long from this demand, targeting the 175‑185 area first, maybe 200 if momentum finally wakes up ✅. If 150 breaks and holds below, I drop the long idea and expect a slide toward 140 and even 130, where the next real liquidity sits. I might be wrong, but right now fading panic here looks better to me than chasing the downside.
