Using Templates to Standardize Every Trade PlanConsistency in trading rarely comes from better predictions. It comes from reducing variability in execution. Templates are one of the most effective ways to achieve this, especially when used correctly inside TradingView. A trade plan template turns preparation into a fixed process instead of a mental checklist that changes under pressure.
Start by defining what a complete trade plan looks like for you. This includes market context, execution conditions, and risk parameters. Higher-timeframe bias, key levels, entry trigger, stop logic, target logic, and position size should all be part of the same structure. The goal is clarity before price reaches your level, not decisions made in real time.
Once defined, translate this structure into a reusable format. TradingView allows you to save chart layouts, drawing sets, indicators, and notes. Use these tools to build a clean template that loads the same way every time. For example, keep one layout dedicated to analysis with higher-timeframe levels, and another for execution with only the elements required to act. This separation alone reduces noise and hesitation.
Templates also enforce discipline around risk. By using the same position tool settings, stop logic, and risk-to-reward framework on every trade, you remove the temptation to adjust risk emotionally. Over time, this creates uniform data. When every trade is planned the same way, your journal reflects your system’s performance instead of random execution decisions.
Another advantage is speed. A standardized plan reduces preparation time and mental load. Instead of rebuilding context from scratch, you load the template and verify conditions. This is especially important for traders balancing multiple markets or limited screen time. Fewer decisions lead to better decisions.
Finally, templates make review meaningful. When all trades follow the same structure, deviations become obvious. You can quickly see whether losses came from valid setups, poor execution, or rule breaks. This feedback loop is what allows improvement to compound.
Templates do not restrict flexibility. They protect process integrity. When used consistently, they transform trading from reactive decision-making into a controlled, scalable workflow built around clarity and repeatability.
Stay Green!
Beyondtechnicalanalysis

The Art of the Exit: Mastering the "Wise Cut"Hello Friends, Welcom to RK_Chaarts,
Today we are going to understand that what is The Art of the Exit: Why "Cutting Losses" is Your Most Important Skill.
Let’s be real: nobody likes losing money. It stings. But if you’re going to survive in these markets, you have to get comfortable with being wrong.
In trading, a loss is just a business expense. The goal isn’t to avoid them entirely (that’s impossible); the goal is to keep them small enough that they don't take you out of the game.
Here is how to manage your exits without losing your mind—or your account:
1. Your Stop-Loss is Non-Negotiable
Think of a stop-loss as your "insurance policy." You should know exactly where you’re getting out before you ever hit the buy button. By setting a hard exit point, you take the decision-making out of your hands when emotions are running high.
2. Stick to the Script
We’ve all been there: price hits your stop, and you think, "Maybe if I just give it a few more pips, it’ll bounce." Don't do it. That’s how a small, manageable loss turns into a portfolio-killer. Trust your plan, not your gut.
3. Lock in Gains with Trailing Stops
If a trade is moving in your favor, don’t be greedy. Use a trailing stop to follow the price up (or down). This lets you stay in the trend while ensuring that even if the market reverses, you still walk away with a profit.
4. Don't Bet the House
The "Golden Rule" is simple: never risk more than you can afford to lose on a single trade. Most pros only risk 1-2% of their account per setup. This way, even a string of five losses is just a minor setback, not a disaster.
5. Keep an Eye on the Bigger Picture
Markets don't move in a vacuum. High-impact news or economic shifts can wreck a perfectly good technical setup. Stay informed, check the calendar, and be ready to step aside if the environment gets too chaotic.
6. "Hope" is Not a Strategy
Holding onto a losing position and praying for a miracle is the fastest way to blow an account. Cut the dead weight early. There will always be another setup tomorrow. Protect your capital so you can live to trade it.
7. Pay for Your Education
Every time you take a loss, you’ve essentially paid a "tuition fee" to the market. Don't waste it. Review the trade: Did you follow your rules? Was the entry off? Use those mistakes to sharpen your edge for the next one.
The Bottom Line
Trading isn't about being right; it's about math and discipline. If you can keep your losses small and your winners big, the math will eventually work in your favor.
Stop trying to be "right" and start being "profitable."
How do you handle a losing streak? Drop a comment below 👇
I am not Sebi registered analyst.
My studies are for educational purpose only.
Please Consult your financial advisor before trading or investing.
I am not responsible for any kinds of your profits and your losses.
Most investors treat trading as a hobby because they have a full-time job doing something else.
However, If you treat trading like a business, it will pay you like a business.
If you treat like a hobby, hobbies don't pay, they cost you...!
Hope this post is helpful to community
Thanks
RK💕
Disclaimer and Risk Warning.
The analysis and discussion provided on in.tradingview.com is intended for educational purposes only and should not be relied upon for trading decisions. RK_Chaarts is not an investment adviser and the information provided here should not be taken as professional investment advice. Before buying or selling any investments, securities, or precious metals, it is recommended that you conduct your own due diligence. RK_Chaarts does not share in your profits and will not take responsibility for any losses you may incur. So Please Consult your financial advisor before trading or investing.

BTCUSDTBTCUSD: Key Range Analysis:
Bitcoin is currently trading within a defined corrective phase, moving between clear support and resistance levels. As long as the price stays inside this grey zone, we are waiting for a confirmed directional move.
🟢 Bullish Scenario
* The Breakout: Price must break and hold above the upper boundary of the current range.
* The Target: A successful hold above resistance puts the next upside targets marked on the chart into play.
* The Momentum: Look for buyers to drive price toward the recent local highs once the zone is cleared.
🔴Bearish Scenario
* The Rejection: Price fails to break the high and instead drops below the lower boundary.
* The Target: A break of the lower support suggests a bearish continuation is likely.
* The Support: Sellers will likely aim for the next major downside levels identified on the chart.
⚠️ Disclaimer:
This analysis is for educational purposes only and does not financial advice.

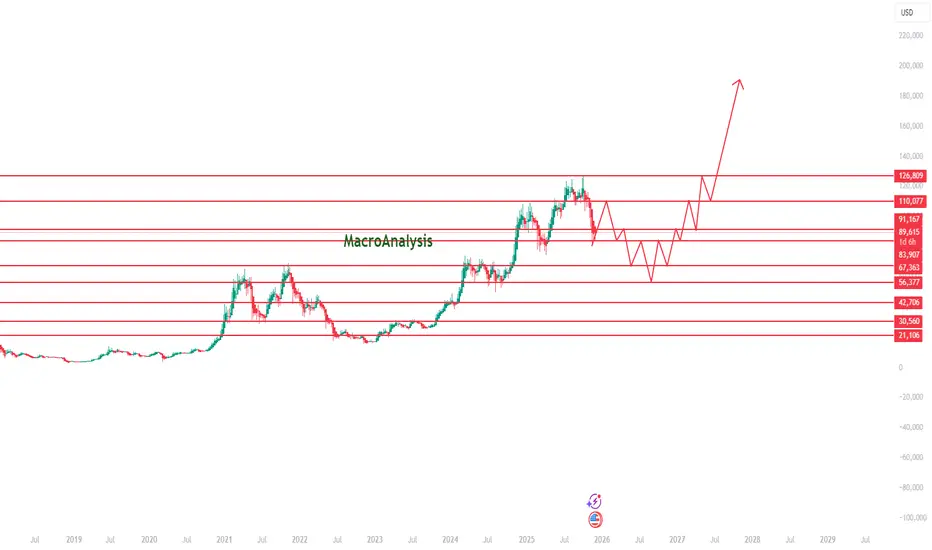
BTC Macro Roadmap: Multi-Year Support/Resistance StructureThis chart presents a long-term BTC roadmap based on major weekly and monthly support/resistance zones, reflecting how BTC typically behaves during mid-cycle phases. Price has recently reacted to the 110K macro resistance, triggering a corrective leg that fits the broader rhythm of previous BTC cycles.
The projected path highlights a realistic multi-stage structure:
• Mid-Cycle Corrective Phase
BTC is forming lower highs and lower lows after the rejection from 110K, with a likely retest of key demand zones between 83K → 67K. Deeper liquidity sweeps into the 56K region remain possible before establishing a macro higher low.
• Accumulation Zone
Inside this lower region, BTC historically creates sideways, choppy movement—sweeping liquidity both directions as market participants reposition. This mirrors prior mid-cycle accumulation phases and sets the foundation for the next macro advance.
• Recovery Phase & Re-Accumulation
Once accumulation stabilizes, structure favors a recovery back toward 91K → 110K, driven by regained momentum and market strength. A successful breakout from this zone signals the beginning of the next expansion wave.
• Macro Expansion Phase
Clearing 110K opens the door toward 126K–140K, the next major macro resistance region and potential cycle extension target.
This idea isn’t a prediction—it’s a structural map, focused on how BTC historically behaves around cycle midpoints: parabolic advance → correction → accumulation → breakout → expansion. The chart emphasizes market memory, key levels, and BTC’s typical volatility during expansion phases.
Macro Levels to Watch:
• 110,077 – major resistance, recent rejection zone
• 91,167 / 89,688 – mid-level pivot controlling short-term direction
• 83,907 – key support that preserves bullish structure
• 67,363 – strong historical demand and liquidity magnet
• 126,809 – next major resistance above ATH
CAD/JPY – Wedge Breakout Pattern (21.11.2025)📝 Setup Overview OANDA:CADJPY
CAD/JPY has broken below a rising wedge structure, signaling weakening bullish momentum. After multiple rejections at the resistance zone, price is now losing steam below the Ichimoku cloud, showing early bearish pressure.A clean breakout + retest scenario opens the door for downside continuation toward the next demand zones.
📌 Trading Plan📍 Entry Idea:
Look for bearish continuation below the wedge support + cloud rejection.
🎯 Targets (Support Levels):
1st Support: 111.022
2nd Support: 110.561
🛑 Resistance Zone:
112.014 – 112.294
This zone continues to act as a strong supply area where sellers took control repeatedly.
📉 Today’s Fundamentals – Bearish CAD Bias
1️⃣ Crude Oil Pullback → Weakens CAD
Canada’s economy is heavily tied to oil prices. Today’s dip in crude oil puts pressure on the CAD, giving JPY an advantage.
2️⃣ Safe-Haven Demand Supports JPY
With global markets showing risk-off sentiment (concerns over slowing global growth + uncertain central bank guidance), investors favor safe-haven currencies like the Japanese Yen.
3️⃣ BoC Policy Tone Still Cautious
Recent Bank of Canada communications show limited confidence in economic momentum.
Markets expect slower growth → bearish CAD outlook.
➡️ Combination of oil weakness + JPY strength + wedge breakdown = bearish continuation setup.
🔖 Hashtags
#CADJPY #ForexAnalysis #PriceAction #WedgeBreakout #Ichimoku #FXTrading #TechnicalAnalysis #FundamentalAnalysis #SmartMoney #TradingViewCommunity #Kabhi_TA_Trading
⚠️ Disclaimer
This analysis is for educational purposes only.
Not financial advice. Always manage your risk and trade based on your plan.
💬 Support the Work
If you found this analysis helpful, please LIKE & COMMENT on the post ❤️
Your support motivates more high-quality setups daily!

EUR/CAD - Bearish Flag (20.11.2025)🧠 Setup Overview TICKMILL:EURCAD
EUR/CAD is forming a clean Bearish Flag Pattern after a strong impulsive drop.
Price is trading below the EMA, inside a rising corrective channel — a classic continuation structure. With cloud resistance above and repeated rejections from the upper flag boundary, bearish momentum is building. A confirmed breakdown below the lower trendline could trigger the next bearish leg.
📊 Trading Plan🔻 Sell Bias (Primary Scenario)
Watch for a candle break & retest below the flag
Enter short after confirmation
🎯 Targets:
1st Support: 1.6137
2nd Support: 1.6109
❌ Invalidation:
A strong candle close above 1.6230 cancels the bearish view
⚡ Fundamental Outlook – Today (20 Nov 2025)
CAD Fundamentals
1️⃣ Canadian Dollar strengthened as crude oil prices saw a mild rebound, supporting CAD (commodity-linked currency).
2️⃣ Bank of Canada remains cautious, but no new signs of easing have emerged — giving CAD some underlying firmness.
EUR Fundamentals
3️⃣ Euro under pressure due to rate-cut expectations in early 2026 as European economic data remains soft, especially in manufacturing.
4️⃣ Risk-off sentiment pushes flows toward safer currencies, indirectly affecting EUR negatively.
➡️ Fundamentals support a continuation move lower for EUR/CAD.
#EURCAD #Forex #BearishFlag #PriceAction #TechnicalAnalysis #EUR #CAD #ForexTrader #TradingSetup #KABHI_TA_TRADING #ChartsDontLieTradersDontQuit #TradingViewCommunity #SupportAndResistance #BreakoutStrategy
⚠️ Disclaimer
This analysis is for educational purposes only.
Not financial advice — always use proper risk management.
💬 Support My Work ❤️
If this setup helps you:👍 LIKE the post💬 COMMENT your view🔔 FOLLOW for daily setups
Your support motivates me to keep posting high-quality analysis!

GBP/USD - H1 - Trendline Breakout (19.11.2025)🧠 Setup Overview FX:GBPUSD
GBP/USD has broken below a long-term ascending trendline, followed by a clean retest rejection — a strong bearish confirmation signal.
Price also remains below the resistance zone (1.3180–1.3200) and is showing consistent lower highs, indicating sellers are gaining control.
With bearish fundamentals supporting USD strength, further downside pressure is expected.
📊 Trading Plan🔻 Sell Bias (Primary Scenario)
Look for bearish candles forming below the trendline retest
Target the next support levels
🎯 Targets:
1st Support: 1.3077
2nd Support: 1.3039
❌ Invalidation:
A break and close above 1.3200 (resistance zone) cancels the bearish view
⚡ Fundamental Outlook – Today (19 Nov 2025)
🇺🇸 USD Fundamentals
1️⃣ U.S. yields continue to climb as investors expect the Federal Reserve to maintain tight policy for longer due to sticky inflation.→ Higher yields → Stronger USD
2️⃣ Risk sentiment remains weak, with markets rotating into safe-haven assets, supporting USD strength.
🇬🇧 GBP Fundamentals
3️⃣ UK economy shows slowing momentum, and BoE policymakers remain cautious.
→ Weaker GBP outlook
➡️ Combined outlook favors a bearish continuation on GBP/USD.
#GBPUSD #Forex #TechnicalAnalysis #PriceAction #TrendlineBreak #BearishSetup #USD #GBP #ForexSignals #TradingView #KABHI_TA_TRADING #ChartsDontLieTradersDontQuit #FXMarket #SupportAndResistance #MarketBreakdown
⚠️ Disclaimer
This analysis is for educational purposes only.
Not financial advice — always confirm entries and manage your risk properly.
💬 Support My Work ❤️
If you find this helpful:👍 LIKE💬 COMMENT🔔 FOLLOW
Your support motivates me to post more daily trade setups!

GBP/USD - Triangle Breakout (18.11.2025)🧠 Setup Overview
GBP/USD has broken below the triangle structure, signaling a shift toward bearish momentum after repeated rejections from the upper trendline.
Price is sitting under the breakout region, indicating that sellers are gaining control.
With fundamentals supporting USD strength, the downside continuation scenario looks favorable.
📊 Trading Plan🔻 Primary Bias: Sell
Wait for a retest & rejection near the triangle support-turned-resistance
Look for continuation toward the lower support zones
🎯 Targets:
1st Support: 1.3091
2nd Support: 1.3062
#GBPUSD #Forex #TechnicalAnalysis #PriceAction #TriangleBreakout #BearishBias #USD #GBP #ForexSignals #TradingView #KABHI_TA_TRADING #ChartsDontLieTradersDontQuit #FXMarket #TrendlineBreak #SupportAndResistance
⚠️ Disclaimer
This analysis is for educational purposes only and does not constitute financial advice.
Always follow your confirmation signals and risk management rules before trading.
💬 Support My Work ❤️
If this analysis helps you: 👍 LIKE💬 COMMENT🔔 FOLLOW
Your support motivates me to post more clean and consistent chart breakdowns!

GBP/CAD - Triangle Breakout (17.11.2025)🧠 Setup Overview
GBP/CAD has broken below a symmetrical triangle, signaling a potential bearish continuation after repeated rejections from the upper trendline. The pair is now trading under the breakout level, with sellers showing strong control. If bearish momentum continues, the next support zones become key targets.
📊 Trading Plan 🔻 Bearish Scenario (Primary Bias)
Look for a clean breakdown retest and rejection for confirmation
Bearish continuation expected toward the support areas below
🎯 Targets:
1st Support: 1.8335
2nd Support: 1.8287
⚡ Fundamental Outlook — Today (17 Nov 2025)
GBP Sentiment – The Pound remains under pressure as markets expect the Bank of England to stay cautious, given ongoing inflation uncertainty and slowing economic data.
CAD Sentiment – The Canadian dollar stays supported by stable Bank of Canada policy and improving expectations around the energy sector.
– Rising US bond yields indirectly support CAD’s strength through its correlation with risk-on flows.
➡️ Overall: Fundamentals align with the bearish bias on GBP/CAD.
#GBPCAD #Forex #TechnicalAnalysis #TriangleBreakout #PriceAction #CAD #GBP #ChartPatterns #ForexTrader #TradingView #KABHI_TA_TRADING #ChartsDontLieTradersDontQuit #BearishSetup #MarketOutlook #FXMarket
⚠️ Disclaimer
This analysis is for educational purposes only and not intended as financial advice.
Always wait for confirmation and follow your risk management rules.
💬 Support My Work ❤️
If this helped you:
👍 LIKE, 💬 COMMENT, and 🔔 FOLLOW
Your support encourages more clean chart breakdowns & daily setups!

Risk Management for Automated SystemsAutomation gives you speed, consistency, and emotionless execution, but it also has a dark side.
A bot can follow rules perfectly, but if the rules are risky, it will amplify the danger with mechanical precision.
That’s why risk management is the backbone of every successful automated strategy.
It doesn’t matter how good your code is — without proper risk control, even the smartest system can fail fast.
Below are five core pillars of risk management that every trader should build into their automation framework.
1. Know Your Maximum Drawdown
Every trading system, even the best one, goes through losing streaks.
What matters isn’t avoiding them, but controlling how deep they cut.
Setting a maximum drawdown limit defines the exact point where your bot pauses or shuts down.
Whether it’s 5%, 10%, or 20%, this boundary protects your capital and your mindset.
Why it matters:
Prevents “death spirals” during high volatility
Stops the system if market conditions change
Forces you to step back and evaluate logic
Protects the account from black swan trends
A bot that can’t stop itself, is a bot that will eventually blow up.
A bot that knows when to stop, survives.
2. Position Sizing Is Everything
You can have the best entry logic in the world, but if your position sizes are inconsistent or too large, the system becomes unstable.
Smart position sizing adapts to:
Account balance
Market volatility
Asset liquidity
A fixed-percentage model, such as risking 1–2% per trade, keeps performance steady even during rough periods.
It also allows your system to grow naturally without taking oversized risks.
Think of sizing as the volume knob of your bot — turn it too high, and you distort everything.
3. Avoid Correlated Exposure
Running several bots doesn’t automatically mean you are diversified.
Many traders make the mistake of running multiple strategies that all rely on the same market behavior.
For example:
Three momentum bots on BTC, ETH, and SOL are still highly correlated
Two trend systems may fail at the same time if the market suddenly ranges
Several “dip-buying” strategies will all get hit hard during a crash
True diversification means mixing:
Uncorrelated assets
Different signal types
Varying timeframes
Both trend and mean-reversion logic
The goal is for your bots to perform differently, not identically.
4. Review Your System’s Risk Profile
Markets change, and so should your risk model.
Volatility increases and decreases, spreads widen, volume dries up, and certain assets become more unpredictable.
Regular reviews ensure your system stays aligned with real conditions.
What to check:
Has drawdown increased over the last quarter?
Are trades becoming larger than planned due to volatility shifts?
Has your system entered a new market phase it wasn’t designed for?
Are win rates or profit factor weakening?
A quarterly or monthly audit reveals issues before they explode.
Risk management isn’t a one-time setup — it’s a continuous process.
A strategy tester can be very good tool to help you manage risk properly and evaluate risk.
Here is an example from one of our strategies.
5. Let Risk Management Be Automated Too
If your entries are automated but your risk controls aren’t, you’re only half-protected.
Risk management logic you can automate:
Stop-loss placement
Progressive stop tightening
Position scaling
Reducing size after a losing streak
Pausing after reaching a daily or weekly limit
Complete shutdown at max drawdown
This turns your bot into a self-regulating system that responds to both opportunity and danger.
The more risk rules you automate, the less emotional interference you’ll face — and the more consistent your results become.

EUR/USD - Ascending Triangle (17.11.2025)🧠 Setup Overview TICKMILL:EURUSD
EUR/USD has formed an ascending triangle, but instead of breaking upward, price failed at the horizontal resistance and slipped below the rising trendline — signaling potential bearish reversal. The pair is rejecting the 1.1650–1.1660 supply zone, and downside momentum is building as fundamentals shift in favor of USD strength.
📊 Trading Plan🔻 Bearish Scenario (Primary Bias)
Look for trendline retest rejection for confirmation
Expect continuation to the downside toward key support zones
🎯 Targets:
1st Support: 1.1581
2nd Support: 1.1561
🔰 Resistance Zone: 1.1650 – 1.1660
⚡ Fundamental Updates (Today – 17 Nov 2025)
1️⃣ Fed officials remain cautious about easing policy due to persistent inflation risks.
• This reduces the chances of a near-term rate cut → USD strengthens.
2️⃣ U.S. government bond yields rise as investors move into safer assets during stock market weakness.
• Higher yields = stronger USD → bearish pressure on EUR/USD.
These fundamentals align with the technical breakdown, supporting further downside.
#EURUSD #Forex #TechnicalAnalysis #PriceAction #AscendingTriangle #BearishSetup #USD #EUR #FundamentalAnalysis #ForexSignals #TradingView #KABHI_TA_TRADING #ChartsDontLieTradersDontQuit #FXMarket #TrendlineBreak #SupplyZone
⚠️ Disclaimer
This is not financial advice.All content is for educational purposes only. Always confirm signals and apply strict risk management before entering trades.
💬 Support My Work ❤️
If this analysis helps you —
👍 Like 💬 Comment 🔔 Follow
Your support motivates me to post more daily setups & clean chart analysis!

EUR/USD – H4 Wedge Pattern | Dollar Weakness & Fed Cut Bets🧠 Setup Overview:
EUR/USD is forming a falling wedge pattern on the H4 chart — a potential bullish reversal structure after weeks of downside pressure. The pair is testing the upper wedge trendline, suggesting a possible breakout, but confirmation is still pending. FX:EURUSD
📊 Trading Plan: ✅ Bullish Scenario:
🟢Watch for a confirmed breakout above the wedge and cloud resistance zone.
🟢If confirmed, expect a move toward 1.1730 (1st Resistance) and 1.1800 (2nd Resistance).
⚙️ Technical Levels:
🟢 1st Resistance: 1.1732
🟢 2nd Resistance: 1.1804
🔴 Support Zone: 1.1500 – 1.1470
🧩 Fundamental Updates (Today – 9 Nov 2025):
1️⃣ U.S. Treasury yields slipped slightly as surveys showed weaker consumer confidence, softening the dollar’s tone.
2️⃣ Fed rate cut expectations increased — markets now price a 66% chance of a 25 bps cut in December, according to CME FedWatch.
3️⃣ Government funding worries: renewed concerns over a potential U.S. government shutdown weighed on sentiment and limited USD demand.
🔴These factors combined create short-term bearish pressure on USD, which may fuel a EUR/USD rebound if momentum sustains above the wedge.🔴
#EURUSD #Forex #PriceAction #TechnicalAnalysis #ChartPattern #FallingWedge
#FundamentalAnalysis #FedWatch #USD #EUR #ForexSignals #KABHI_TA_TRADING #ChartsDontLieTradersDontQuit #SwingTrading #ForexEducation #FXMarket #TradingView
⚠️ Disclaimer:
This post is for educational purposes only — not financial advice. Always perform your own analysis and manage risk carefully before entering trades.
💬 Support My Work ❤️
If you like this analysis — drop a LIKE 👍, leave a COMMENT 💭, and FOLLOW 🔔 to stay updated with more Forex setups, price action insights, and live market fundamentals!

USD/CAD - Fundamental Drives (13.11.2025)🧠 Setup Overview OANDA:USDCAD
USD/CAD continues to face strong rejection from the resistance zone, with price failing multiple times to break above the 1.4020–1.4045 supply area.
The market structure remains bearish as the pair forms lower highs and struggles to sustain upside momentum.
With fundamentals also favoring CAD strength, the downside scenario remains more probable.
📊 Trading Plan🔻 Sell Bias
Look for bearish confirmation near or below the resistance zone
Continuation to the downside expected toward key support levels
🎯 Targets:
1st Support: 1.3969
2nd Support: 1.3950
🔰 Resistance Zone: 1.4020 – 1.4045
⚡ Fundamental Updates (Today – 13 Nov 2025)
1️⃣ Bank of Canada (BoC) signaled no further interest rate cuts, which strengthened the CAD.
• A stable or moderately hawkish BoC typically supports CAD appreciation.
2️⃣ US Treasury yields continue to fall as markets increase bets on the Federal Reserve easing policy in the coming months.
• Lower yields = weaker USD, helping push USD/CAD lower.
📌 High Impact Event Today:
USD - CPI (Inflation Rate) → A softer CPI reading could accelerate USD weakness.
#USDCAD #Forex #TechnicalAnalysis #PriceAction #ResistanceZone #FXMarket #FundamentalAnalysis #ChartPatterns #KABHI_TA_TRADING #ChartsDontLieTradersDontQuit #USD #CAD #TradingView #ForexSignals #BearishSetup #IntradayTrading
⚠️ Disclaimer
This analysis is for education only. It is not financial advice.
Always apply proper risk management and trade based on your own confirmation.
💬 Support My Work ❤️
If this analysis helps you —👉 LIKE 👍 👉 COMMENT 💬 👉 FOLLOW 🔔
Your support motivates more daily chart breakdowns and setups!

GBP/USD – Head & Shoulders Pattern (13.11.2025)🧠 Setup Overview FX:GBPUSD
GBP/USD is forming a Head & Shoulders pattern on the 1H chart — a classical bullish reversal structure after a prolonged downtrend.
Price is currently holding above the right-shoulder support zone, showing early signs of accumulation. A breakout above the neckline would confirm bullish momentum toward the next resistance targets.
📊 Trading Plan✅ Bullish Scenario
If confirmed → Expect bullish continuation toward:
🟢 1st Resistance: 1.3287
🟢 2nd Resistance: 1.3360
⚡ Fundamental Updates
1️⃣ U.S. Treasury yields eased slightly as consumer confidence declined.
2️⃣ Markets now price a 66% chance of a rate cut in December, according to CME’s FedWatch Tool.
3️⃣ U.S. government shutdown concerns keep the dollar under mild pressure as investors watch debt issuance risk.
💬 Summary
A clear trendline rejection combined with fundamental USD weakness supports a short bias.
Wait for confirmation before entering — patience protects capital.
#GBP/USD #ForexAnalysis #TradingView #PriceAction #Trendline #Ichimoku #TechnicalAnalysis #ForexTrader #Fundamentals #SwingTrading #KABHI_TA_TRADING
⚠️ Disclaimer
This analysis is for educational purposes only and not financial advice.
Always do your own research and manage risk wisely.
📢 Support My Work
💚 Like, Comment & Share this idea to motivate more chart updates!
🧠 “Charts Don’t Lie, Traders Don’t Quit.”

Backtesting on TradingViewBased on the massive feedback from our previous article about backtesting we decided to make a follow up on how to backtest your strategy.
Every trader talks about strategy.
Few actually test it.
Backtesting is where ideas meet data — and TradingView makes it surprisingly simple.
Whether you code your own system or use built-in tools, backtesting shows you how your logic performs before you risk a single dollar.
1. Open the Strategy Tester
Start by opening the chart of the asset you want to test.
Click “Strategy Tester” at the bottom of the screen.
This activates TradingView’s built-in engine that simulates your system’s historical trades automatically.
You’ll see three tabs appear:
Overview: a summary of your results.
Performance Summary: key stats like profit, drawdown, and win rate.
List of Trades: every single historical trade your strategy executed.
2. Load or Create a Strategy
Go to the Indicators & Strategies tab.
TradingView separates indicators from strategies — only strategies can trigger trades for backtesting!
You have two options:
Use a built-in or public strategy: like “MACD Strategy” or “Moving Average Crossover.”
Paste your own Pine Script strategy: under “Pine Editor,” then click “Add to Chart.”
Once applied, TradingView automatically calculates historical trades based on your logic.
Tip: Indicators are for signals, strategies are for testing execution.
3. Adjust the Test Parameters
To make your test realistic, click the ⚙️ icon next to your strategy name.
In the Properties tab, you can define:
Initial capital (e.g. $10,000)
Position size (fixed or percent-based)
Commission and slippage
Pyramiding (how many positions can stack)
Then set your date range in the Strategy Tester — for example, test from 01-01-2022 to 01-01-2024.
The goal is to simulate what your system would have done under real conditions.
4. Analyze the Results
Once the test runs, TradingView gives you a detailed breakdown:
Net Profit (%) — your total gain or loss.
Max Drawdown — your biggest loss from peak to trough.
Win Rate & Profit Factor — how often you win and how much you win versus lose.
Average Trade — the mean result per trade.
Equity Curve — how your balance evolved over time.
Scroll through the List of Trades to see how each entry and exit behaved.
If you spot clusters of losses, note the pattern — that’s where improvements start.
This is the part where you analyze and think why did a trade fail and how can I avoid it.
TradingView also enables you to export data in excel so its super easy to analyze and look for improvement.
5. Refine and Forward-Test
Once you’ve seen how your system performs historically, make small adjustments.
Change one parameter at a time — like EMA length, RSI threshold, or stop-loss distance — and rerun the test.
When you find consistent results across timeframes or markets, move to paper trading mode.
Forward-testing confirms your backtest logic under real conditions, including live volatility and execution timing.
If your live and backtested results align closely, you’ve built something solid and you are ready to make money.
A big tip here, even a small thing such as a change in stop loss or timeframe change from 15 minutes to 14 minutes can make a huge difference so try out different conditions.
USD/CHF - Trendline Rejection (10.11.2025)📊 Setup Overview : FX:USDCHF
USD/CHF continues to respect the descending trendline and Ichimoku cloud resistance, signaling potential downside pressure. Price is currently retesting the resistance zone (0.8070–0.8085) — a strong supply area that has rejected multiple times.As long as this zone holds, we expect a move toward the next support zones.
🧭 Trade Plan
Bias: 🔻 Sell / Short-term Bearish
Entry Zone: 0.8060 – 0.8080 (wait for confirmation candle or rejection)
Target 1 (1st Support): 0.8015
Target 2 (2nd Support): 0.7995
Invalidation: Break and close above 0.8085 (Resistance Zone)
⚡ Fundamental Updates
1️⃣ U.S. Treasury yields eased slightly as consumer confidence declined.
2️⃣ Markets now price a 66% chance of a rate cut in December, according to CME’s FedWatch Tool.
3️⃣ U.S. government shutdown concerns keep the dollar under mild pressure as investors watch debt issuance risk.
💬 Summary
A clear trendline rejection combined with fundamental USD weakness supports a short bias.
Wait for confirmation before entering — patience protects capital.
⚠️ Disclaimer
This analysis is for educational purposes only and not financial advice.
Always do your own research and manage risk wisely.
📢 Support My Work
💚 Like, Comment & Share this idea to motivate more chart updates!
🧠 “Charts Don’t Lie, Traders Don’t Quit.”
#USDCHF #ForexAnalysis #TradingView #PriceAction #Trendline #Ichimoku #TechnicalAnalysis #ForexTrader #Fundamentals #SwingTrading #KABHI_TA_TRADING

GBP/USD – BoE Rate Decision Ahead |(06.11.2025)🧠 Setup Overview:
GBP/USD is trading inside a descending channel, with price recently rebounding from a strong support zone near 1.3000.
Ahead of the Bank of England (BoE) interest rate decision, the pair is positioned for a possible bullish breakout if the BoE maintains rates and highlights inflation risks.
📊 Trading Plan:
Bullish Scenario:
If the BoE holds rates and remains cautious on inflation → expect GBP/USD to rebound toward 1.3120 – 1.3180.
Breakout confirmation above channel resistance will strengthen the bullish view.
Bearish Scenario:
If the BoE signals dovish tone or hints at future rate cuts, GBP/USD could drop below 1.3000, targeting 1.2850 – 1.2710.
⚙️ Technical Levels:
🟢 1st Resistance: 1.3133
🟢 2nd Resistance: 1.3171
🔴 Support Zone: 1.3000 – 1.3020
Pattern: Falling Channel → Potential Breakout
🧩 Fundamental Insight (Today – 6 Nov 2025)
1.Markets price a 1-in-3 chance of a BoE rate cut to 3.75%, but consensus expects a hold at 4.00%.
2.UK inflation at 3.8% YoY remains above the BoE’s target, supporting a hawkish stance.
3.A surprise dovish tone, however, could hit the pound hard against the USD, especially as US data remains resilient and the dollar stays firm.
#GBPUSD #BoE #Forex #TechnicalAnalysis #PriceAction #ChartPatterns #KABHI_TA_TRADING #FundamentalAnalysis #BankOfEngland #InterestRates #FXMarket #TradingPlan #ForexSetup #ChartsDontLieTradersDontQuit #GBP #USD #TradingView
⚠️ Disclaimer:
This analysis is for educational purposes only and not financial advice. Always do your own analysis and manage risk carefully before trading news events.
💬 Support My Work ❤️
If you find this chart helpful — LIKE 👍, COMMENT 💭, and FOLLOW 🔔 to stay updated with more daily Forex setups and price action insights!

Building a Trading System: From Idea to ExecutionEvery trader starts with an idea — a setup, a pattern, a theory that seems to work.
But until that idea becomes a structured system, it’s just intuition.
A trading system gives your ideas rules, logic, and repeatability.
That’s the difference between a trader who hopes, and a trader who executes.
Define the Core Idea
Every system begins with an observation.
Maybe you notice breakouts after volume spikes, or reversals after RSI divergence.
Whatever the logic, write it down.
A system has to be specific, if you can’t define it clearly, you can’t test it.
Set Your Entry and Exit Rules
Your system should answer three things precisely:
When to enter a trade
When to exit a trade
How much to risk
Ambiguity is the enemy.
Rules make your strategy repeatable, testable, and objective.
Backtest the Logic
Before going live, test your rules on past data.
You’re not looking for perfection, you’re looking for consistency.
If your logic survives bull, bear, and sideways markets, it’s valid.
Track win rate, drawdown, and profit factor — they’ll tell you what’s working.
Execute With Discipline
A system only works if you do.
Follow the rules exactly as tested, even when it feels uncomfortable.
Consistency turns probability into profit — emotions destroy both.
Application
Here we have a very good example from our trading signals where we executed one of our strategies for 10 days. The strategy was designed with detailed inputs, logic and executed with a precise setup in a trading bot.
Refine and Evolve
Once live, keep notes.
Track how the system performs under real conditions.
Make small, measured improvements based on data, not emotion.
A system should evolve, not change its identity.
Redefining and tuning is a part of the process, there is no strategy that lasts forever, everything needs to evolve and adjust!
AUD/JPY - Bullish Flag (03.11.2025)🧠 Setup Overview:
AUD/JPY is forming a Bullish Flag Pattern on the 30-minute chart — a continuation setup suggesting potential upside momentum after consolidation. The price has respected the flag support zone and is attempting a breakout above the descending channel, signaling renewed bullish pressure.
💡 Technical Plan: Pattern: Bullish Flag Pattern
Bias: Buy after confirmation breakout and retest
Support Zone: 100.650 – 100.700
Entry Zone: Near 100.850 – 100.900 (after breakout confirmation)
Targets:
🎯 1st Resistance: 101.460
🎯 2nd Resistance: 101.753
Invalidation: Close below 100.600 negates the bullish bias
🌏 Fundamental Insight (Today – 3 Nov 2025)
The AUD finds strength as China’s manufacturing PMI beats expectations, improving sentiment for commodity-linked currencies.
Meanwhile, the JPY remains under pressure due to continued Bank of Japan dovishness and yield differentials favoring risk assets.
Market tone is risk-on, further supporting bullish momentum in AUD/JPY.
⚠️ Disclaimer:
This setup is shared for educational purposes only. It is not financial advice. Always do your own analysis and apply proper risk management before trading any setup.
#AUDJPY #Forex #TechnicalAnalysis #PriceAction #BullishFlag #BreakoutTrading #Ichimoku #KABHI_TA_TRADING #ChartsDontLieTradersDontQuit #ForexSetup #MarketAnalysis #TradingView #FXMarket #BuySetup #ForexCommunity #AUD #JPY #ForexTrader
💬 Support My Work ❤️
If you find this analysis useful — LIKE 👍, COMMENT 💭, and FOLLOW 🔔 for more daily Forex chart updates and trade setups!

Backtesting 101: How to Turn an Idea Into a Tested StrategyEvery trader has thought it:
“If I’d just followed that setup every time, I’d be up big.”
That’s where backtesting steps in, it separates luck from logic.
It’s how you find out whether your strategy has a real edge, or just worked in hindsight.
Most traders skip it, not because it’s useless, but because it forces them to face the truth.
But if you can handle that truth, backtesting will make you a far more confident trader.
What Backtesting Really Is
Backtesting means applying your trading rules to historical data to see how your system would have performed.
It’s not about predicting the future, it’s about proving whether your idea works in different market conditions.
When done properly, it gives you three key insights:
Profitability: does your edge actually exist?
Risk: how deep are the drawdowns, and can you handle them?
Consistency: does it work across bull, bear, and sideways markets?
A solid backtest gives you confidence, not because it guarantees profit, but because it exposes weakness before the market does.
The Most Common Mistakes
Curve-fitting: tweaking rules until the past looks perfect.
Ignoring fees and slippage: small costs that quietly erase profits.
Testing too little data: short periods create false confidence.
Focusing on one market: edges must survive different conditions.
If your backtest looks too clean, it’s probably lying to you.
Why It Matters
Backtesting builds trust in your system and discipline in yourself.
When you know your data, you stop second-guessing every trade.
Losing trades stop feeling like failure, because you understand they’re part of a proven edge.
Even bots rely on backtesting. Without it, automation is just random execution.
With it, every trade follows structure, not emotion.
All of these points make a difference between a winning or losing strategy.
From Idea to System
Every strategy starts as a hypothesis.
Backtesting turns that hypothesis into data.
Data turns into structure.
Structure turns into consistency.
That’s the real path to professional trading - logic first, emotion second.

Trading Bots: The Future of the Markets?Let’s be real, the idea of a trading bot sounds like the holy grail.
Set it up, go to bed, and wake up to profit.
If only it were that simple.
Most bots don’t fail because of bad code, they fail because of bad logic.
A bot is only as good as the rules you give it.
What a Trading Bot Actually Does
A bot doesn’t predict the market, it reacts to it.
It follows a defined strategy:
Buy when X happens, sell when Y is confirmed, cut losses if price breaks Z.
That’s all.
No fear. No greed. No “maybe I’ll wait for one more candle.”
The power of bots isn’t in magic,it’s in consistency.
They do what most traders can’t: follow the plan exactly as written, every single time.
Why Most Bots Fail
The truth?
Most traders plug in random bots they find online without understanding what’s inside.
They win a few trades, feel invincible… and then lose it all when volatility spikes.
The reason isn’t the bot, it’s the lack of testing and understanding.
If you don’t know your system’s weak spots, you’ll eventually find them the hard way.
That’s why backtesting matters.
Backtesting: Your First Line of Defense
Backtesting shows how your logic performs over hundreds of trades — across bull, bear, and sideways markets.
It reveals your system’s strengths, weaknesses, and drawdowns before you risk a dollar.
A good backtest should tell you:
Your average win rate and risk/reward ratio.
How your system handles volatility.
How often it hits consecutive losses.
Whether your edge actually holds over time.
If your bot looks good in backtests and performs similarly in live conditions — you’re onto something real.
*Example of one of our indicator
How Bots Can Enhance Your Trading
You don’t have to hand everything over to automation.
In fact, many great traders use bots to handle the mechanical side, while keeping the decision-making human.
Here are a few examples:
Trade Execution: Let the bot enter trades instantly after your setup triggers.
Risk Management: Bots can move stop-losses, take partial profits, or scale positions automatically.
Signal Filtering: Use automation to scan hundreds of pairs and alert you only when conditions align.
Backtesting Sandbox: Test new ideas safely with data before deploying them live.
Bots don’t replace traders, they multiply efficiency.
They free your mind from execution so you can focus on refinement.
The Real Lesson
A trading bot isn’t a shortcut.
It’s a mirror, it reflects your discipline, your rules, and your logic.
If your plan is solid, a bot will make it unstoppable.
If your plan is weak, it’ll just lose money faster.
Automation doesn’t fix bad habits, it exposes them.
So learn the logic, test it hard, then let the system do what humans struggle with most: follow the plan.

USD/CHF - Channel Breakout (24.10.2025) Setup Overview:
USD/CHF has completed a rising channel formation and is now showing signs of a bearish breakout below the lower trendline. The pair rejected the resistance zone near 0.7985 – 0.7970, confirming exhaustion in bullish momentum.
💡 Technical Setup:
Pattern: Rising Channel Breakout
Cloud Cross: Adds bearish confluence
Resistance Zone: 0.7985 – 0.7970
Trendline: Clear breakdown structure visible on 30-min timeframe
📉 Trading Plan:
Bias: Bearish below 0.7960
🟥 1st Support: 0.7925
🟥 2nd Support: 0.7906
Invalidation: A daily close above 0.7985 may negate this setup
📰 Market Context:
1.The U.S. dollar faces minor pullbacks as traders await upcoming inflation data and FOMC signals.
2.Swiss franc gains slight safe-haven demand amid geopolitical and risk market concerns.
3. Technically and fundamentally, short-term sentiment favors a downside correction on USD/CHF.
#USDCHF #Forex #TechnicalAnalysis #PriceAction #ChannelBreakout #BearishSetup #Ichimoku #TradingView #KABHI_TA_TRADING #ChartsDontLieTradersDontQuit #FXMarket #USD #CHF #TrendlineBreak #CloudCross
⚠️ Disclaimer:
This analysis is for educational purposes only — not financial advice. Please do your own research and use strict risk management when trading live markets.
📣 Support My Work
If you like my analysis — LIKE 👍, COMMENT 💬, and FOLLOW 🔔 for more daily Forex setups and updates!

GBP/USD - Fundamental Drive Ahead! (21.10.2025)🧠 Setup Overview:
GBP/USD has broken below its rising trendline after testing the 1.3470 resistance zone multiple times. The pair is under fundamental selling pressure, fueled by risk aversion and renewed U.S. dollar strength.
Fundamental Drivers:
1️⃣ U.S. markets gained as President Trump decided not to impose very high tariffs on Chinese goods, which temporarily boosted sentiment.
2️⃣ However, investors are now digesting U.S. credit risks and US–China trade tensions, both adding safe-haven demand to the USD.
3️⃣ Meanwhile, the UK economy faces uncertainty from softer consumer spending and weak housing data — further limiting GBP’s upside potential.
📉 Technical Plan:
Bias: Bearish below 1.3400
Structure: Trendline breakdown confirmed
Cloud Resistance: Adds confluence to downside momentum
Next Levels to Watch:
🟥 1st Support: 1.3349
🟥 2nd Support: 1.3310
📊 If price closes below 1.3349 on the 30-min chart, further selling pressure may extend toward 1.3310 and possibly deeper if fundamentals align.
#GBPUSD #Forex #TechnicalAnalysis #PriceAction #Ichimoku #TrendlineBreak #FXMarket #BearishSetup #TradingView #KABHI_TA_TRADING
⚠️ Disclaimer:
This analysis is for educational purposes only — not financial advice. Always manage your risk and use proper position sizing before entering any trade.
📣 Support My Work
If you found this analysis useful — LIKE 👍, COMMENT 💬, and FOLLOW 🔔 to stay updated with daily Forex setups!
