BITCOIN: WHY!? Long-Term Structure Still IntactIt's time to be real..
Everyone is calling for an immediate bull run, or bull run soon, but markets don't move on excitement - they move in cycles.
Bitcoin has always required time, consolidation and patience before its next expansion phase. Price rarely moves in straight lines, especially on higher timeframes.
This weekly chart highlights the broader structure and long-term trend rather than short-term noise. If history continues to rhyme, the coming phase is more likely to be a a boring continued consolidation and accumulation phase, not instant acceleration. For those that know, the "boring" phase is often the most exciting. When everyone's portfolio has been hit hard followed by some up and down consolidation for long period of time, that's when they get the "i better sell, this is BS" attitude. That's when i buy with excitement.
The goal here isn't to predict a top or bottom, but to respect structure and allow the cycle to play out. Patience is often the hardest part - and usually the most rewarding.
So everyone wants prices and dates right? Well looking at the chart, I suspect that we have already hit the bottom lows of 60k, and the boring accumulation is about to begin. This will go for a year, most will not be able to cope. We will be bouncing around the bottom of the parallel channel a few times around 64k again.
When's the next bull run you ask? well i suspect it won't officially start until early to mid 2027.
SAVE this chart, track as time goes on.
Cheers,
Activeaus
Bitcoin (Cryptocurrency)

BTC macro trend, good place to start DCA for the next 1-2 yearsSeeing us hitting a new low soon unless we already did; 200 EMA on the weekly is a huge support for BTC

This Volatility Period: February 6th - 8th
Hello, fellow traders!
Follow us to get the latest information quickly.
Have a great day!
-------------------------------------
(BTCUSDT 1M Chart)
The price fell from the critical 69,000 - 73,499.86 range.
We need to see if it finds support near the previous high of 57694.27 to 61299.80.
I believe the price range it cannot return to is below the 42283.58 to 43823.59 range.
-
(1D chart)
This period of volatility is expected to last from February 6th to 8th.
Therefore, the key question is how far it can rebound.
We need to see if it can rise to the critical 69000 to 73499.86 range.
If not, we need to see if it can rise above the left Fibonacci level of 0.618 (65760.59).
The next period of volatility will be around February 17th (February 16th-18th), so the key question is where the price will begin its sideways movement after this period of volatility.
The 57694.27-61299.80 range represents the previous high point, the first significant uptrend, and thus holds some significance.
The M-Signal indicator on the 1D chart is still forming at 87944.84, so we should also monitor whether it re-forms after this period of volatility.
This is because an uptrend begins when it meets the minimum DOM (-60) or HA-Low indicator.
-
Thank you for reading to the end.
I wish you successful trading.
--------------------------------------------------
- This is an explanation of the big picture.
(3-year bull market, 1-year bear market pattern)
I will explain in more detail when the bear market begins.
------------------------------------------------------

Bitcoin - Starting the final -30% drop!🛟Bitcoin ( CRYPTO:BTCUSD ) is dropping another -30%:
🔎Analysis summary:
The underlying trend on Bitcoin remains clearly bullish. But following the unusual curve channel, Bitcoin perfectly rejected the upper resistance curve. Quite likely therefore that Bitcoin will now create another bullish break and retest and first drop -30%.
📝Levels to watch:
$55,000
SwingTraderPhil
SwingTrading.Simplified. | Investing.Simplified. | #LONGTERMVISION

Bitcoin up-close —Expect more and additional growthTo look at Bitcoin we have to focus on the short-term, we already looked at the weekly and monthly timeframes. I already showed you why a recovery now is unavoidable.
I know you don't like these really short-term analyses because the view, the perspective is just too narrow; but we've been going deep into the bigger price. Let's see what is happening daily and if this confirms our broader bullish bias.
The last move is the exact same as Ethereum. An ABC correction. First a steep decline, then sideways followed by a bearish continuation. This much calls for bullish action now.
After a move is completed the market tends to move the other way.
I think the most important candle to consider is 6-Feb. The same day that produced the lowest price in years, since October 2024, also recovered most of the losses and ended up closing green. The ensuing day there wasn't a bearish resumption, nor the next day nor today. Instead, the market is green.
This all points to the correction being over. It is the same that happened in April 2025, the end of the previous correction and the start of the bullish wave that ended with the $126,000 all-time high.
Looks like we will have a v shaped recovery. The "baseline level" is the previous trading range, now a resistance zone. Around this level there can be a reversal followed by another crash to end the bear market in the latter part of 2026.
The current move doesn't have to be a sudden rise, Bitcoin can take its time.
The signal that confirms a bear market, apart from the 4 consecutive months Bitcoin closed red, is the monthly MACD. There is no going back once the chart becomes like this.
The good news is that we are getting a relief rally now —bullish. And the situation is similar to what I showed you with Ethereum.
Bitcoin recovered 6-February to peak at $71,725, the low was $60,000. The action is always happening at the top of the range, which is extremely bullish.
7-Feb. Bitcoin moved lower with the lowest point being $67,360. Today again, lower but all selling was quickly bought. The lowest point today was $68,308.
Notice how it is not possible for the market to push prices below $65,000 and how resistance continues to be challenged.
On a bearish continuation, we would see Bitcoin trading between $64,000 - $61,000, this isn't the case.
On a bullish move, Bitcoin would stay close to resistance making it weaker with each passing day. This is exactly what is happening.
On a bullish move, the smaller altcoins would start to grow really, really strong. Just today, many projects are high with two digits green, the first time since the correction low.
We have bullish signals coming from Bitcoin, Ethereum and the smaller altcoins. All this combined supports growth.
Truly, it is not a surprise, it is exactly what we have been expecting so, let it grow. We will adapt to market conditions as the relief rally unravels.
Long-term: Up now, then big down followed by the accumulation phase—sideways trading at bottom prices. After the accumulation phase, late 2026, we get the start of the next market cycle... The best ever!
Stay true, stay live and alive, continue to trade.
Good opportunities come and go, the market will continue to fluctuate.
Whatever your plan, just make sure to always stay in the game. As time goes by, we gain experience. With this experience, we will achieve long-term financial success.
From the top to higher. There is no limit to how high we can go. Nothing can stop us. The difficult life experiences will only stimulate more and additional growth.
Thanks a lot for your continued support.
Namaste.

BTC long-term TABitcoin is still in a very bearish formation, there has been no change in trend direction since October last year.

BTC/USD - Advanced Wyckoff Distribution Analysis: Targeting $61K
Hello Traders,
I’m sharing my latest outlook on Bitcoin, utilizing a pure Wyckoff Method approach to identify the current market cycle. We are currently witnessing a textbook Distribution schematic playing out.
Technical Breakdown:
Schematic Identification: After a prolonged consolidation, the price failed to sustain momentum above the $71K-$72K zone.
Phase C & LPSY: Following the "Test" of the highs (Upthrust), we saw a clear rejection. The subsequent LPSY (Last Point of Supply) confirmed that the path of least resistance is now to the downside.
Current Trade: I am currently in a short position. Stops have already been moved into profit to ensure a risk-free ride to the target.
Target: My primary objective is the $61,900 region, where we expect to see the completion of this markdown phase.
About the Analyst: I am Daniel, a Wyckoff specialist with 12 years of experience in the financial markets. My expertise lies in deciphering institutional footprints and market cycles. In a world of indicators, I prefer to focus on the only thing that matters: the relationship between Supply and Demand.

bitcoin keeps going down & downmore downward impulse for bitcoin as things are not looking very bright for crypto investors, every upward correction is a chance to exit COINBASE:BTCUSD

SOLT/SBIT Trading Pair - 15 minuteThis is the SOLT/SBIT trading pair 15 minute chart. Trade 2x Solana long or 2x Bitcoin short ETF's in your brokerage account. We are trading SOLT because it generally outperforms Bitcoin on the upside. As there is no -2x Solana short ETF, we use SBIT for the downside. BEWARE! As these are leveraged ETF's you can get wrecked in a heart beat. Manage position size and use stop losses to limit risk! Not Financial Advice.
We are now trading at the bottom of a horizontal channel just off All Time Lows for the pair. Stochastic RSI is low, RSI is oversold, and the BlackCat indicator is nearing the end of a down trend. The horizontal channel coincides with a Bull Flag pattern on the Solana 1 hour chart. A buy of SOLT at $2.60 with a tight stop loss at $2.52 risks -2.90% with Solana target of $110 is about 44.5% upside potential for SOLT target of $3.74
See my 1 hour Solana chart for more technical analysis of the Solana trade.
WARNING! HIGH RISK, HIGH REWARD POTENTIAL.

Why Risk Management works differently in Funded AccountsRisk management inside funded accounts is often reduced to position sizing and percentage risk. In reality, it operates under a very different set of constraints than personal capital. The presence of hard rules changes what risk actually represents.
In a funded account, risk is not only financial. It is structural. Daily loss limits, maximum drawdowns, and trailing equity thresholds define a fixed boundary. Once that boundary is crossed, the account ends. There is no recovery phase, no opportunity to adjust or wait for conditions to improve. This turns normal variance into a critical threat rather than a temporary setback.
Because of this, two trades with identical risk on paper can carry very different consequences. A perfectly valid loss taken early in the day may remove the ability to participate in high-quality setups later. A sequence of small losses, well within a strategy’s historical tolerance, can still violate account rules simply due to timing. Risk becomes path-dependent rather than distribution-based.
This reality shapes execution. Traders tighten stops to protect drawdown, even when market structure suggests wider protection is needed. They reduce position size beyond what their edge requires to survive longer. Some shift toward higher win-rate setups with lower expectancy to smooth equity. These adjustments are logical responses to constraints, but they redefine what “good” risk management looks like.
In personal accounts, drawdown is elastic. Losses are uncomfortable, but they do not end participation. This allows traders to think in terms of long-term expectancy, sample size, and recovery. Risk management focuses on sustainability over time rather than immediate survival.
Problems arise when traders apply real-account logic to funded environments, or vice versa. What feels conservative in one context can be reckless in another. Funded accounts reward survival within limits. Real accounts reward consistency across cycles.
Understanding this distinction removes confusion and self-blame. Effective risk management is not universal. It is conditional on capital structure. Traders who adapt their expectations and execution to those constraints stop fighting the rules and start working within them.

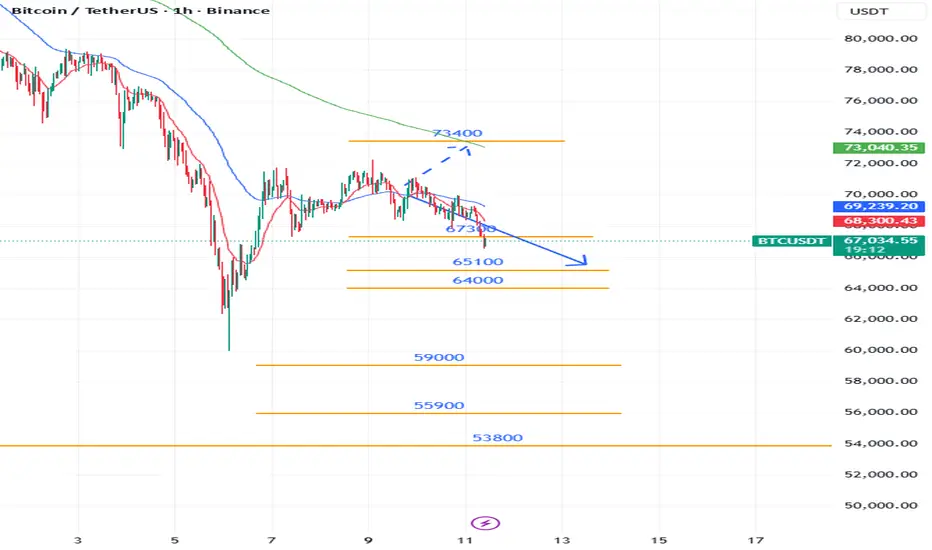
BTC/USDT Analysis. Testing the Lower Range Boundary
Hello everyone! CryptoRobotics trader-analyst here with your daily market analysis.
Yesterday, Bitcoin continued its decline and reached the lower boundary of the range at $67,300. After breaking this level, price failed to reclaim it. Instead, when retesting the level from below, volumes increased but failed to produce upward movement. The primary expectation for the next 24 hours is continued decline toward the nearest demand zone.
Within the buy zone, we will look for confirmation signals to consider long positions. If buyer reaction is absent, the decline may continue, potentially pushing Bitcoin below $60,000.
Buy Zones
$65,000–$63,000 (maximum traded volumes)
$72,200–$56,000 (daily buy zone)
Sell Zones
$72,500–$75,200 (selling pressure)
$77,800–$79,200 (accumulated volumes)
$82,000–$85,500 (volume anomalies)
$87,600–$90,500 (accumulated volumes)
This publication is not financial advice.

USD/JPY | Retesting (READ THE CAPTION)As you can see in the 4H chart of USDJPY, it has been on a bearish run for the past 3 days from Monday open. It gradually dropped in the price from 157.66 all the way to 152.80, that's almost 400 pips in a span of 3 days!
USDJPY hit the demand zone today and it is being traded at 153.21.
If USDJPY manages to stay above the demand zone and manages to go through the IFVG, the targets are: 153.28, 153.40, 153.52 and 153.64.
If it fails at retesting the IFVG: 153.10, 153.00, 152.90 and 152.80.

EUR/USD | Consolidation over? (READ THE CAPTION)By analyzing the 15m chart of EURUSD we can see that it has been consolidating in the same range in the past 2 days, Currently being traded at 1.1915, barely above the NDOG High. If EURUSD manages to hold itself above the NDOG, the targets are: 1.1922, 1.1929, 1.1936 and 1.1943.
If it fails to hold itself above the NDOG Midpoint (1.19135), the targets will be: 1.1908, 1.1900 and 1.1892.

OKB: recovery or further decline? key levels to watch todayOKB. Still recovering from that brutal liquidation crash? After the wipeout and all the talk about compensations and “risk controls” according to industry sources, the market is clearly in trust‑rebuild mode, and OKB is trading like a wounded alt. That’s why this sideways chop here matters a lot: it’s either a base for recovery or just a pause before the next leg down.
On the 4H chart price is stuck under local resistance around 75‑77 with a flat, heavy range and RSI failing to get back above 50. Volume profile shows a fat node right here and a vacuum below, while all the serious supply zones sit much higher near 95‑110. That combo makes me lean to the downside over the next days, expecting sellers to press again once this support gives up.
My base plan: if 72 breaks and flips to resistance, I see room toward 68 and then the green demand area near 60 ✅ I’m watching shorts from the upper edge of the range with a tight invalidation above 80. Alternative: if buyers suddenly reclaim 80 and hold a 4H close, that opens the door for a squeeze into 90‑95 and I step aside or rethink long. I might be wrong, but ignoring risk here is how accounts get flash‑crashed too ⚠️

XAUUSD – H4 Next possible moveToday is NFP day, so volatility will be high.
I personally avoid taking trades before the news release.
🔹 Resistance zone: 5050 – 5100
🔹 Key support / POI: 4900 – 4860
📈 Scenario 1 — Breakout
If Gold breaks and holds above the resistance after NFP, the next major target is 5300.
📉 Scenario 2 — Rejection
If price rejects the resistance, a buying opportunities is around 4900–4860 (key level + FVG).
⚠️ Always wait for confirmation before entering any trade.

Coinranger|BTCUSDT. Continued decline🔥News
🔹Unemployment data at 16:30 UTC+3
🔥BTC
🔹Some additional information on previous days' levels:
1️⃣ Dynamic 69200 above.
2️⃣ Below, we've reached 67300, heading to 65100, then 64000.
Be careful at 16:30 UTC+3. Increased volatility is possible.
---------------
Share your thoughts in the comments!
EURUSD Scalping/Day TradingEURUSD is consolidating. Can do some profits scalping and Day Trading and also at the break of SUPPORT looking to go SHORT.

BTCUSDT Intraday Short — Contextual ExpectationWithin the framework of last week’s established initial balance, the broader daily dynamics remain constructive.
However, on a local scale, signs of upside exhaustion are starting to appear.
The current context is defined by:
-a local market buyer block
-presence of minor liquidation activity
-temporary weakness in acceptance above current levels
As long as these factors remain unchanged, the near-term bias stays short-oriented.
Zone of interest for short setup:
69,800 – 70,400
Targets:
-67,300 — first target
-66,300 — second target
Idea invalidation:
Acceptance and consolidation above 72,300.
All decisions should be made according to your own trading system and risk management rules.

93k - 40k - 73k - 25k?Here is my bearish thesis...
There is a high possibility that it rally and test 93k. if it turns around from 93k, then 40k is next stop. We could have a strong fast rally from 40k to 75k. I believe it eventually will settle at 25k and then may be at 16k.
All the best !!

GBP/USD | Where to next? (READ THE CAPTION)After reaching all bullish targets last night (based on previous analysis, yesterday), GBPUSD opened today a little bit lower and then dropped in price gradually, almost touching the Jan 26th NWOG high, but then it went back up a little bit and now it's being traded at 1.3669. I expect GBPUSD to touch the Jan 26th NWOG soon, and if it manages to react and stay above there, I believe it'll go to today's NDOG.
Targets: 1.3674, 1.3681, 1.3688 and 1.3695.
If it fails to hold above: 1.3662. 1.3655 and 1.3648.

EUR/USD | Breaking through the breaker! (READ THE CAPTION)Well good morning folks, Amirali here.
starting the day with an analysis on EURUSD. As expected and mentioned yesterday, it reached the Bearish Breaker and has been struggling with it since last night, consolidating in a range inside the bearish breaker. I'd like to see EURUSD go above today's NDOG and stay above the Bearish Breaker's Mean Threshold and then go up higher to 1.19600 level.
For now, the targets: 1.1915, 1.1922, 1.1929, 1.1936, 1.1943 and 1.1950.
If it stays below the NDOG: 1.1900, 1.1893 and 1.1886.

MSTR - How to profit from a $140 short target🔱 The MS ponzi is taking its toll. 🔱
I’m not laughing, because it’s genuinely unfortunate for everyone who believed in this scam.
But today, I don’t want to rant about that.
I want to show how one could profit from a potential drop of more than $100.
As an Andrews Pitchfork trader, I know there’s roughly an 80% chance that price will reach the centerline. From there, price either reverses in the opposite direction or breaks through the centerline to continue its journey.
That’s exactly what happened with MSTR.
You can see how the price first reached the centerline, held there a few times, and then broke it. Since then, it’s been following the rulebook by moving further to the downside.
Now, there’s another rule worth remembering:
price often tests or retests the line it just broke.
In our case, that line is the centerline.
This means we could be lucky enough to get a pullback to the centerline, and that would be a good level to consider shorting.
The target is usually the opposite line of the centerline, which in our case is the L-MLH (Lower Median Line Parallel).
👉 If you want to learn the full framework and its rules, check the links for free material.
I hope this helps many of you, and I wish you all good profits.

ZEC 1W Update: Zoomed out Zcash is at a critical inflection point on the weekly timeframe after losing the 300 level, which had acted as a major pivot and structural support during the recent expansion. The rejection from the blow-off top was sharp, and the failure to hold above 300 signals a clear cooling of momentum, shifting ZEC from trend continuation into a corrective phase. That said, price is now pulling back into the mid-200s, an area that previously acted as a launch zone during the impulsive move higher, so this region may still attract dip buyers. The structure, however, is no longer cleanly bullish unless ZEC can reclaim 300+ on a weekly closing basis. Continued acceptance below that level increases the risk of a deeper retrace and longer consolidation, while a stabilization here followed by a reclaim would suggest the move was a harsh but healthy reset rather than a full trend failure. Overall, losing 300 is technically tough, but the market is now in evaluation mode rather than outright breakdown, with the next few weekly closes likely to define whether this was distribution or a volatile bull-market correction.
