BTCUSDT – Calm Before the BreakoutThe Bitcoin market is entering a phase of “calm before the dawn.”
After a mild correction around the $105,000 area, BTC continues to maintain a positive market structure, consistently forming higher lows — a clear signal that buyers are still quietly in control.
From a technical perspective , the long-term descending trendline remains the main obstacle . However, the current price action shows visible compression, and every touch of that trendline has been met with strong buying reactions . This often marks the “energy accumulation” stage before price breaks out above $106,000 — a key psychological resistance level .
With the U.S. Dollar Index losing momentum and overall liquidity improving , capital flows are gradually returning to risk assets like Bitcoin. Although ETF inflows and large-wallet activity have temporarily slowed, this more likely reflects short-term caution rather than a sign of major distribution.
Possible Scenario:
If the support area around $101,600 continues to hold, BTC could easily rebound to retest $106,000 — or even extend higher toward $108,000 in the coming week.
A mild bullish bias remains dominant, as long as buyers can protect the current higher-low structure.
Bitcoin (Cryptocurrency)

All time lows coming?Earnings ahead !! This looks like it want to hit mid 60s which could be a buying opportunity. Wait until it settles down if it goes down tomorrow, earnings day. All the best !!
Not a financial advice.
Regards.

Bitcoin Rebounds — channel breakout signals!Have a good day, Traders! It's Leo. Let's look at the current BTCUSDT chart
Valid Support Zone: 98,000 – 102,000 — Price has formed a clear double-bottom structure here.
Breakout confirmation: Price has broken above the descending channel and both EMA20/50.
Next resistance / target: 115,000 — previous supply area aligning with major liquidity.
→ Short-term structure favors a bullish continuation as long as support holds.
Despite short-term volatility, Bitcoin remains supported by improving risk sentiment as U.S. yields retreat and Fed officials hint at a potential policy pause.
Scenario: A successful retest of the breakout zone could trigger momentum toward the 115K resistance. Holding above 102K keeps the bullish structure intact.
Bulls seem to be regaining control — will this momentum extend toward 115K? What’s your outlook for BTC this week?

$BTC bounce before further selloffAs you can see from the chart, BTC formed a falling wedge and looks set to breakout to the upside from it.
I've marked off areas of resistance, but I think if we do get a breakout, the areas you'll want to take profit are $117k and $121-122k as the most likely areas for price to reject.
I think at those levels, you'll want to derisk or set stop losses, because I think it's likely that we can fall a lot further.
The trigger to go short would be losing the diagonal trend line that goes all the way back to October 2023 when the start of the bullish move happened. A move below that trend line should indicate the bullish move is finished and I think that we could potentially move down to the $60k-72k support levels.
I've marked off a lower resistance at $30k, just incase we see an extreme move in the worst case scenario.
Let's see how it pans out over the coming months.

Big Catalysts Behind Bitcoin’s Pump – Can BTC Hit $110K?Bitcoin ( BINANCE:BTCUSDT ) started pumping yesterday as I expected in my previous idea . Let's take a look at the fundamental reasons for Bitcoin .
Why the sudden BTC pump? Here are the 3 BIG catalysts hitting at once:
1-US Government Shutdown officially ending tomorrow (Nov 12)
Senate finally reached a budget deal. Treasury General Account (TGA) will start draining → hundreds of billions in fresh liquidity flooding markets. Same thing that ignited the 2020-2021 bull run.
2-Trump’s “Tariff Dividend”
President promised every American adult at least $2,000 from tariff revenue (potentially $400B+ total). Last time we got $1,200 stimulus checks, BTC went from $7K → $69K. Do the math.
3-Short squeeze + ETF flow reversal
Despite last week’s $1.22B ETF outflows, today we’re seeing fresh bids stacking. Bears who shorted the dip are now fuel for the rocket.
------------------------------------------------------------------------------
Let's take a look at Bitcoin’s technical analysis on the 1-hour timeframe .
Right now, Bitcoin is trading around a Resistance zone($107,600,980-$106,100) , and it looks like it might be forming a potential ascending channel , though the second top of that channel isn’t confirmed yet.
My expectation is that after a brief pullback to the Support zone($104,840-$103,600) —where there’s also Cumulative Long Liquidation Leverage($105,311-$104,111) —Bitcoin could start rising again and attempt to break through the Resistance lines. If BTC manages to break above those Resistance lines, then the next target could be around $110,000 .
Cumulative Long Liquidation Leverage: $99,865-$98,168
Cumulative Short Liquidation Leverage: $112,590-$111,459
New CME Gap: $104,565-$104,160
So what do you think? Can Bitcoin push up to $110,000, or will it turn back down again?
Note: These days, the market can be pretty volatile and unpredictable, so always remember to manage your risk and stick to your risk management strategy.
Please respect each other's ideas and express them politely if you agree or disagree.
Bitcoin Analysis (BTCUSDT), 1-hour time frame.
Be sure to follow the updated ideas.
Do not forget to put a Stop loss for your positions (For every position you want to open).
Please follow your strategy and updates; this is just my Idea, and I will gladly see your ideas in this post.
Please do not forget the ✅' like '✅ button 🙏😊 & Share it with your friends; thanks, and Trade safe.

ADA/USDT | Cardano Climbs 20% – Can Bulls Push It Above $0.70?By analyzing the Cardano chart on the 3-day timeframe, we can see that after dropping to $0.49, the price found strong demand and rallied up to $0.60.
Currently, ADA is trading around $0.58, and we need to see if it can hold above $0.55. If it does, we can expect a bullish continuation toward the $0.70+ levels. This analysis will be updated soon!
Please support me with your likes and comments to motivate me to share more analysis with you and share your opinion about the possible trend of this chart with me !
Best Regards , Arman Shaban

ETH/USDT | Ethereum Eyes $4K After Holding Above Key Support!By analyzing the Ethereum (ETH) chart on the weekly timeframe, we can see that after the previous analysis, the price started rising from $3300 and climbed up to $3700 before facing a correction.
Currently, ETH is trading around $3500, and we’ll need to see if it can hold above $3300 in the next couple of days. If it manages to stay above this level, we can expect a bullish continuation toward $4000.
Please support me with your likes and comments to motivate me to share more analysis with you and share your opinion about the possible trend of this chart with me !
Best Regards , Arman Shaban

LTC/USDT | Litecoin Up Over 35%! Can It Keep Climbing?By analyzing the #Litecoin chart on the weekly timeframe, we can see that after the last analysis, the price continued its rally from $88, hitting the targets of $97 and $106, and even reaching up to $114, coming close to the third target.
Currently, LTC is trading around $101, and it’s important to see if the price can hold above $100. If it does, we can expect further upside, with the next targets at $113, $118, and $136.
The overall gain from this analysis has been over 35%, and I hope you’ve made the most of it!
Please support me with your likes and comments to motivate me to share more analysis with you and share your opinion about the possible trend of this chart with me !
Best Regards , Arman Shaban

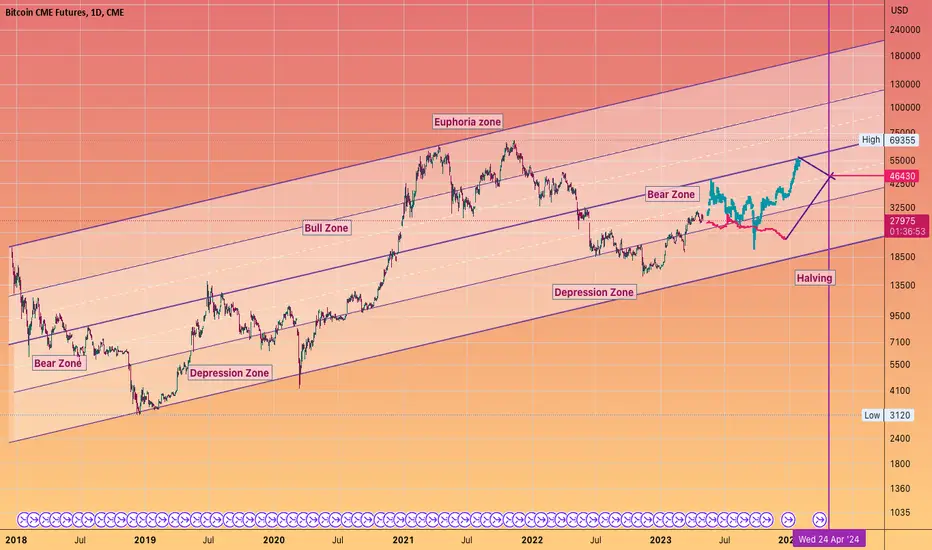
BITCOIN Weekly line charttells a story of 4 discernible patterns and 4 log targets.
1) The inverse head & shoulders to end the bear market
2) A broadening rising flag .... which at the time, many thought it was head and shoulder's top on the candle chart.
3) A small sideways flag
4) and the current frustrating broadening descending bull flag. Which has cause much grief to participants but will likely gives an explosive quick large moves.
As you can see putting the chart can help in identifying trends.. key highs and lows and also gives patterns that may not be visible on a candle chart.
Another tool in your toolbox.

#BITCOIN pathways for the halveningroute 1
or route 2
or a new pathway (Most likely)
next April we will be at $50k
BITCOIN WYCKOFF accumulationscenariocast!
IF that is what is occuring ... the #BTC price over the next few months could follow something similar to what I have drawn in a #Wyckoff re-accumulation range and breakout.
With the recent price action being a false breakdown before recapturing the range and proceeding to reach previous levels of resistance.
Let's see if this occurs, sentiment reached rock bottom last week.
SO I would not be surprised!

BITCOIN in a LIVERMORE FunnelThe accumulation and distribution volume matches the positive and negative money flows of the first 5 waves in a Jesse Livermore stock cylinder.
Will wave 6 see a rush of positive money flow into #Bitcoin into the end of the year?
Let's see
If it does
then that will further cement this pattern of accumulation , sideways movement then breakout with continuation of buying power into the Bull market top.
Let's observe this in real time shall we?
Should be a fun few months ahead of us after a long period of churn.
S/O to @arvine11 for bringing up the Livermore stock trend analysis.

Bitcoin #BTC The key level to launch the Bull market...is $34500
The 50% drawdown level from the previous cycle laugh
let see if it can repeat the 3rd time
We assume this is going to happen leading up and post #halvening
But open to a quickening of this timeline because #ETF news driving the hype even quicker

Bitcoin in the Channel of Truth — Levels Mapped, Eyes on 106.261Yesterday's exit was clean — rejection + Bitcoin dominance on support. Let’s break it down 🔍
📊 Bitcoin Dominance
Currently bouncing off key support at ~59.76 . Unless this level is lost, altcoins likely stay weak.
Dominance rising = no altseason. When it dumped last time, Ethereum exploded. Today? We're neutral to bullish on BTC.
🪜 Bitcoin Chart Setup
Big picture:
In a descending macro channel
Inside it, a smaller ascending channel = current trade zone
📌 Key Levels for Day Trading:
Support: 105,000
Mid-level: 106,261
Resistance: 107,000
Macro Bull Trigger: 109,898
Macro Bear Trigger: 104,405
If we lose 104,405 — short time.
If we reclaim 106,261 — stay long.
🧠 Momentum + divergences + my FxProfessor MA combo are pointing higher. So yeah — I expect 106.2K to get tapped today.
📍 Alerts are ON. Precision mode.
💬 Today’s a double day — 11.11. Is 111,111 next? You tell me.
Just play your levels. I do.
Mindset Check 🧘
If you’re guessing, you’re gambling.
I don’t guess. I read structure, I react, I act.
Want to survive this market? Play like it’s chess, not roulette. Not sure where it's going? Hedge!
Disclaimer
Hey — I’m a day trader. I play the levels. I don’t know what you’re doing i just share what I do!
One Love,
The FXPROFESSOR 💙

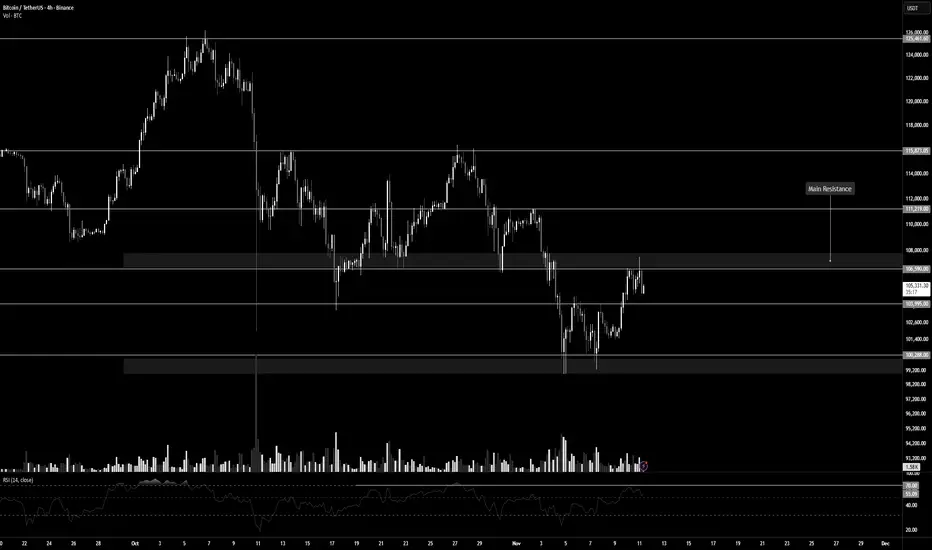
Bitcoin and a Critical Resistance for a Price Breakout | Day 3👋🏻 Hey everyone! Hope you’re doing great! Welcome to the SatoshiFrame channel.
✨ Today we’re diving into the 4-Hour Bitcoin analysis — stay tuned and follow along!
🪙 Bitcoin, in its 4-hour timeframe (as mentioned in previous analyses), is currently sitting below a major resistance level. A breakout above this area could trigger a strong bullish leg, potentially driving price toward forming a new ATH. The key resistance zone is around $106,590, and breaking it could lead to some beautiful market moves.
📊 The buying volume at this resistance is not yet sufficient. If we look closely, since the last touch of the maker-buyer zone at the lower part of the chart, volume has been declining. To break through this resistance, whale candles are needed to absorb all sell orders in the zone — this could lead to a short squeeze.
🧮 The RSI oscillator on the 4-hour timeframe has fluctuated several times below the 70 level, showing two rejections near that area. The 70 RSI level aligns with the $106,590 price resistance, and crossing above it could trigger a strong upward move.
✍️ You can read the possible scenarios for Bitcoin in the rest of the analysis, but since Bitcoin has shown reduced buying volume, it’s best to lower your risk exposure. If the breakout happens, you can reallocate remaining risk toward the next resistance levels.
✅ Long Position Scenario:
A confirmed breakout above $106,590, along with increased buying volume and the RSI surpassing 70, could form a solid long setup on the 4-hour timeframe. Make sure to gather proper confirmations before entering to ensure the best possible trade setup.
❤️ Disclaimer: This analysis is purely based on my personal opinion, and I only take trades when the stated triggers are activated.
TradeCityPro | Bitcoin Daily Analysis #217👋 Welcome to TradeCity Pro!
Let’s dive into the Bitcoin analysis. The market has finally started an upward move, and the triggers we set yesterday have been activated.
⏳ 1-Hour Timeframe
Yesterday, Bitcoin created a smaller range box between the 10,601 and 10,2489 levels, and after breaking the upper range of the box, the price moved up to the upper boundary of the main box at 10,3855.
📊 Volume increased throughout this move, and the strength of the green candles grew significantly. The 10,3855 resistance was also broken, and with the RSI entering the overbought zone, a sharp upward move began.
⚡️ This upward move continued to 10,6412, and after reaching this level, momentum started to slow down, and RSI exited the overbought zone. The price is now ranging below 10,6412.
📈 Today’s trigger:
The key trigger for Bitcoin today is breaking the 10,6412 level. If this level is broken, the upward move will continue.
✔️ In case of a correction, if the price forms a higher low above 10,3855, the bullish trend will remain intact, and the next upward leg could start.
🔽 For a short position, I don’t think we should pursue it yet. We should wait for the trend to turn bearish again. The confirmation for a bearish trend will come if the price stabilizes below 10,3855.
❌ Disclaimer ❌
Trading futures is highly risky and dangerous. If you're not an expert, these triggers may not be suitable for you. You should first learn risk and capital management. You can also use the educational content from this channel.
Finally, these triggers reflect my personal opinions on price action, and the market may move completely against this analysis. So, do your own research before opening any position.

GBPUSD overexhausted.GBPUSD pulled down after news for liquidation. A possible overexahaustion candle has occured and ready for a pull back UP.

Is having a stop loss on Bitcoin embarrassing?Is having a stop loss in the crypto market embarrassing? This isn't just a question—it's a new trading style that's become trendy and has pulled the culture of young crypto traders right into its orbit... a culture without responsibility that wants to escape reality and market principles, chasing higher profits and loftier positions. A culture where 5% monthly profit is laughable to them, and they won't settle for anything less than 50% to 100% gains.
Let's see what happens to this minority in just the past few weeks with this ideology: On October 10, a 16% drop (they get liquidated and wiped out of the market). On September 22, with that long squeeze candle, a 4.30% drop (wiped out for the second time). On November 3 and 4, a 10% drop (wiped out for the third time :))
That said, a huge crowd usually floods the market right before accumulation phases or trend changes (when big investors need liquidity), and after supplying that liquidity, they get wiped out too... I haven't found a precise indicator yet for when these folks show up—if you've got one, comment below; maybe I'll write a script for it myself. But the point is, after these people get liquidated, we usually enter an accumulation phase, followed by a trend reversal. Long squeeze and short squeeze candles are great examples for spotting these crowds, and then you can expect ranging, followed by the trend change.
In the 4H timeframe, we've relatively shifted the range—hopefully forming a higher high and higher low above 104,862.71 . A break of 106,542.82 in the 4H timeframe could be our first trigger for a trend change in this leg. But the main trigger is breaking the resistance at 111,287.45, since this resistance is what triggered the reaction that formed the lower low at 100,503.60—so it's hugely important, and breaking it would put Bitcoin back into uptrend mode.
+ The probability of the US government shutdown ending has hit 84% on Polymarket. Actually, that's what drove the growth in recent days... You might think it's weird—like, shouldn't we grow after good news? I say no, the market moves based on expectations, not news or anything else... Does the expectation say the US government will reopen? Okay, let's grow—that's it.
+ A super important point: Trump officially announced that every American (except high earners) will get $2,000. Something like those stimulus checks during COVID in 2020! Remember that?
And what I'm saying here impacts daily and weekly timeframes, not 4H... So if you're trading in lower timeframes, no need to pay attention to this stuff—per your strategy, if it signals long, open long; if we dump from here and go below 104k, hunt for shorts :) Easy.
If you like these multi-faceted, educational analyses, definitely follow—it's crazy we're still under 1,000. We need a bigger community to pull off even bigger things. Thanks for your attention—till next time, peace out.

USDCAD weak!USDCAD has been moving down with a pull back in Asian session. Came in for about a 1:1 RR.

Bitcoin : Stay heavy on positionsBitcoin : Stay heavy on positions (3x)
A signal for catching a bounce has emerged.
Within 1–2 weeks after the bounce signal, leverage is reduced from 3x to 2x.
** This analysis is based solely on the quantification of crowd psychology.
It does not incorporate price action, trading volume, or macroeconomic indicators.

Next volatility period: Around November 21st
Hello, traders!
Follow us to get the latest information quickly.
Have a great day!
-------------------------------------
(BTCUSDT 1D chart)
This volatility period is coming to an end.
Currently, the HA-High indicator on the 1M chart is showing signs of forming at 110105.69. If it fails to rise above 110105.69, further declines are likely.
Therefore, the key question is whether it can find support around 104463.99-108353.0 and continue its upward trend.
If it fails to rise, the M-Signal indicator on the 1M chart is expected to meet and re-establish the trend.
At this time, the key level is around 89296.25.
-
To break above this key level and continue the uptrend,
the StochRSI, TC (Trend Check), and OBV indicators must show upward trends.
If possible,
- The K indicator on the StochRSI indicator should not have entered the overbought zone.
- The TC (Trend Check) indicator should remain above 0. - The OBV indicator should remain above the High Line.
Therefore, we will determine whether the uptrend can continue by observing the upward movement when the price breaks above the 104463.99-108353.0 range.
-
Thank you for reading to the end.
We wish you successful trading.
--------------------------------------------------
- Here's an explanation of the big picture.
(3-year bull market, 1-year bear market pattern)
We will provide more detailed information when the bear market begins.
------------------------------------------------------

BTCUSDT.P - November 11, 2025BTCUSDT.P is showing potential for a short-term bullish reversal after rebounding from the $100,238–$100,616 support zone. A buy limit is positioned near $100,983, targeting a move toward the $112,833 partial profit zone and the $121,599 profit level. A confirmed breakdown below the $94,111–$98,115 stop zone would invalidate this bullish setup and indicate renewed downside momentum.
Risk Assessment: Moderate — Price action suggests early bullish recovery signs, but confirmation depends on holding above $100,900 and sustaining momentum past $112,800.

BTCUSD — All Targets HitCORE5 Market Note
- Market Structure Mapping (MSM)
Bitcoin (BTCUSD) hit our weekend targets early and bounced from the volume fractal at 106.463.
Price still trades inside the bearish range from 116.432 (high) to 98.952 (low) — the same structure carried over from last week.
BTC is now testing the midrange zone, trading lower within the daily structure.
MSM shows a sell reaction from the fractal, but we still need a proper shift in structure before bias confirms.
For now, it’s a waiting game — the London session already delivered strong moves, so patience remains the higher-probability play.
- Volume Flow Analytics (VFA)
The weekly fractal near 100.996 has absorbed nearly five days of price action — a clear zone where buyers stepped in with size.
Above, the 106.463 fractal marks where sellers defended, creating two strong reference points that now frame the market.
These levels must break before any clear directional bias forms.
Until then, it’s still a waiting game.
- Macro Context
The U.S. dollar softened as traders expect more Fed rate cuts ahead, while Washington moves closer to reopening the government.
That calmer tone helped risk markets rebound — Bitcoin included.
If yields stay near 4.1% and confidence keeps building, crypto has room to recover.
But a sudden dollar rebound could flip sentiment fast.
🧠 CORE5 RULE: The next move doesn’t need you — it needs confirmation.
— CORE5DAN
Institutional Logic. Modern Technology. Real Freedom.
