Binance Coin starts to recover, bullish bias heart-confirmationFinally... Now I can say with a high level of certainty that Binance Coin is set to move higher. Now I can say for sure that the low is in. Now, right now, the Cryptocurrency market is going up.
Look at today's candle... Look at the long lower wick. Look at the full body and the action happening at the top. Look at how the market continued to pierce lower and lower, but trading volume was very low.
All the same signals we looked at before continue to be valid today. With each passing day of bearish action, these reversal signals became stronger, not nullified nor invalidated, stronger, and this is shown by today's candle.
This is it. This is one of the big three...
The market is unforgiving when it goes down; it can be beautiful when it goes up.
Were you able to hold strong during the crash? Did you panic and sold at the lows?
Were you able to accumulate, buy, when prices were low?
Are you able to buy now?
Are you going to buy now? It is a good question because Crypto is going up. Binance Coin is going up. Bitcoin is going up. Ethereum is going up. Solana is going up. XRP is going up...
The signals are already in. The necessary and expected behavior on the smaller projects is starting to show up. The energy changed in a flash, this morning... Thanks a lot for your continued support.
We might doubt the market and the charts, but you can never doubt your heart.
Namaste.
BNB

BNB: which is closer to 500$ or 1000$?Greetings to all 😊
📍 According to the results of the voting, the majority chose the Binance - BNB exchange token for analysis, and I will add that the material is not an investment recommendation and is published solely for informational purposes. Therefore, always make a decision according to your risk-based strategy.
🔎 from the latest news and observations on the coin:
▫️ In the second half of 2025, capital began to flow into Solana, Avalanche, Polygon, and BNB Chain, as funds and issuers began distributing bids across multiple networks at once.
▫️ January 15 - Quarterly burning of $BNB. 1,372 million BNB worth about $1.3 billion were burned.
▫️ Grayscale is considering new coins for investment products. BNB is among them.
▫️ BNB Chain has updated Fermi: the time between blocks will be reduced, the network will become faster
▫️ has added support for BNB Chain – deposits and withdrawals in BNB are now available on its American counterpart Polymarket.
It can be concluded that the network is becoming scalable and covers more and more coverage areas.
⚪ Let's move on to the graphical part and start with the global (12M) charts.:
the upward movement structure
closed the year with buyer's priority, but a zone of interest was formed from below in the form of IMB - 500$ - 350$, which can become a support zone if the coin (and the market as a whole) shows a decline
⚪ Monthly chart: the price is forming a corrective movement
in the first support zone (POI) of $730 - $ 674, which coincides with the level of last year
⚪ Weekly TF: there is also a corrective movement within the ascending wave (here I note that the correction looks aggressive, which may indicate the duration)
There is an IMB seller zone on top in the range of $1,019 - $1,043, which the price can test before continuing the decline.
⚪ on the daily timing , the structure is downward and now the price is in uncertainty
from the current it would be necessary to show strength with the price delivery to the weekly IMB zone
if the price is pushed at the opening of the month ($864), then I expect a decrease for the next withdrawal of $ 790
💡 Bottom line: if we consider this coin for an investment portfolio, then I would expect lower prices. I am currently focused on trading short-term positions, as the market has recently been very responsive to geopolitics and is increasingly characterized by uncertainty.
If the review was useful, please rate 🚀
And in the comments, write which coin to disassemble next!
Have a good trade 🔆

Binance coin, bullish lower low —Relief rally target updatedAs we look into the big three, I want to show how a bullish rally is still possible by mentioning just a small detail on the BNB (Binance Coin) daily chart. Let's see if you can agree.
A bullish lower low, how?
The low 21-November 2025 was $790. The lower low 31-January 2026 was $750, a difference of only 5% after 71 days of range trading. To me, this looks like a stop-loss hunt event. A stop-loss hunt move is a bullish development once it is over.
It can also happen that we are witnessing a bearish continuation and this bearish move is just early.
The RSI is now moving within the oversold (weak) zone and trading volume is low on the drop. There is potential for a reversal in the coming days.
The chart signals and market conditions still support a relief rally, a lower high compared mid-October 2025 followed by a strong bearish wave.
The numbers have been updated on the chart. The main target for the next move sits around $1,136.
Thank you for reading.
Namaste.

BNB/USDT 1h chart📈 Market Structure
• Short-term trend: up
You have a clear uptrend line + a sequence of higher lows.
• Breakout from consolidation and a quick upward impulse → now a natural pause/technical correction.
⸻
🔴 Key Levels (you marked them very well)
Resistance:
• 861.7 – local resistance / impulse peak
• 869–872 – supply zone (next target, but only after a breakout)
Support:
• 850.4 – key intraday support (currently MOST IMPORTANT)
• 842.9 – deeper correction, but still healthy
• 832.2 – trend invalidation boundary (going below = structure change)
⸻
📊 Price Action
• After a strong green candle, you have small red candles at resistance
👉 classic pullback / short-term distribution, not an immediate reversal.
• No aggressive supply (no large red candles) = bulls still control the market.
⸻
⚠️ Stochastic RSI
• We're high (70–80)
• The lines are starting to flatten → the market is temporarily overbought
• This is NOT a short signal per se, but:
👉 Watch out for a correction or consolidation
⸻
🎯 Scenarios
🟢 Baseline scenario (most likely)
• Pullback to around 850–852
• Defending the level
• Another attack on 861.7
• After the breakout → 869–872
👉 Buy the dip, don't chase the price.
⸻
🟡 Corrective Scenario
• Fall to 842–845
• Still OK, trend remains intact
• Ideal zone for a long swing
⸻
🔴 Negative Scenario
• H1 close below 832
• Trendline breakout
• Change in structure → possible return to 820–810

GOLD DROPPING BADLYXAUUSD is showing a strong impulsive bullish structure on the higher timeframe followed by a sharp rejection candle, signaling a corrective phase after an overextended rally rather than a confirmed trend reversal, with price pulling back into a key Fibonacci retracement and previous breakout demand zone where resistance flipped to support, a classic breakout and retest scenario watched by smart money and trend traders. The broader market context still favors gold strength as safe haven demand, inflation hedge positioning, central bank gold accumulation, and ongoing macro uncertainty continue to underpin the long term bullish narrative, while short term volatility is being driven by US dollar flows, bond yield expectations, and high impact economic releases that temporarily fuel profit taking after parabolic moves. Technically this is a healthy pullback within an overall uptrend, with liquidity being rebalanced and momentum resetting from overbought conditions, and as long as price holds above the major demand block and structural higher low zone, dip buying, trend continuation, bullish order flow, and breakout retest setups remain the dominant strategy for positioning toward higher resistance levels once the correction completes.

BNB/USDT – Liquidity Grab & Potential ReversalHi!
Price recently hunted liquidity above resistance (~905–910) and failed to hold, showing rejection at the highs. The first bearish engulfing has already printed, signaling short-term weakness.
If another bearish engulfing forms around this area, it would confirm sellers stepping in, opening the path for a pullback toward the demand zone at 868–872.
As long as price remains below the hunted level, downside continuation is favored. A clean reclaim above 910 would invalidate the bearish idea.
Bias: Short-term bearish
Resistance / liquidity: 905–910
Confirmation: Second bearish engulfing ($893 area)
Target: 868–872 demand zone

[MEME-PLAY] - 4 - 4
Meme-play - No thesis - Quick in - Out.
Notes on how I personally use my charts/NFA:
Each level L1-L3 and TP1-TP3 (Or S1-S3) has a deployment percentage. The idea is to flag these levels so I can buy 11% at L1 , 28% at L2 and if L3 deploy 61% of assigned dry powder. The same in reverse goes for TP. TP1: 61%, TP2:28% and TP3:11%. If chart pivots between TP's, in-between or in Between Sell levels these percentages are still respected. I like to use the trading range to accumulate by using this tactic.
Just my personal way of using this. This is not intended or made to constitute any financial advice.
This is not intended or made to constitute any financial advice.
NOT INVESTMENT ADVICE
I am not a financial advisor.
The Content in this TradingView Idea is for informational purposes only, you should not construe any such information or other material as legal, tax, investment, financial, or other advice. Nothing contained within this idea constitutes a solicitation, recommendation, endorsement, or offer to buy or sell any securities or other financial instruments in this or in in any other jurisdiction in which such solicitation or offer would be unlawful under the securities laws of such jurisdiction.
All Content on this idea post is information of a general nature and does not address the circumstances of any particular individual or entity. Nothing in the idea/post constitutes professional and/or financial advice, nor does any information on the idea/post constitute a comprehensive or complete statement of the matters discussed or the law relating thereto. You alone assume the sole responsibility of evaluating the merits and risks associated with the use of any information or other Content on the idea/post before making any decisions based on such information.
Sir. Galahad - QUANT
Disclaimer
The information and publications are not meant to be, and do not constitute, financial, investment, trading, or other types of advice or recommendations supplied or endorsed by.

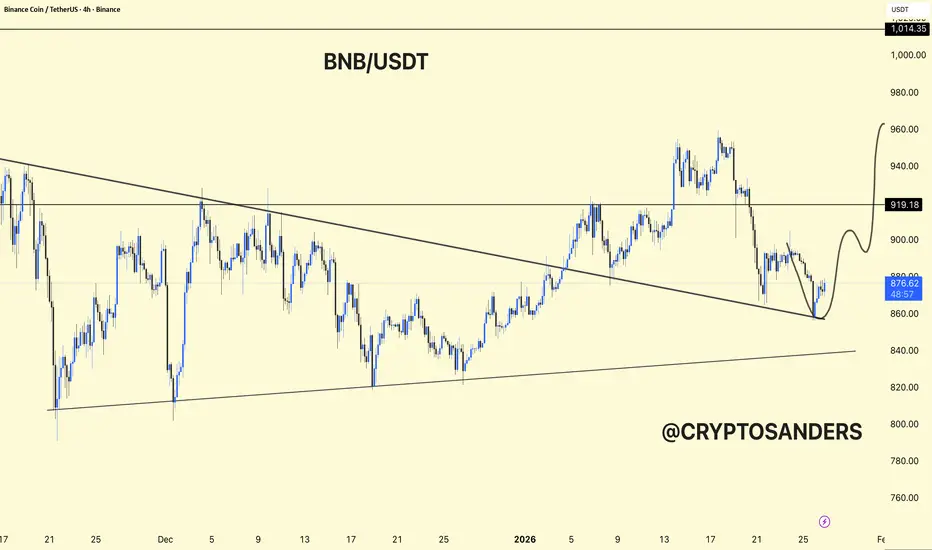
BNBUSDT – 4H Chart Update.BNBUSDT – 4H Chart Update.
BNB is moving inside a descending channel.
Price is reacting from the lower trendline support around 860–870.
A short-term relief bounce is possible from this zone.
If momentum builds, upside targets are 900 → 920 → 960.
Failure to hold 860 may push the price toward 840–820 support.
Support-based bounce setup, trend still corrective.
⚠️ Trade with confirmation and strict risk management.
BNBUSDT M15 HTF Supply Reaction and Bearish Continuation Setup📝 Description
BNB has pushed into a short-term premium zone after a corrective bounce and is now showing hesitation below a 15-minute Fair Value Gap. The recent upside move lacks strong bullish continuation, and price is reacting from a supply-aligned area, increasing the probability of a downside rotation.
________________________________________
📉 Signal / Analysis
Primary Bias: Bearish below the 15m FVG and intraday highs
Preferred Setup:
• Entry: 872.61
• Stop Loss: Above 874.33
• TP1: 870.90
• TP2: 868.10
• TP3: 864.90
________________________________________
🧠 ICT & SMC Notes
• Price reacting from 15m FVG in premium
• Weak bullish follow-through after mitigation
• Internal buy-side liquidity already tapped
• Downside targets aligned with BPR and lower imbalance zones
________________________________________
📌 Summary
As long as price remains capped below the 873–874 resistance area, the bearish continuation scenario remains favored. Current price action suggests a corrective pullback has likely completed, with expectations of a rotation toward lower liquidity pools.
________________________________________
🌍 Fundamental Notes / Sentiment
No strong bullish catalyst is currently present for BNB, and broader crypto sentiment remains vulnerable to short-term pullbacks. This environment supports mean-reversion and liquidity-driven downside moves rather than sustained upside continuation.
________________________________________
⚠️ Risk Disclosure
Trading involves substantial risk and may result in capital loss. This analysis is for educational purposes only and does not constitute financial advice. Always apply proper risk management, predefined stop-loss levels, and disciplined position sizing aligned with your trading plan.

BNB/USDT 4H Chart📌 Market Structure
• The uptrend has been broken – a clear breakout of the black trend line + an impulsive decline.
• Currently consolidating after a drop → a classic bear flag/base after a downward impulse.
• The market is in a decision phase, not in a trend.
⸻
🟥 Key Levels
🔴 Support
• 890–888 → current fighting zone (local HL after dump)
• 872 → very important support (if broken → acceleration of the decline)
• 849 → last line of defense for the bulls
🟢 Resistance
• 901 → first resistance (local LH)
• 923 → strong S/R flip (this is where the avalanche began)
• 958 → key structural resistance (return to bullish scenario)
⸻
📉 Momentum & RSI
• Stochastic RSI:
• High/overbought → weak fuel for growth
• Typical spot for a recoil or false breakout
• No bullish divergence → no signal yet Reversals
⸻
🎯 Scenarios
🐻 Baseline Scenario (more likely)
• Recoil from 890–901
• Pullback to 872
• If 872 breaks on volume → quick move to 849
➡️ This is a classic pullback → continuation
⸻
🐂 Alternative (conditional) Scenario
• Defense 888–890
• Breakout of 901 + close of the 4-hour candle
• Retest of 901 as support
• Target: 923, and only then consider 958
➡️ Without a breakout of 901, there is no way the uptrend will resume

BNB/USDT – 4H Chart UpdateBNB/USDT – 4H Chart Update
BNB is trading near the descending trendline resistance while maintaining higher lows from the demand zone.
🔹 Structure: Gradual recovery within a descending channel
🔹 Support Zone: 820 – 840 (strong demand holding well)
🔹 Immediate Resistance: 890 – 900
🔹 Major Resistance: 920 – 1,000
A strong 4H close above 900–920 can trigger a breakout and accelerate price toward 1,000+.
If the price gets rejected from the trendline, a pullback toward 860–840 is possible before the next move.
Market Bias: Neutral to bullish
Wait for confirmation at resistance for the next trade setup.

#BNB/USD Buy Trade Scenario.Here’s an up-to-date BNB/USD Buy trade outlook (technical + fundamental) to help you assess whether positioning for a Upside makes sense right now.
Thank You......

Exchange Tokens and What the Market Often Realizes Too LateToday in Davos, Changpeng Zhao (CZ) once again stated a simple but important idea:
the crypto industry has already proven its effectiveness at scale.
If you strip away noise and emotions, one fact becomes obvious:
exchanges are among the most resilient and profitable businesses in crypto.
___________________________________________
📌 A note on context and timing
For additional context, I want to point out that this is not a new thesis for me.
I already wrote about cryptocurrency exchanges as a core growth layer back on April 17, 2020 — almost six years ago — and shared a dedicated chart at that time.
What’s important here is not the post itself, but what happened after.
If you now open that historical chart and review each native exchange token that was included back then, you’ll notice an interesting detail:
Almost all of them have outperformed Bitcoin over time — on a relative basis.
Some did it by 1x, some by 2x or more, but the key point remains the same:
at today’s levels, their performance relative to BTC has increased.
That outcome was not driven by hype.
It was driven by:
growing volumes
expanding functionality
and exchanges evolving into full-scale platforms
Which is exactly why this topic keeps returning every cycle.
___________________________________________
🔍 What matters here
On the chart, you see native tokens of centralized and decentralized exchanges.
No marketing narratives. No promises. Just long-term performance.
There is a clear pattern:
volumes → fees
fees → business sustainability
sustainability → native token valuation
In essence, a native exchange token reflects the real state of the exchange itself.
___________________________________________
🔁 Why this topic is relevant again
Over recent cycles, the market has already seen:
strong performance from perpetual DEX tokens GETTEX:HYPE SEED_WANDERIN_JIMZIP900:ASTER and other
token distributions based on activity and trading volumes
situations where users gained exposure before any public announcements
One important point is often overlooked:
Exchange tokens are usually distributed (Airdrop) not for waiting,
but for actually using the platform.
Trading activity, volumes, account engagement, and interaction with features
are what historically determine future allocation.
Many people are actively doing this now, building volumes on their accounts to receive a drop in the form of future exchange tokens.
Using diversification, they open positions in different directions on different exchanges.
___________________________________________
🧠 A subtle point many miss
The market currently has:
- exchanges with existing tokens
- and exchanges without tokens yet, but with rapidly growing activity
Historically, this second category often provides:
- better risk-to-reward asymmetry
- the ability to build exposure early
- exponential upside potential after launch
This is not about short-term trades.
This is about long-term accumulation over months.
___________________________________________
⚠️ Look closely at the charts
The overall structure is surprisingly consistent —
and that consistency itself is a signal.
The market consistently rewards:
- infrastructure
- liquidity
- real business models
Not narratives.
💬 Question to you
I’m curious about your perspective.
Share in the comments:
- which CEXs or DEXs you actively use
- whether you track exchanges without native tokens yet
- if you consider activity and volume important long-term factors
- which segments currently look most undervalued to you
I read the comments carefully,
and if there’s interest, I’ll continue this topic in future posts.
This post is for those who think one cycle ahead,
not just about the next price move.
Best regards EXCAVO

#BNB/USD Buy Trade Setup.Here’s an up-to-date BNB/USD Buy trade outlook (technical + fundamental) to help you assess whether positioning for a Upside makes sense right now.
Thank You......

GBPNZD NEXT MOVEGBPNZD is showing a clear bearish reversal setup after breaking down from an ascending channel and losing key trendline support, signaling a shift in market structure toward sellers. The strong impulsive bearish candle indicates increasing downside momentum, with price now targeting the major demand zone below where previous accumulation and strong buying reactions occurred. Fundamentally, the New Zealand dollar is gaining relative strength on expectations of tighter monetary conditions and stable economic outlook, while the British pound remains pressured by growth concerns, inflation sensitivity, and policy uncertainty. As long as price remains below the broken trendline and fails to reclaim prior resistance, rallies are likely to be corrective, favoring continuation toward lower liquidity zones, making short-side positioning aligned with trend, structure, and macro flow for profit-focused trading.

NZDJPY NEXT MOVENZDJPY is showing a strong bullish continuation after reclaiming and holding above a key demand and resistance flip zone, confirming a market structure shift in favor of buyers. The impulsive move higher followed by shallow consolidation signals healthy momentum and sustained buying interest, often seen before another expansion leg. From a fundamental perspective, the New Zealand dollar remains supported by relatively resilient economic outlook and carry trade demand, while the Japanese yen continues to weaken due to accommodative monetary policy, low yield environment, and persistent divergence against higher-yielding currencies. As long as price maintains above the breakout zone and continues to print higher highs and higher lows, the probability favors further upside continuation, making pullbacks into structure attractive for trend-following long opportunities with momentum, liquidity flow, and macro bias aligned for profit potential.

#BNB at the Edge: Breakdown Confirmed with RSI Divergence
Yello Paradisers! Have you seen what just happened with #BNB? After weeks of upward momentum, BNB has broken down from its ascending channel — and this move might just be the start of a much bigger shift in trend.
💎#BNB clean break of the trendline connecting wave 2 and wave 4 in the Elliott Wave structure — a textbook sign that the motive wave sequence may have completed. Adding to this, there’s a clear bearish divergence between wave 3 and wave 5 within the ascending channel, signaling fading momentum. This move is also part of a much larger ascending structure on the higher timeframes, making the breakdown even more meaningful. Importantly, it was accompanied by a clear structure shift (CHoCH), confirmed by strong volume and a bearish RSI divergence — all pointing toward high-probability trend reversal conditions.
💎Right now, minor support is being tested near the larger ascending channel’s trendline at $850. Below that, major support sits around $820 — the previous swing low from which the last bullish leg began. This is a key zone, and a breakdown below it could accelerate the selloff and firmly shift sentiment to the bearish side.
💎On the upside, major resistance remains around $960. In addition, the Fibonacci resistance zone between 0.618 and 0.786 will act as a critical battleground. We expect this area to be a key decision point, where bulls and bears will fight for short-term control of the trend.
We are playing it safe right now, Paradisers. If you want to be consistently profitable, you need to be extremely patient and always wait only for the best, highest probability trading opportunities — only on confirmations.
MyCryptoParadise
iFeel the success🌴

GBPUSD BULLISH MOVEGBPUSD is developing a bullish reversal setup after compressing inside a falling wedge structure, with price now breaking above the upper trendline and signaling a shift in short-term momentum. This type of breakout typically reflects seller exhaustion and increasing buying pressure, especially when it aligns with improving market sentiment. Fundamentally, the British pound is finding support from stabilizing UK economic data and expectations that the Bank of England will remain cautious on aggressive rate cuts, while the US dollar is facing pressure from softer yield expectations and a more balanced Federal Reserve outlook. As long as price holds above the broken wedge resistance and maintains higher lows, continuation toward upside liquidity zones becomes the higher probability scenario, offering a favorable trend-following opportunity with strong risk-to-reward aligned with structure, momentum, and current macro flows.

USDCAD NEXT MOVEUSDCAD is showing a clear bearish continuation setup after losing a key demand zone that previously acted as strong support, now confirmed as a valid breakout area. Price rejection from this zone signals a shift in market structure, with sellers firmly in control and momentum aligning to the downside on the 4H timeframe. From a fundamental perspective, Canadian dollar strength is being supported by stable crude oil prices and relatively resilient domestic data, while the US dollar is facing pressure from expectations of softer monetary policy and cooling inflation outlook, creating a favorable environment for further downside in USDCAD. As long as price remains below the broken support zone, downside continuation toward lower liquidity levels remains the higher probability scenario, offering a clean risk-to-reward opportunity in line with trend, structure, and macro-driven flows.

XAUUSD Next MoveXAUUSD continues to trade in a strong bullish continuation structure after a clean breakout and hold above the prior supply turned demand zone, confirming sustained institutional buying interest. The higher highs and higher lows on the daily timeframe reflect strong trend momentum, with price acceptance above the key consolidation range signaling trend continuation rather than exhaustion. Fundamentally, gold remains supported by persistent safe-haven demand, ongoing geopolitical uncertainty, central bank gold accumulation, and expectations around easing monetary policy and lower real yields, all of which favor upside pressure. As long as price holds above the reclaimed demand zone and maintains bullish structure, the market bias remains firmly bullish, with momentum favoring continuation toward higher psychological levels and offering strong trend-following opportunities aligned with smart money flow and broader macro strength.

BNB USDT Analysis
On the daily timeframe for BNB, I observe that the price is holding above the green trend line. It has recently passed a significant level of resistance/support (marked in pink) and is currently trading above it. For further confirmation, I will be watching for the price to break above the small resistance level indicated in yellow.
Stay Tuned for our next updates!
@SHARP-SHOT

$BNB 1W: Bullish update going into the week of Jan 19BNB update.
BNB is starting to lean bullish again on the weekly, and the structure here looks constructive rather than exhausted. After the sharp impulse higher and the fast pullback from the highs, price has stabilized and is now reclaiming the ~$900–950 region, which is an important pivot zone on this chart.
What stands out is how well BNB respected higher timeframe support. The pullback never threatened the $660–670 level, which was former resistance and is now clearly acting as strong support. That’s classic trend behavior and suggests the larger uptrend remains intact.
The recent move higher looks like the market is forming a higher low and rotating back up rather than rolling over. This type of consolidation after a strong expansion often resolves higher once sellers are absorbed, especially when price reclaims prior value instead of stalling below it.
As long as BNB holds above the $900 area on a weekly closing basis, the bullish bias remains valid. Acceptance above this zone increases the odds of continuation toward the prior highs and potentially a new leg higher later in the cycle.
If price were to lose $900 and especially $660, that would shift the narrative back to deeper consolidation. Until then, this looks like strength after a reset, not distribution. Overall, BNB is acting like a leader again, and the path of least resistance is starting to tilt back to the upside.

BNB Analysis: Bullish Wedge BreakoutHi
BNB has formed a classic wedge pattern following a strong impulsive move to the upside. After consolidating within this structure, price has now broken out above the upper trendline, signaling a continuation of bullish momentum.
Based on the measured move of the pattern, the first upside target is around $968, followed by a secondary target near $988.
The $940–$945 zone (highlighted in gray) appears to be a solid support and potential long entry area, especially if price pulls back and shows bullish confirmation from this region.
Overall, the structure favors the bulls as long as price holds above the breakout level and respects the gray support zone.
