[BNBUSDT] If you are interested in this one... Eazy clap..No need to say anything, just got in short at 373.5 as I stumbled on it by chance.
I will do this trade following the red line.
Might work, might not, x50 tight SL 374.61
Enjoy,
Cheers!
BNB

BNB/USDT 1DAY UPDATE BY CRYPTOSANDERS !!Hello friends, welcome to this BNB/USDT update from Crypto Sanders.
Chart Analysis:- Hello friends, what do you think after seeing the chart? Please comment on the BNB WEEKLY update.
Surprisingly, Binance Coin is the best performer on our list after increasing its price by 6% this week and hitting a new yearly high. The bias is bullish, but current market sentiment may temper expectations of higher price levels.
For this rally to continue, buyers need to push BNB above 377 and claim this level as key support. This will open the door to higher prices due to which this cryptocurrency can break above 400.
Binance Coin could make new highs if buyers remain determined. Failure to sustain above 377 could lead to price correction towards 330 or 300.
I have tried to bring the best possible results in this chart.
If you like it, hit the like button and share your charts in the comments section.
Thank you.

BNB Want to run higherBinance Coin is for sure in a good momentum and the trend is strongly bullish. I expect a continuation of the bullish trend till the resistance level at 414 where i will look for a short entry. The first resistance level is 390, my main ideas is not to long now but to wait for a short

BNB THE CRYPTO PRINCE : HOW FAR AWAY $8.00 FEELS. SHORT SIGNALBeen watching this coin deliver the bidniz year after year since the ~$8.00 mark..
I've had good times trading..
In Kuala Lampur..
Bought the second wife there, yeah..
ENTRY: ~$380.00
TP: ~$265.00
Too bad if you're a Yank..
Daddy said you can't trade short, uh-uhuh...
Tsk-tsk.. )
// Follow its progression:
dub.sh

The Dawn of a New Bull Season: BNB's Breakout Towards the FibonaThe Dawn of a New Bull Season: BNB's Breakout Towards the Fibonacci Golden Zone
In the ever-evolving landscape of digital currencies, BNB is currently at the forefront of an anticipated market trend, hinting at the beginning of a new bull season. This potential shift comes after a period where BNB, unlike its rivals BTC and ETH, which have successfully surpassed their Fibonacci Golden Zones, struggled to establish a solid foundation for a bull run. However, the tide seems to be turning for BNB, especially with its valuation against Bitcoin showcasing a significant breakout from its previous downward resistance.
BINANCE:BNBUSDT Couldn't Hold Its Support while BTC and ETH did Hold
Navigating Through the Bear Season
BNB's path through its bear season has been markedly different from that of BTC and ETH. While these cryptocurrencies have managed to breach and advance beyond their Fibonacci Golden Zones, BNB has grappled with establishing a consistent bull season support line. This struggle has been a point of contention for BNB, underlining the significance of its recent move towards the Fibonacci Golden Zone.
BITSTAMP:BTCUSD Broke Its Fibonacci Golden Zone
BINANCE:ETHUSD Broke Its Fibonacci Golden Zone
A Shift in Market Dynamics
The landscape is now changing for BNB. Its recent breakout against Bitcoin's valuation marks a pivotal development, suggesting a robust shift in market dynamics. This breakout from the downward resistance is critical, as it not only signifies a reversal in trend but also sets the stage for BNB to retest its broken trend line. This retest is crucial, as it could potentially catapult BNB into a significant upward trajectory.
BINANCE:BNBBTC Bear Channel Broken
The Importance of the Fibonacci Golden Zone
The Fibonacci Golden Zone plays a vital role in this narrative, serving as a key indicator for potential market reversals. For BNB, approaching this zone is more than a mere technical milestone; it represents a potential turning point that could reaffirm investor confidence and signify the start of a bullish market phase.
Catalysts Behind BNB's Anticipated Breakout
The BNB Chain is setting ambitious goals for 2024 to foster mass adoption across decentralized finance (DeFi), gaming, artificial intelligence (AI), and other decentralized applications (DApps). They aim to enhance performance, introduce "opBNB Connect" for scalability, and focus on applications with the potential for high daily active users. This initiative includes plans to increase the number of active validators from 40 to 100, merge the Beacon Chain for improved blockchain efficiency, and speed up decentralization. The introduction of the "One BNB" concept aims to unify the layer-1 BNB Smart Chain (BSC), opBNB, and Greenfield, facilitating a seamless tech stack for applications to transition to fully on-chain Web3 frameworks. Additionally, BNB Chain will enhance its middleware infrastructure and launch BNB Greenfield 2.0 to improve storage performance and support AI, on-chain gaming, and decentralized social platforms.
The Road Ahead
As BNB moves closer to its Fibonacci Golden Zone and retests its broken trend line against Bitcoin, the anticipation within the crypto community intensifies. A successful retest and potential upward movement could not only validate BNB's market potential but also signal the start of a significant bull run. However, given the volatile nature of the crypto market, caution and thorough analysis remain paramount.
BNB's journey towards the Fibonacci Golden Zone, coupled with its breakout against Bitcoin, marks a potential watershed moment for the cryptocurrency. This movement could redefine BNB's market position relative to BTC and ETH, heralding a new era of growth and market dominance.
This discussion is speculative and intended for educational purposes, providing a hypothetical overview of BNB's market potential. It is not financial advice, and individuals should conduct their research and consult with financial advisors before making investment decisions.
BINANCE:BNBBTC BINANCE:BTCUSDT.P BINANCE:BNBBTC

BNB/USDT 1HInterval Chart ReviewI invite you to review the BNB chart, on a one-hour interval. We will start by identifying the main uptrend line with the yellow line.
Moving on, we will move on to marking the places of resistance. And here, after unfolding the trend based fib extension grid, you can see how the price has currently bounced off the strong resistance at $374.5, which is located at the so-called golden point of 0.618 Fib. Looking further, when the price breaks above the current resistance, the important resistance level is around $393.
By looking the other way, we will designate supports. And here support is visible at the level of $361, and then the level around $352 should be kept in mind.
At this point, it is also worth determining the locally ongoing upward trend over which the price is staying.
If we look at the RSI indicator, we will see a recovery just before the upper limit, similar behavior can be observed on the STOCH indicator, and in both cases there is still room for a deeper recovery.

BNB is LongBNB is long till $366 now, keep your SL tight. market has given enough shakeout yesterday

BNBUSDTBased on the given market data, the Binance Coin (BNB) is currently trading at $348 against USDT. The Relative Strength Index (RSI) for 4 hours, 1 day and 7 days are 44.49, 75.01, and 76.11 respectively. This indicates that the coin is in a neutral zone in the 4-hour interval, but is overbought in the 1-day and 7-day intervals.
The Moving Average Convergence Divergence (MACD) for 4 hours, 1 day and 7 days are 1.5, 13.5 and 23.5 respectively. This suggests a bullish trend in the market as the MACD is above zero in all intervals.
The Bollinger Bands (Bb) for 4 hours, 1 day and 7 days are 361.0, 366.0 and 366.0 respectively. The current price is below the middle band in all intervals, indicating a potential upward movement.
The support levels for 4 hours are $344, $331, and $326, whereas for 1 day they are $339, $325 and $304, and for 7 days they are $284, $263 and $222. The resistance levels for 4 hours are $358, $368, and $379, whereas for 1 day they are $367, $378 and $386, and for 7 days they are $367, $401 and $454.
In conclusion, the technical analysis indicates a bullish trend for BNB. However, the overbought conditions suggested by the RSI for 1 day and 7 days might trigger a price correction in the short term. As always, it's essential to consider these indicators in conjunction with other factors and your individual risk tolerance.

BNB: Resistance BreakoutTrade setup : Price remains in an Uptrend. After consolidating in a Bullish Flag pattern, price broke out in the direction of the existing Uptrend and broke above our target of $350. Potential upside to $400 next (+14% gain). Stop Loss (SL) at $320.
Pattern : Bullish Flag pattern. Short term small rectangle trading range between diagonal parallel lines. It moves counter to the prevailing price trend observed in a longer time frame on a price chart. It forms typically following a sharp advance and often indicates a small change in direction (or areas of consolidation) before the previous trend resumes. Flag pattern is among the most reliable continuation patterns that traders use because it generates a setup for entering an existing trend that is ready to continue. Trade is initiated on a breakout, if it is in the same direction as the prevailing trend. Also, with bullish flag patterns, traders prefer a breakout with an increase in volume but it isn’t a must.
Trend : Uptrend across all time horizons (Short- Medium- and Long-Term).
Momentum is Bullish but inflecting. MACD Line is above MACD Signal Line and RSI is above 55 but momentum may have peaked since MACD Histogram bars are declining, which suggests that momentum is weakening.
Support and Resistance : Nearest Support Zone is $300, then $260. The nearest Resistance Zone is $350, which it broke, then $400.

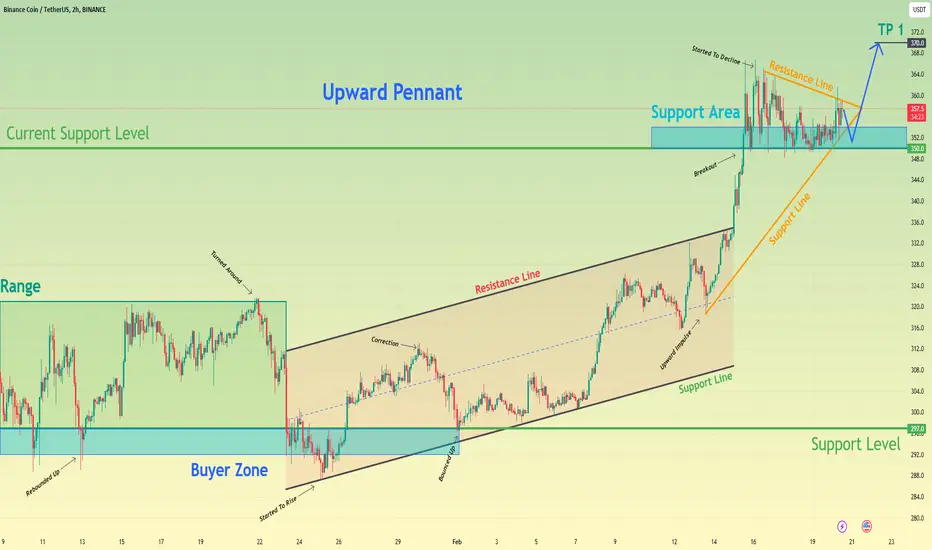
Binance Coin can exit from pennant and rise to 270 levelHello traders, I want share with you my opinion about Binance Coin. Looking at the chart, we can see how the price a few time ago traded in a range, where it two time fell to the buyer zone, which coincided with the support level. In a second try, BNB rebounded from this zone and rose to the top part of the range, after which turned around and in a short time declined back, thereby exiting from range and breaking 297 one more time. Then the price started to rise in an upward channel, where soon, BNB rose higher than the 297 level and later made a correction movement to this level, which coincided with the support line of the channel. Next, the price bounced from this line and continued to move up in the channel to the resistance line, but when it reached this it, BNB rebounded, entered to the pennant, and made a strong upward impulse to the resistance line of this pattern, thereby exiting from the channel and breaking 350 level, which coincided with support area. But a not long time ago price rebounded from this line and declined to support area. At the moment, BNB trades near the resistance line of the pennant and I think that the price can fall to the support area and then continue to move up, thereby exiting from the pennant. For this reason, I set Take Profit at the 270 level. Please share this idea with your friends and click Boost 🚀
BNBUSDT Good Buy Opportunity!!BNB/USDT has recently undergone positive corrections, setting the stage for a significant upward movement. The chart indicates a potential breakout beyond the next resistance level, presenting a promising buying opportunity. Investors are anticipating substantial returns in the near future as the asset shows signs of a robust upmove."
BNBUSDT (1D Chart) Technical analysis
BNBUSDT (1D Chart) Currently trading at $301
Buy level: Above $301
Stop loss: Below $260
TP1: $335
TP2: $350
TP3: $400
TP4: $460
Max Leverage 3x
Always keep Stop loss
Follow Our Tradingview Account for More Technical Analysis Updates, | Like, Share and Comment Your thoughts

FET Is The Next BNB - MOON Coin MartyBoots here. I have been trading for 17 years and I am here to share my ideas with you to help the Crypto space.
FET Is The Next BNB- Its a MOON Coin
It has very good structure and price action , it reminds me of how BNB set up last Bull market before it went parabolic
I would not sleep on it Please watch the video for more information
MartyBoots

Binance Coin still in fourth wave. Looks bullish💰💸💵📈Reviewing the Binance Coin (BNB) against Tether (USDT) chart, it's notable that the Elliott Wave structure points to us currently being in the fourth wave. Correcting the previous analysis, we do not see the completion of the fifth wave but rather the fourth wave, which suggests that the market is in a corrective phase rather than an impulsive final wave push.
The presence of high-volume nodes at lower price levels indicates significant trading interest, which could act as potential support zones for BNB if the price retraces. The areas of liquidity highlighted on the chart (not specified by color) are of particular interest, as they often represent levels where institutional investors might place substantial orders.
Fibonacci retracement levels drawn on the chart serve as technical landmarks for potential reversals or continuation of trends. For instance, the 0.618 retracement level around the 322-325 USD range is a critical area to monitor for potential institutional activity, as reversals often occur at such key Fibonacci levels.
In terms of candlestick formations, large bullish candles with long lower wicks can indicate strong buying interest at lower prices, while long upper wicks can suggest selling pressure at higher price levels. These candlestick patterns, combined with the identified Elliott Wave phase and liquidity areas, help create a narrative around potential smart money actions.
To capture the sentiment of smart money, it's crucial to observe how price reacts upon reaching these significant levels. Any substantial breakout or reversal at these points could signal smart money's influence on the market, providing insights for strategic entry or exit points.
As we continue to observe BNB's price action, we must remain flexible to the market's dynamics and adjust our analysis as new information unfolds, always considering the potential strategies and movements of smart money within the market's structure.

BNB/USDT 4HInterval ChartPlease see the BNB to USDT chart in the 4-hour time frame. As you can see, the price has dynamically broken out of the local downward trend line.
After deploying the trend based fib extension tool, you can see a strong resistance at $371, and then another very strong one at $421.
Looking the other way, there is support at $336, another at $317, and then at $287.
When we look at the RSI indicator and the STOCH indicator, we will see the beginning of a recovery movement with room for a larger decline.

BNB: Bullish Flag BreakoutTrade setup : Price remains in an Uptrend. After consolidating in a Bullish Flag pattern, price broke out in the direction of the existing Uptrend and broke above our target of $350. Potential upside to $400 next (+14% gain). Stop Loss (SL) at $320.
Pattern : Bullish Flag pattern. Short term small rectangle trading range between diagonal parallel lines. It moves counter to the prevailing price trend observed in a longer time frame on a price chart. It forms typically following a sharp advance and often indicates a small change in direction (or areas of consolidation) before the previous trend resumes. Flag pattern is among the most reliable continuation patterns that traders use because it generates a setup for entering an existing trend that is ready to continue. Trade is initiated on a breakout, if it is in the same direction as the prevailing trend. Also, with bullish flag patterns, traders prefer a breakout with an increase in volume but it isn’t a must.
Trend : Uptrend across all time horizons (Short- Medium- and Long-Term).
Momentum is Bullish (MACD Line is above MACD Signal Line and RSI is above 55).
Support and Resistance : Nearest Support Zone is $300, then $260. The nearest Resistance Zone is $350, which it broke, then $400.

BNBUSDT.1DBased on the market data provided, BNB (Binance Coin) is currently priced at $358 against USDT (Tether).
On a 4-hour chart, BNB has an RSI (Relative Strength Index) of 79.90, which is nearing the overbought territory (RSI > 70), suggesting that it might be due for a price correction. The MACD (Moving Average Convergence Divergence) is 9.7, signaling a bullish trend. The Bollinger Bands (BB) at 366.0 also suggest a high level of price volatility. The immediate support and resistance levels are at $339.0 and $368.0 respectively.
On a daily chart, the RSI at 82.56 is in the overbought territory, suggesting a potential price correction. The MACD at 11.0 indicates a bullish trend. The BB at 368.0 suggests high price volatility. The immediate support and resistance levels are at $316.0 and $390.0 respectively.
On a weekly chart, the RSI is 75.24, still in the overbought territory. The MACD at 20.07 suggests a strong bullish trend. The BB at 368.0 suggests high price volatility. The immediate support and resistance levels are at $267.0 and $390.0 respectively.
In conclusion, the technical analysis suggests that BNB is currently in a bullish phase but nearing overbought conditions, which could trigger a price correction. However, the strong support levels could limit potential downside. As always, it's important to complement technical analysis with fundamental analysis and consider your risk tolerance before making investment decisions.

#BNB/USDT LONG#BNB
The price has been moving in a bear flag since May 2022
We have a strong support area from which the price bounced, 203.60
We're about to go up
This rise is supported by the moving average breaking 100
And break the downtrend
The price now is 232.40
First goal 327.5 0
Second goal: 387.50

BNB testing the support level, a bullish breakout could be on thAs long as BNB stays above the support level, bullishness may come. You can enter a stop order just below the support and open a position.

BNB/Binance Technical Analysis and Trade IdeaMarket Context: BNB/Binance has enjoyed a strong bullish run, but monthly timeframe signals point towards the asset being overbought. Additionally, a move into previous highs on teh 1M and 1W charts hint at a possible pullback to the 50-61.8% Fibonacci retracement area. This zone often sees increased liquidity, which could attract long positions from institutional players.
Potential Trade Strategies:
Counter-Trend Short: Consider a short entry around the current price level, placing a stop-loss above the recent highs. Aim for a 1:1 risk-reward ratio on this trade.
Fibonacci Buy: Look for a buying opportunity near the 61.8% Fibonacci retracement level, anticipating potential long positions from larger market participants. Place a stop-loss below the recent swing low and establish target levels as covered in the video.
Disclaimer: The analysis presented reflects my interpretation of market conditions and is intended for educational purposes. It does not constitute financial advice. Before executing any trades, conduct your own comprehensive research and carefully consider your risk tolerance.

BNB Feb 14 UpdateLooking for a strong close and 348 as the next target.
My ideal target stays the same $400, followed by a multi-month correction back to low 300s

BNB/USDT 1D Chart ReviewI invite you to review the chart of BNB in pair with USDT. Here, however, we will start by defining, using a white line, a downward trend line, at which we can see how the price is struggling to maintain the upward trend. Then, using the blue lines, it is worth marking a strong side trend channel, in which we also fight at the upper border. Moreover, this is where you can mark cup and handle formations, the completion of which most often results in an increase in price.
Moving forward, you should check the resistance points for the price. And here you can see a strong resistance zone from $354 to $401, which effectively influences the price rebound downwards, only when the price breaks out of it will it be able to try to increase to the resistance at $461.
Looking the other way, we see that the price is wavering with support at $317, but here it is worth expanding to the support zone from $317 to $287, then there is support at $266, and then strong support near the bottom of the channel.
When we look at the RSI indicator, we will see that there is still room for a price increase, while on the STOCH indicator, we remain above the upper limit, which, however, may result in another attempt at recovery or a temporary sideways trend.

$CGAC Bitcoin Mining Company with 722 Miners Increasing to 1,500Bitcoin is on the move once again and cracked past $50,000 today a pivotal mental barricade that hasn't been broken in several years since the bear market started and ended and the bull market began. Bitcoin Stocks that mine usually do the best during the crypto bull cycle and the best and lowest of them all at the moment is OTC:CGAC
Currently the company is in the process of increasing their miners from 722 to 1,500 in the short term and will also be doing a CUSIP and Name Change in the coming weeks to accommodate its business direction.
There is sufficient gains to be made here as it did do .05 last time around, and this time, with sufficient interest in the Crypto market we could very well see .10+
I am very bullish on this one.

Binance Coin can correct to support area and then start move upHello traders, I want share with you my opinion about Binance Coin. By observing the chart, we can see that the price a not long time ago rebounded from the resistance line of the triangle, and in a short time declined to the support line, thereby breaking the 300 support level, which coincided with the buyer zone. But then, the price bounced from the support line and soon rose back to the resistance level, breaking the 300 level one more time, after which BNB later exited from the triangle and tired to rise more, but failed and made correction to the support level. After correction, BNB made a strong upward impulse to 316 current support level, which coincided with the support area and in a short time later broke this level too. As well, the price started to trades in a range, where it rose to the top part and some time traded near, but not a long time ago BNB rebounded and declined to the 316 level, where the price continues to trades near to this day. In my mind, Binance Coin can fall to the support area, where it will turn around and start to move up in range. Therefore I set my target at 323 points. Please share this idea with your friends and click Boost 🚀
