BNB THE $1000 ATH on wayBNB did a new ATH and can complete it over $1000 in the coming time, which makes BNB a strong coin movement.
BNB

BNBUSD Is it about to have the run of its life??Binance Coin (BNBUSD) made yet another All Time High (ATH) this week, extending the strong rally it's been having since June 23 2025. That was when it hit its 1W MA50 (blue trend-line) and rebounded as it confirmed it s a Support.
That was the very same action that BNB took during the accumulation phase (blue Channel Up) of its previous Cycle on August 31 2020. As you can see, even the 1W RSI sequences between the two fractals match and what happened then was a massive parabolic rally (green) 3 months later that peaked a little above the 2.618 Fibonacci extension level.
With BNB coming off the current accumulation phase rather aggressively, do you think the market can repeat such rally to the 2.618 Fib ext, which would place us a little over $5000? Conservative targets still have BNB's peak zone within $1600 - 2000.
-------------------------------------------------------------------------------
** Please LIKE 👍, FOLLOW ✅, SHARE 🙌 and COMMENT ✍ if you enjoy this idea! Also share your ideas and charts in the comments section below! This is best way to keep it relevant, support us, keep the content here free and allow the idea to reach as many people as possible. **
-------------------------------------------------------------------------------
💸💸💸💸💸💸
👇 👇 👇 👇 👇 👇

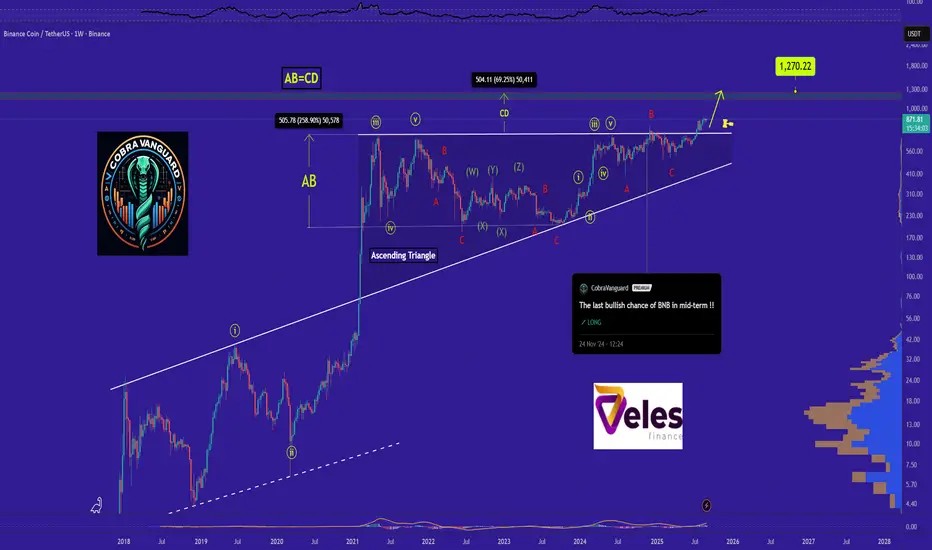
BNB is bullish now and many Traders don't see it !!As I said, BNB broke the triangle, it reached to $1000 , and you still think I'm joking!!
The price is currently supported well, which can increase the price.
Stay Awesome , CobraVanguard
previuos analysis
Technical analysis for BNB/USDT1. Overall Trend (Price Action & Market Structure)
• Long-term trend: Strong bullish trend — since March 2025, price broke out of a long consolidation zone (~550–680 USDT) and is now hitting new highs.
• Mid-term trend: After breaking out from the accumulation range, price is forming a sequence of Higher Highs (HH) and Higher Lows (HL).
• Key supports: ~786 USDT (breakout zone + 0.786 Fib), 720 USDT (previous local top).
• Key resistances: Current resistance zone ~860–880 USDT. Next target: ~975–980 USDT (1.618 Fib).
⸻
2. Fibonacci Analysis
From the drawn retracement:
• Price has broken above 0.786 and is now trading beyond the 1.0 Fib.
• Fibonacci extensions:
• 1.272: ~920 USDT
• 1.618: ~975–980 USDT → likely target if momentum stays intact.
• Current price action suggests the market could aim for 1.618 within the coming weeks if no major correction occurs.
⸻
3. Volume
• Breakout from consolidation was supported by increasing volume — confirming strong buying interest.
• Recent bullish candles have moderate volume — not yet euphoric, but demand is clearly exceeding supply.
• If near 880–900 USDT we see large-volume candles with long upper wicks, this could signal distribution.
⸻
4. RSI (Momentum)
• Daily RSI is around ~72 → market is entering overbought territory.
• Two possible scenarios:
• Continuation: RSI can remain overbought during strong trends (overbought can stay overbought).
• Correction: RSI dropping below 70 with bearish divergence forming against price.
⸻
5. Chart Patterns
• Breakout from a wide rectangle range (550–680 USDT).
• Current move resembles a mark-up phase with a possible mini-flag on H4.
• No clear signs of Wyckoff-style distribution yet.
⸻
6. EMAs / SMAs
(Not visible on your chart, but based on typical setups in such a trend):
• EMA20 and EMA50 on D1 are strongly spread apart — confirming bullish momentum.
• Price is far above EMA200 → long-term trend remains healthy.
⸻
7. Scenarios
Bullish:
• Holding above 820–830 USDT → attack on 920 USDT, then 975–980 USDT (1.618 Fib).
• RSI may stay >70 for several days, historically giving BNB an extra few % of gains.
Bearish:
• Drop below 820 USDT → retest of 786 USDT support.
• Break of 786 → deeper correction towards 720 USDT (breakout retest).
⸻
8. Summary
• Trend: Strong bullish trend, momentum still favors buyers.
• Key levels:
• Support: 786 → 720 USDT
• Resistance: 880 → 920 → 975–980 USDT
• Risks: Possible pullback at RSI >70, especially if volume spikes and large upper wicks appear.

BNB: BREAKING OUT AND TESTING WEEKLY RESISTANCEBinance Coin BNB/USDT is exhibiting 2 interesting patterns at the moment on weekly timeframe
1. A Breakout and re-test of the weekly resistance (since ATH in May 21 to ATH in Jun 24).
2. Although not a perfect cup and handle pattern, yet if considered one, it shows a thrilling target @ $1000 (which is achievable in upcoming bull run)
Best of Luck!!

BNB WEEKLYHello friends🙌
🔊We are here with BNB analysis:
A long-term analysis that can be viewed as an investment, but in the long term, with patience and capital management...
You can see that after weeks of price suffering, a good upward move has now been formed by buyers, which has also caused a new ceiling to be set. Considering the market decline and the decline of most currencies, you can see that BNB is well supported and its price has suffered.
⚠Now, with the arrival of buyers, you can enter a long-term buy trade with capital management.
🔥Follow us for more signals🔥
*Trade safely with us*

Short Btc on 15 min?
rallying from pullback, price halted at resistance zone at 1 hour Time frame
looking at 1 hour chart is good place for risk to enter short on btc.
Expecting to down 2.25% drawn
Above chart represent to 1 hour

IDOLUSDT - Break or Breakdown? IDOL at Decision Zone!Currently, MEET48/USDT is sitting at a critical decision zone after a parabolic rally from 0.012 → 0.0428. The euphoric surge was followed by a healthy correction and distribution phase, forming lower highs capped by a descending trendline (yellow) while price consolidates within the 0.030 – 0.033 box zone (yellow box).
This area now acts as the ultimate battlefield between buyers and sellers. The next decisive move will determine whether we get a bullish continuation breakout or a bearish breakdown into deeper correction.
---
Visible Patterns
1. Descending Trendline (seller pressure)
Price has repeatedly failed to close above this yellow line → showing sellers are defending strongly.
2. Consolidation Box (accumulation zone)
The 0.030–0.033 zone is the current tug-of-war area. As long as price holds above it, buyers still have a chance.
3. Two Technical Interpretations:
Descending Triangle (bearish bias): if price continues to press against support.
Falling Wedge (bullish bias): if price breaks to the upside, often signaling trend continuation after a pullback.
---
Bullish Scenario
Trigger: 4H candle close above 0.033 with strong volume confirmation.
Targets:
TP1 → 0.0361 (first resistance)
TP2 → 0.0405
TP3 → 0.0428 (local high/ATH)
Narrative: A breakout signals buyers regaining control and resuming the prior rally after consolidation.
---
Bearish Scenario
Trigger: 4H candle close below 0.030 with high selling pressure.
Targets:
First support zone → 0.024 – 0.025
Extended target → 0.0115 (historical low shown on chart)
Narrative: A breakdown confirms sellers dominating the zone, opening room for a deeper correction.
---
Key Takeaway
0.030 – 0.033 = Decision Zone
Breakout above → continuation higher.
Breakdown below → deeper correction.
Watch volume and 4H candle close for confirmation.
---
Notes for Traders
Avoid FOMO, wait for confirmation before entering.
Use scaling strategies (partial entries/exits).
Always manage risk with stop loss outside the box zone.
MEET48 is a low-cap altcoin → expect potential false moves due to low liquidity.
---
#MEET48 #MEET48USDT #CryptoAnalysis #Altcoin #TechnicalAnalysis #Breakout #DescendingTriangle #FallingWedge #SupportResistance

BNB/USDT Short-Term🔎 Current situation:
• Price: ~ 896.9 USDT.
• Trend: You can see an upward trend short -term, but now the price consolidates just below the resistance.
• Support:
• 892.8 (SMA - short -term).
• 885.5 (key horizontal support).
• resistance:
• 899.5 (local resistance, SMA #1).
• 907.9 (strong resistance - previous peak).
⸻
📊 Indicators:
• SMA: The price balances between the short (892.8) and the long average (green ~ 896). This gives a picture of the "balance point".
• MacD: The lines are close to each other, the histogram decreases → neutral signal, possible transition towards sales, if the signal line goes up above MacD.
• RSI: ~ 50–55 → neutral zone, nor purchase nor sales.
⸻
📈 short -term scenarios (1-6h):
1. Bull (more likely if it stays above 892.8):
• Breaking 899.5 → Attack on 907.9.
• If the volume increases, up to 912+ may occur.
2. Bear (if it goes below 892.8):
• decrease towards 885.5 (key level of support).
• Punction 885.5 → Movement down to 878–880.

BNB - NEW ATH !!!! 🚨 BREAKING: #BNB HITS NEW ALL-TIME HIGH! 💥
REAL FOMO IS KICKING IN!
Is $1,000 the next stop? 🚀
Levels to watch:
$875 - $900
$950 - $960
1000$

“What I will do today in BNB”Possible entry in BNB around 881.64 with stop at 895.17 and take at 855.14, 1:2 ratio.
Why Altcoins Are Weak in This Bull Run?The crypto market is in a bull run, but something feels different this time. While Bitcoin and Ethereum are setting new highs, many altcoins are struggling to keep up. In previous cycles, altcoins often outperformed once Bitcoin found stability — but this round looks weaker. Here are a few reasons why altcoins are underperforming:
✅ Bitcoin Dominance Is Rising
Capital flows in crypto follow a cycle. Early bull phases usually start with Bitcoin, as institutions and large investors prefer its liquidity and reputation as a "safer" crypto asset. Bitcoin dominance has been climbing, signaling that capital is consolidating into BTC instead of spreading into smaller, riskier altcoins.
✅ Liquidity Is Thinner Across the Market
Unlike previous cycles, global liquidity conditions are tighter. With interest rates higher and risk appetite lower, speculative capital isn’t flooding into altcoins at the same pace. Most investors would rather deploy into BTC or ETH than gamble on small-cap tokens with uncertain narratives.
✅ Regulation & Exchange Listings Matter More
This cycle is also shaped by increased regulatory scrutiny. Many altcoins face delisting risks or uncertainty around whether they qualify as securities. This discourages both retail and institutional investors from rotating heavily into alts.
✅ Narratives Are Narrower
In past cycles, new sectors (DeFi in 2020, Metaverse in 2021) created explosive altcoin rallies. This time, the strongest narratives are Bitcoin ETFs and Ethereum staking. Without a fresh, sector-wide altcoin narrative, capital rotation is limited to a few selective themes like AI coins or Real-World Assets (RWA), rather than lifting the entire alt market.
✅ Market Maturity & Survivorship Bias
The crypto market has matured. Many speculative altcoins from past cycles have faded or collapsed. Survivors now trade more in line with fundamentals and adoption, meaning the era of every token pumping in unison is over.
Conclusion
Altcoins are weaker in this bull run because the cycle is more institutional, more selective, and more Bitcoin-focused. That doesn’t mean altcoins won’t have their moment, but traders should be more careful this time. Instead of chasing every low-cap token, focus on strong narratives, liquidity, and projects with real adoption.
Altseason may come, but it won’t look like the ones of the past.
Cheers
Hexa
BINANCE:BTCUSDT BINANCE:ETHUSDT CRYPTOCAP:BTC CRYPTOCAP:ETH CRYPTOCAP:XRP CRYPTOCAP:BNB
BNB is bullish now and many Traders don't see it !!As I said, BNB broke the triangle, it could surge to $1000 , and you still think I'm joking!!
The price is currently supported well, which can increase the price.
Stay Awesome , CobraVanguard
Previous analysis
BNB/USDT 4H chart1. Trend
• There is a clear yellow inheritance trend on the chart - the price has been moving under it for a long time.
• Currently, the course is testing this line - that is, we are at which it is possible to either break up the mountain or another reflection down.
⸻
2. Key levels
• Resistance resistance:
• 856 USDT (SMA - green line, short -term resistance).
• 865 USDT (last local peak, additional psychological resistance).
• Support (Support):
• 849 USDT (red SMA #1).
• 843 USDT (horizontal support).
• 835 USDT (stronger support, marked in red).
⸻
3. Indicators
• SMA - the price is between short -term (red) and medium -term (green) average walking. This is a consolidation signal.
• MacD - the blue line pierces the orange from the bottom, the histogram begins to shine green → a sign of potential growth.
• RSI - around 45–50 → neutral, shows neither a sale nor buying out. It indicates the possibility of both directions.
⸻
4. Possible scenarios
• bullish (upward):
• If the price stands out above 856–865 USDT and persists, a possible level of 880 USDT levels.
• Confirmation will be further strengthening MacD and RSI going towards 60+.
• Bear (inheritance):
• If the course is rejected from the trend line, the decline may go down to 843 USDT first, and in case of puncture - up to 835 USDT.
• RSI Congress below 40 and MacD reversing down will confirm their weakness.
⸻
✅ Summary:
BNB is now in the decision zone - it tests the downward trend line and key resistance at 856–865 USDT. MacD suggests that bulls are trying to take the initiative, but RSI is still neutral. If the mountain is broken, the movement can be dynamic. If rejection - descent to 835 USDT very real.

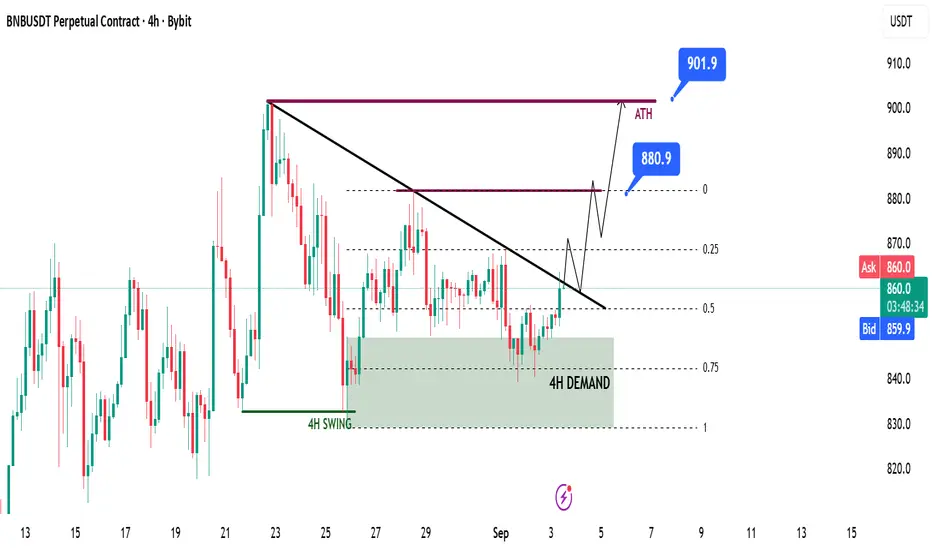
BNB Targeting All-Time Highs BNB Targeting All-Time Highs
📊 Market Sentiment
Sentiment remains constructive, supported by the prospect of a 0.25% rate cut in the upcoming FOMC meeting. With the USD losing strength and global risk appetite improving, conditions continue to favor upside momentum in crypto markets.
📈 Technical Analysis
BNB shows strong bullish momentum, so I’m only focused on long setups.
Price swept 4H swing liquidity and closed strongly above, signaling a deviation of the liquidity pool and intent to push higher.
A 4H demand zone was created after the liquidity raid, and price has already retested it while aligning with the 0.75 max discount zone both giving a strong bounce.
Currently, price is moving towards the LTF bearish trendline.
📌 Game Plan
I want to see a clean breakout above the bearish trendline. At least two consecutive 4H candle closes above the trendline will confirm the breakout for me.
🎯 Setup Trigger
I will enter after a confirmed retest of the broken trendline.
📋 Trade Management
Stoploss: Two consecutive 4H closes below the broken trendline
Targets:
• TP1: $880
• TP2: $901 (All-Time Highs)
💬 Like, follow, and comment if you find this setup valuable!
⚠️ Disclaimer: This content is for informational and educational purposes only and does not constitute financial, investment, or trading advice. Always do your own research before making any financial decisions.
BNB weeklyBNB is in an uptrend on the weekly timeframe and has broken above the key $700 resistance.
However, a bearish divergence on the MACD signals a potential correction.
Key support: $700 – Next resistance: $1,100.
Overall trend remains bullish, but a pullback may occur before further upside.

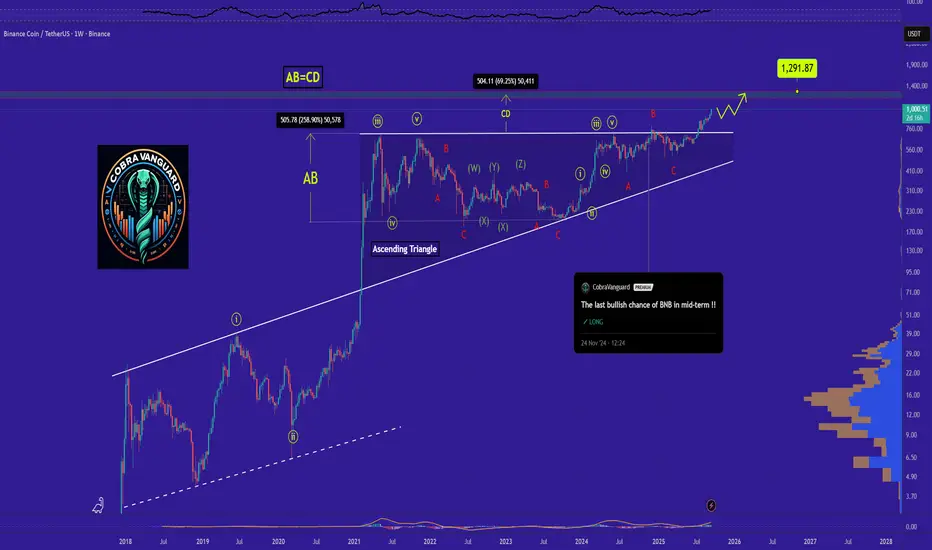
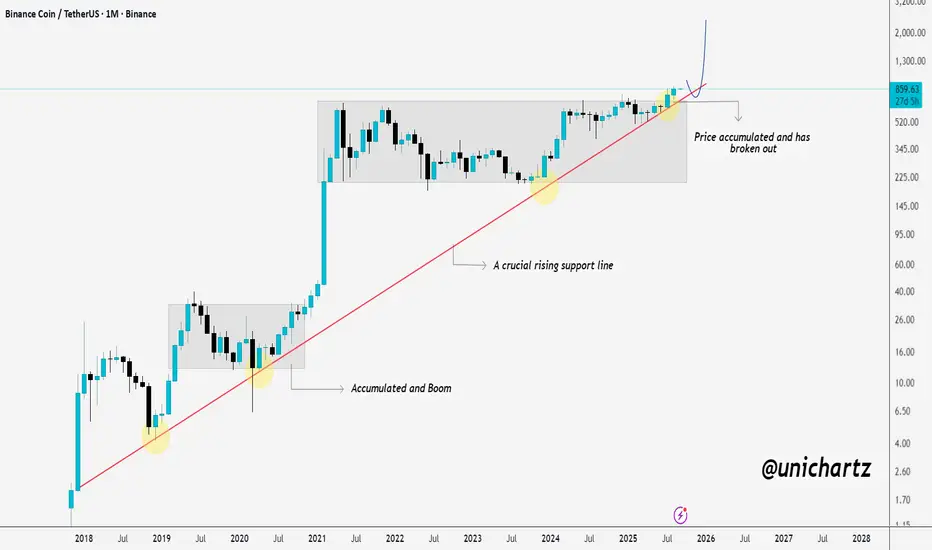
$BNB could move 80% from here - the key levels to watch BNB/USDT Monthly Analysis
CRYPTOCAP:BNB has been respecting a strong rising support line since 2018, showing consistent strength over the long term.
Each time BNB consolidated near this trendline, it accumulated and then rallied hard, marking key breakout points in previous cycles.
Right now, price has accumulated again and broken out, signaling a potential continuation to the upside. If momentum sustains, the next targets could push toward $1,200–$1,500 and beyond in the coming months.
The rising trendline remains a crucial support, holding above it keeps the macro bullish structure intact.
DYOR, NFA
Thanks for checking this out.
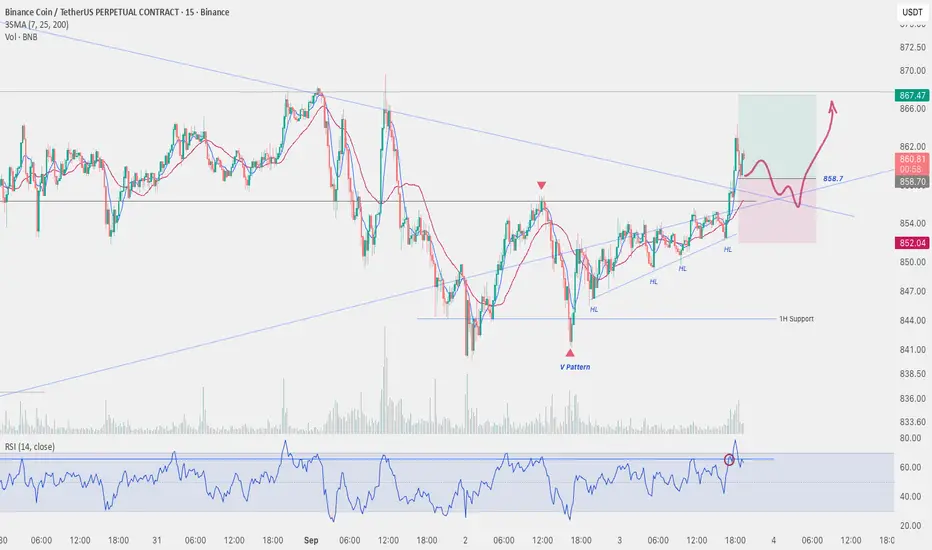
Sep 3, 2025 - BNBUSDT Long Position ReviewFor my last position today, I opened a long trade on BNB . After the price touched and reacted to the daily ascending trendline, I set my entry trigger above the first 1H resistance at 856 . Similar to other coins, the V-pattern that formed before the breakout gave me additional confidence in the bullish move.
Once the strong 1H candle closed above resistance, I placed a buy stop order above its wick at 858.7 for extra confirmation, which eventually triggered my entry.
I must admit, this trade was a bit emotional — it would have been better to wait for a confirmed medium wave cycle bullish structure before entering. On top of that, the BNB/BTC chart doesn’t look very bullish, which suggests I might have found a better setup on other coins. The main reason I rushed was the opportunity to use relatively high leverage on this setup.
📌 Stop-Loss Strategy
The main strength of this trade is the well-positioned stop-loss. Even if price decides to retest the broken descending trendline with a pullback, my stop would not be triggered prematurely.
⚠️ Overall, this is a risky position that is currently open. If I notice weakening bullish signals, I’ll likely exit early.
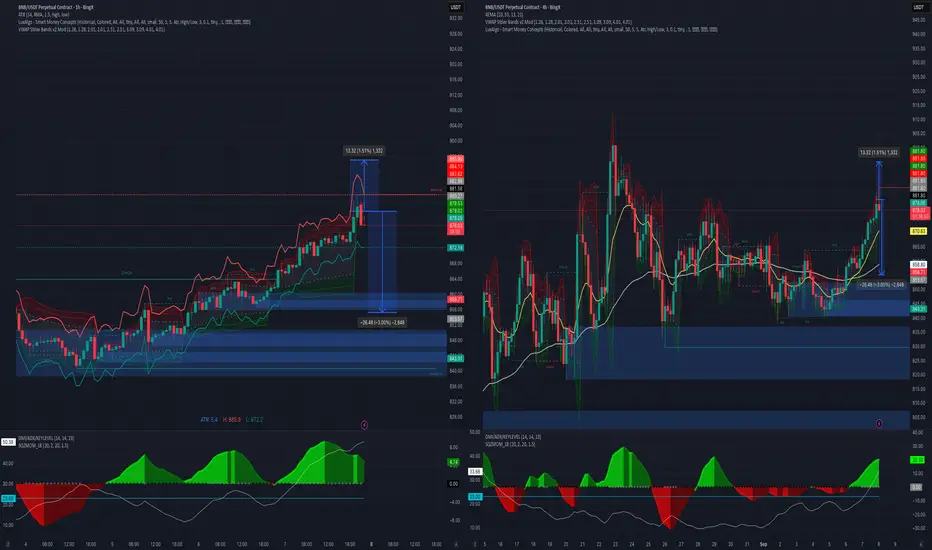
BNBUSDT Highwave-Cycle on 4H Timeframe:
BNB/BTC Chart:
SIGN/USDT – Critical Accumulation Zone Before the Next Big Move!📊 Detailed Analysis of SIGN/USDT
Currently, SIGN/USDT is moving within a prolonged consolidation phase, with the key demand zone at 0.06700 – 0.07000 USDT (highlighted in yellow). This zone has acted as a strong base since mid-June, repeatedly rejecting downside pressure, and can be considered a major accumulation area.
---
🔎 Market Structure & Pattern
1. Sideways Accumulation
The price is forming a sideways base within the range of 0.067 – 0.078 USDT. Such structures often precede a significant move, either a breakout to the upside or a breakdown lower.
2. Strong Support Zone
Primary Support: 0.06700 – 0.07000 USDT
Next Supports: 0.06300 – 0.05950 USDT, if breakdown occurs.
3. Layered Resistance (Supply Zones)
R1: 0.07382 – 0.07814 USDT
R2: 0.08532 – 0.08938 USDT
R3: 0.09576 – 0.10137 USDT
This structure signals that the price is currently at a decision point, awaiting confirmation of the next big move.
---
✅ Bullish Scenario
As long as price holds above 0.06700, this zone can serve as a strong rebound point.
A breakout above 0.07382 – 0.07814 will open the way toward 0.08532 – 0.08938.
Further bullish momentum above 0.09576 may push the price to 0.10137 USDT, which is the major resistance zone.
If sustained, this could evolve into an Ascending Accumulation Pattern, strengthening the bullish outlook.
---
❌ Bearish Scenario
If the price breaks below 0.06700, a drop toward 0.06300 – 0.05950 becomes highly likely.
A confirmed daily close below this support would shift the structure into a downtrend continuation, possibly extending losses toward 0.05650.
This scenario would reinforce bearish momentum and invalidate the current accumulation zone.
---
🎯 Key Takeaway
0.06700 – 0.07000 USDT is the make-or-break zone.
Holding above it keeps the bullish rebound potential alive, while a breakdown will accelerate the bearish trend.
For traders, this level can act as a strategic entry point with strict risk management, as the market is preparing for its next decisive move.
#SIGNUSDT #CryptoAnalysis #PriceAction #SupportResistance #CryptoTrading #Altcoins #ChartAnalysis #BullishScenario #BearishScenario

BNB to $1700BNB moves faster now, with a resistance line at 61% of the Fibonacci channel, around $1700, potentially the peak.

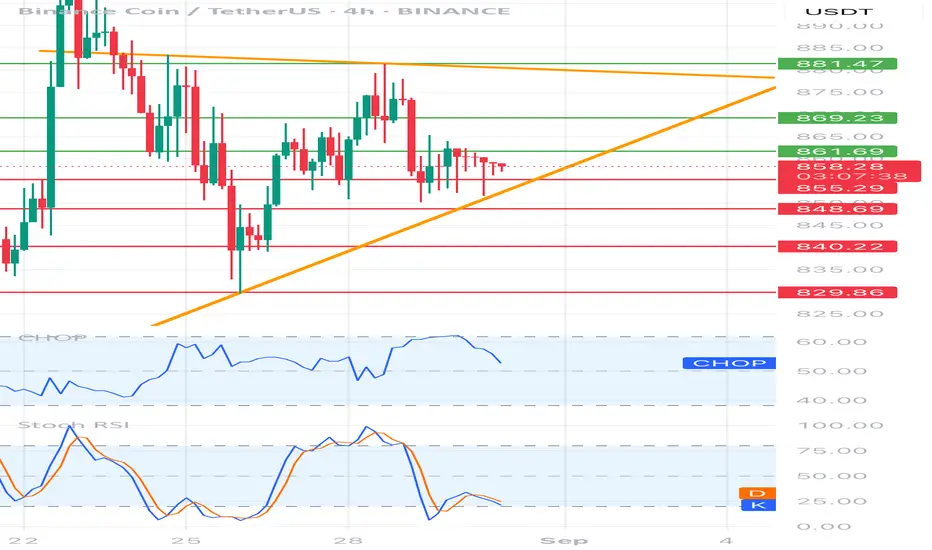
BNBUSDT 4H Chart 1. Price structure
• Current price: ~ 858 USDT
• The price moves in the clinic in a lowering (yellow lines). Upper inheritance trend (~ 881) + lower growth line (~ 848).
• We see consolidation - the market is "squeezed" between supports and resistance.
2. Horizers of support and resistance
• Support:
• 855 (local, this is where the price stopped)
• 848 (Important - lower wedge + demand level)
• 840 and 829 (key with a larger decline).
• resistance:
• 861 (first test, short -term)
• 869 (stronger resistance, earlier reflections)
• 881 (upper wedge line, strategic resistance).
3. Oscillators
• RSI (Chop) - around 50, i.e. neutral → no clear advantage of bulls/bears.
• STOCHASTIC RSI - is located at the bottom of the zone (approx. 20-25), which suggests the possibility of reflecting up (bull signal, but only after the candle confirmation).
4. Scenarios
Bullish (reflection up):
• If the price persists over 855–848 → possible reflection to 861 and 869.
• Breaking above 869 → opens the road to 881 (Test of the upper line of Klina).
• Only closure of the 4h candle above 881 → a signal of a kick from the wedge and a stronger upward movement.
Bearish (continuation of the inheritance):
• If the price drops below 848 and closes the candle at this level → strong inheritance signal, tarpapers: 840 and 829.
• 829 is key support - its bursting down can deepen the declines.
⸻
📊 Summary
BNB is now in the Departing Clinic, in the uncertainty zone:
• Maintenance 848–855 = chance of reflection.
• Punction down 848 = signal to a stronger decrease.
• Only breaking above 881 = signal of stronger growth movement.
BNB is showing DiverganceBNB is showing a divergance between the bullish price and the bearish stochastic oscillator.
in addition the volume is falling.
I wish best of luck to you
MarketsTitan

BNB Retracement Ahead?CRYPTOCAP:BNB wave 5 looks complete at the weekly R1 pivot. RSI continues to print weekly bearish divergence from the wave 3 high.
Wave IV was a difficult count but appears to be a triangle which is a final pattern before the terminal move. Wave 2 retracement target usually ends at the bottom of wave 4 so $90 in this case which also finds confluence with 0.382 Fibonacci retracement and a swing below the weekly pivot, a good long signal.
Analysis is invalidated if we continue into price discovery.
Safe trading
