KOMAUSDT — Trendline Breakout: Structural Reversal or Bull TrapOverview
KOMA/USDT has finally delivered a significant technical signal after months of consolidation within a tight accumulation range.
The latest daily candle successfully broke above a major descending trendline and a key horizontal resistance, signaling the early phase of a potential trend reversal from long-term bearish pressure to renewed bullish momentum.
This breakout could represent a psychological shift in market sentiment — from distribution to accumulation — and may define the next major leg of price expansion if confirmed by volume and structure.
---
Market Structure Insight
Primary Trend: Bearish since early 2025, marked by consistent lower highs and lower lows.
Structural Shift: A clear daily breakout above the descending trendline suggests the start of a higher-high structure formation.
Key Zone (Accumulation Range): The 0.020–0.027 area has acted as a multi-month resistance zone, now potentially flipping into new structural support (S-R Flip).
Momentum Confirmation: A strong breakout candle accompanied by volume expansion hints at growing institutional interest.
---
Technical Pattern Breakdown
The pattern combines two powerful structural elements:
Descending Trendline Breakout → indicates exhaustion of long-term selling pressure.
Range Accumulation Base → acts as the energy build-up phase before a new impulsive move.
If the price performs a successful retest of the breakout zone, this pattern transitions into a trend reversal base, which historically precedes sustained bullish continuation phases.
---
Bullish Scenario (Primary Bias)
1. Validation Conditions:
Daily close above 0.027 with sustained trading above the breakout zone.
Rising volume and RSI holding above the 50 line.
2. Continuation Setup:
A clean retest followed by a higher low formation would confirm structural reversal.
3. Upside Targets:
TP1: 0.0489 — First expansion resistance.
TP2: 0.0633 — Mid-term structural level.
TP3: 0.0935 — Major resistance zone.
Extended targets: 0.128 – 0.169 if momentum persists.
4. Stop-Loss Placement:
Below 0.020 or under the most recent swing low.
5. Risk/Reward Outlook:
Strong R:R potential (>3R) from the breakout base with multi-tier scaling opportunities.
---
Bearish Scenario (Alternative Bias)
1. Invalidation Trigger:
Daily close below 0.020 or a re-entry into the previous range (false breakout).
2. Market Implications:
A bull trap scenario could trigger a deeper correction toward 0.0142, the historical low support.
3. Volume Confirmation:
A drop with rising sell volume would confirm distribution rather than accumulation.
4. Bias Reversal:
If this occurs, the broader bearish structure remains intact and consolidation may resume.
This type of breakout often marks the transition from accumulation to markup phase, particularly if confirmed with a successful retest and sustained buying volume.
KOMA/USDT has just broken through the upper boundary of a long-standing downtrend — a technical milestone that could set the stage for medium-term reversal momentum.
However, confirmation is key. Without a retest that holds, this move could remain a temporary liquidity sweep.
Traders should closely monitor daily closes and reaction around the 0.027 zone to confirm whether this is a true structural reversal or merely a bull trap.
#KOMA #KOMAUSDT #CryptoAnalysis #BreakoutTrading #TechnicalAnalysis #PriceAction #AltcoinWatch #CryptoMarket #TrendReversal #SupportResistance #RiskManagement
BNB

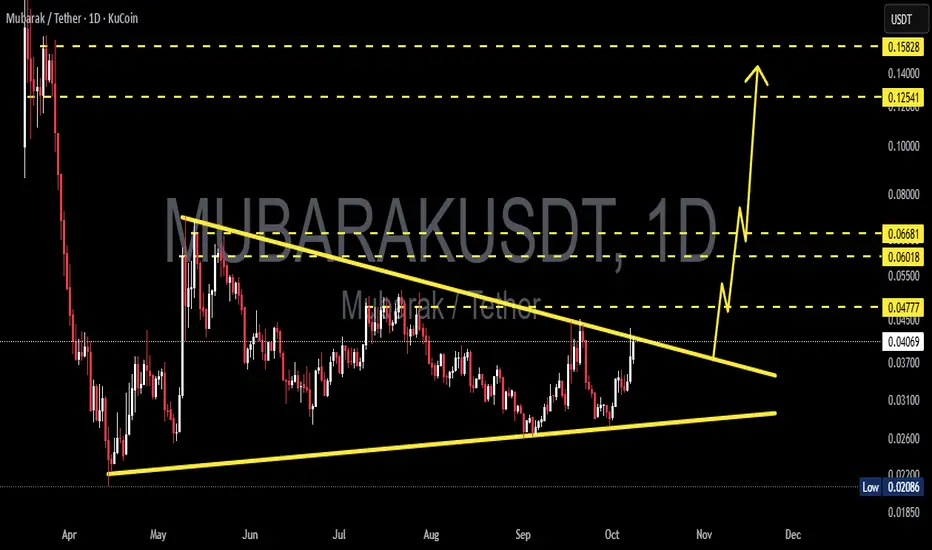
MUBARAKUSDT — On the Edge of an Explosive Move: Bullish BreakoutThe MUBARAK/USDT pair is approaching a crucial moment as price action compresses inside a Symmetrical Triangle, signaling the market’s tension before a major breakout.
Whenever price reaches the apex of a pattern like this, it often precedes a sharp expansion in volatility — a make-or-break moment for traders.
---
🔶 Pattern Overview & Technical Structure
The Symmetrical Triangle represents a battle of equilibrium between buyers and sellers:
The descending upper trendline keeps pushing lower highs.
The ascending lower trendline protects higher lows.
As both lines converge, energy builds up within the pattern — usually leading to an explosive breakout once one side wins.
Declining volume supports this setup, hinting that a big move is imminent.
---
💹 Key Technical Levels
Current Price: around 0.04050 USDT
Main Resistance: 0.04777 → 0.06018 → 0.06681
Dynamic Support: 0.03100 → 0.02600
Major Support: 0.02086 (historical low)
If a confirmed breakout occurs, the measured move projection from this triangle points toward a potential upside target near 0.086, depending on follow-through and volume confirmation.
---
🚀 Bullish Scenario (Upside Breakout)
Confirmation: A daily candle close above the descending trendline with strong volume.
Continuation: Retest of the breakout zone that turns former resistance into new support.
Upside Targets:
TP1 → 0.04777 (initial resistance)
TP2 → 0.060–0.0668 (supply zone)
TP3 → around 0.086 (measured move projection)
Momentum catalysts — such as surging volume or renewed altcoin rotation — could accelerate this breakout move.
---
⚠️ Bearish Scenario (Rejection / Breakdown)
Confirmation: Strong rejection at upper trendline with long wick and close back below resistance.
Breakdown Trigger: Daily close below the ascending trendline with increasing sell volume.
Downside Targets:
0.026–0.031 (dynamic support zone)
Below that → retest of 0.02086 (historical demand level)
Failure to hold support could spark panic selling, especially given MUBARAK’s relatively low liquidity profile.
---
📊 Momentum Checklist
Watch closely for:
Volume spikes → true breakout confirmation.
Daily close above 0.04777 → bullish validation.
Daily close below 0.03100 → bearish confirmation.
Avoid reacting to intraday wicks — focus on daily candle closes for real signals.
---
🧭 Conclusion & Technical Bias
MUBARAK is standing at a critical compression point — the calm before the storm.
A confirmed breakout could open the path toward 0.06–0.086, while rejection at the trendline risks sending price back below 0.03.
Volume and daily close confirmation will determine whether bulls or bears take control next.
---
#MUBARAK #MUBARAKUSDT #CryptoBreakout #TrianglePattern #TechnicalAnalysis #Altcoin #KuCoin #CryptoTrading #SymmetricalTriangle #ChartAnalysis
ASTERUSDT — Compression at Its Peak: A Major Breakout is Brewing1. Overview
ASTER/USDT is currently in a tight consolidation phase, forming a clear symmetrical triangle pattern on the 4-hour chart.
This pattern reflects an equilibrium between buyers and sellers, where volatility compresses and tension builds before a decisive move.
Price is hovering around $2.011, right in the middle of the narrowing range between the descending resistance and ascending support trendlines — a typical setup before a major breakout.
This is a classic indecision zone, where markets quietly prepare for their next expansion phase.
---
2. Technical Structure & Key Levels
Upper Resistance Zone:
$2.1267 (Fib 0.5) — first resistance and mid retracement point.
$2.2004 (Fib 0.618) — second resistance and key psychological level.
$2.4391 (Fib 1.0 / previous swing high) — first breakout target.
$2.8253 (Fib 1.618 extension) — extended bullish target on strong momentum.
Lower Support Zone:
$1.8145 (Fib 0.5) and $1.7405 (Fib 0.618) — demand zone highlighted in yellow; strong historical reaction area.
The ascending trendline coincides with this demand zone, making it a critical defense area for bulls.
---
3. Pattern Context — Symmetrical Triangle (Neutral Continuation)
The symmetrical triangle often acts as an accumulation or distribution zone within a larger trend.
Given that this pattern formed after a strong prior uptrend, the bias leans slightly toward bullish continuation.
However, confirmation is essential — a valid breakout requires a decisive candle close outside the triangle with notable volume.
---
4. Bullish Scenario — Breakout to the Upside
Confirmation trigger: A 4H candle closing above the upper trendline, ideally beyond the $2.13–$2.20 zone with strong volume.
This signals that buyers have successfully regained control after the compression phase.
Trade setup:
Entry: After a confirmed breakout (close above $2.13) or on a successful retest of the upper trendline.
Targets:
TP1: $2.44 — previous swing high / Fib 1.0 zone.
TP2: $2.82 — Fib 1.618 extension target.
Stop Loss: Below $1.95 or more conservatively below the demand zone at $1.8145.
Extra confirmation:
Volume must increase significantly (above 20-bar average).
RSI breaking above 60 supports bullish momentum buildup.
Narrative:
A confirmed breakout above this pattern could mark the start of the next impulsive leg in ASTER’s broader uptrend, transforming this triangle into a reaccumulation structure rather than distribution.
---
5. Bearish Scenario — Breakdown Below Support
Warning sign: A 4H candle closing below $1.74, breaking both the demand zone and ascending support line.
This indicates that buyers lost control and that supply pressure is starting to dominate.
Trade setup:
Entry: After a confirmed close below $1.74 with rising volume.
Targets:
TP1: $1.60 — minor structural support.
TP2: $1.35 — previous swing low.
TP3 (extended): $1.07 — if selling pressure accelerates.
Stop Loss: Above recent rejection highs or above the $1.90–$2.00 zone.
Narrative:
A breakdown here would invalidate the higher-low structure and suggest the beginning of a mid-term corrective wave before potential reaccumulation at lower levels.
---
6. Strategic Summary
ASTER/USDT is currently trapped in a compression zone, and volatility expansion is likely approaching.
Symmetrical triangles like this often precede sharp directional moves, as energy builds before release.
Overall bias: Neutral-to-bullish, given the preceding uptrend — but confirmation is mandatory.
While price remains within the triangle, the best approach is patience — wait for a 4H breakout candle with strong volume confirmation.
> “Patience during compression phases is what separates those who predict from those who profit.”
---
7. Risk & Management Notes
Always define a clear stop loss before entry.
Avoid over-leverage during consolidation periods.
Volume confirmation is key — low-volume breakouts often lead to traps.
This analysis is for educational and technical purposes only, not financial advice.
---
#ASTER #ASTERUSDT #Crypto #Altcoin #TechnicalAnalysis #PriceAction #Breakout #SymmetricalTriangle #CryptoSetup #MarketStructure #Fibonacci #CryptoChart

Buy $CAKE - HUGE NARRATIVE SHIFT CAME TO BNB - DONT WAITIn short Cake is close to breaking out of a 3 year range and the upside is huge.
The power driving this is a memecoin meta taking place on BNB.
Lots of inflow from solana coming in.
Four.meme is a launchpad that launches tokens on the pancakeswap liquidity pool.
The revenue its generating is 6X more then it was in the past so the token is criminally undervalued.
My buys may feel late but I think this can easily 5x from here.

Crypto = Stocks, saying this since 2021Sorry for not posting as much
Want more? A lot more? See profile for more info.
Until we see a significant shift and change to our theses since 2021 >Crypto = Stocks. People were clamoring institutions. When big boys come to the party things change. Deal with that now. It is not the same game.
Since 2021 we've been saying that Crypto was no longer the same and that it turned into a similar asset as stocks.
Since then the top 10 have done well & most coins, especially after top 25, have suffered.
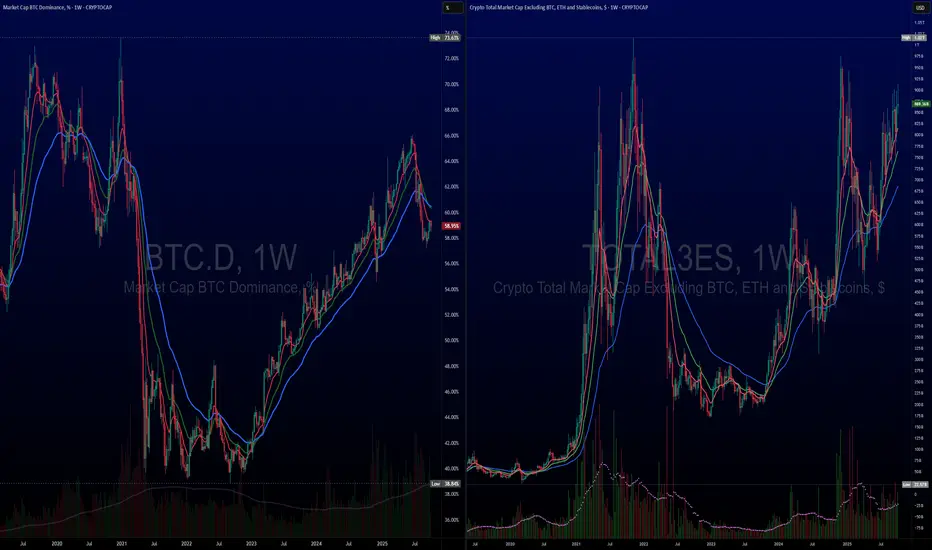
See the following charts to compare. Not in any order.
It's kind of like NASDAQ:NDX index vs CRYPTOCAP:BTC index.
Then the largest tech companies vs the largest Crypto.
NASDAQ:META NASDAQ:MSFT NASDAQ:NVDA = CRYPTOCAP:SOL CRYPTOCAP:XRP CRYPTOCAP:BNB Capish?
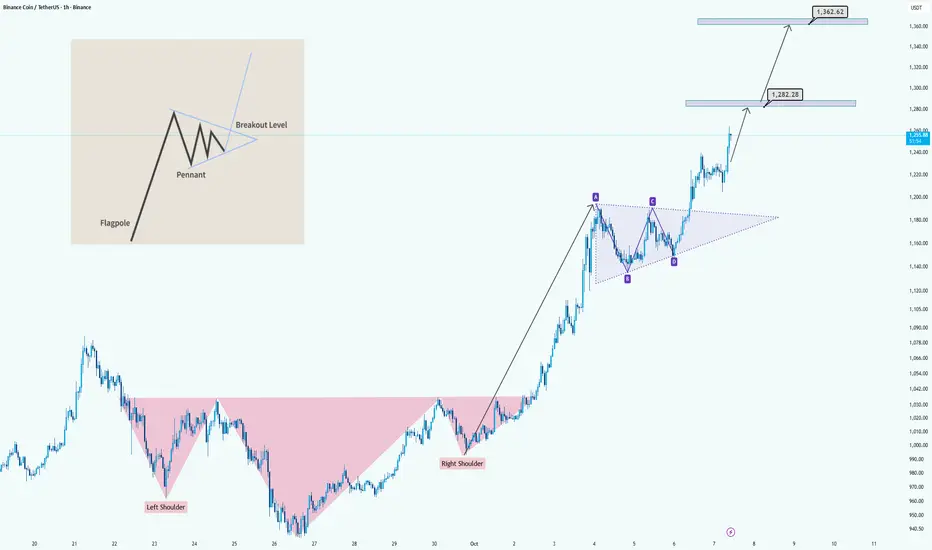
BNB/USDT: Bullish Breakout from H&S and Pennant FormationHi guys!
The chart clearly shows a bullish structure forming after a strong upward move. Initially, the price completed an Inverse Head and Shoulders pattern , signaling a potential trend reversal from bearish to bullish. After the breakout above the neckline, the market continued to climb and started consolidating into a bullish pennant pattern , a continuation setup that typically follows a sharp rally (flagpole).
The pennant breakout confirms renewed bullish momentum, suggesting the next leg higher is underway. Based on the flagpole projection, the measured targets are around $1,282 for the first resistance zone and $1,362 as the extended upside target.
In summary:
Patterns identified: Inverse Head and Shoulders + Bullish Pennant
Trend direction: Bullish continuation
Targets: $1,282 and $1,362
Outlook: Positive as long as price holds above the pennant breakout level
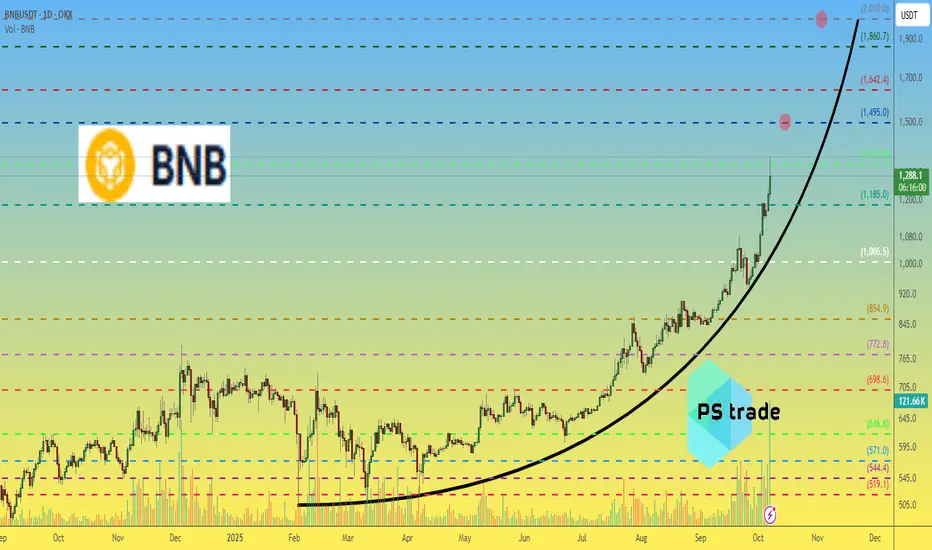
BNB price analysis🔥 CZ really knows how to launch candles to the sky — and this parabolic move feels like a true “comeback celebration”! 💥
💧 Even liquidity from CRYPTOCAP:ETH is now flowing into CRYPTOCAP:BNB — everyone’s trying to catch the wave.
Honestly, we wouldn’t be surprised if the goal is to “push” OKX:BNBUSDT to a clean $1500, that’s 2× from the previous ATH 🚀
But let’s be real — you don’t need to be a pro trader to see it:
the further price flies away from an already dangerous parabolic growth, the riskier new entries become ⚠️
😌 Ah… remember when CRYPTOCAP:BNB was $0.5 or even $5?
📊 P.S:
Chart levels are reacting quite well — a decent reference point for orientation.
🤔 What do you think — will CRYPTOCAP:BNB hit $1500 or even $2000, or is this already too much euphoria?
______________
◆ Follow us ❤️ for daily crypto insights & updates!
🚀 Don’t miss out on important market moves
🧠 DYOR | This is not financial advice, just thinking out loud
BNB Update📊 BNB Update
BNB is retracing now 🔄
If it keeps retracing to the green zone level 🟢, there’s potential to enter a long position — with confirmation ✅

It's BNB SZ Real Flow. Perps >$100B, Memes ExplodingSummary
BNB just put in a vertical move on market cap and the BNB Chain narrative has flipped risk-on. Perp flow spiked, memecoin breadth exploded, and CEX/Wallet primitives are amplifying the loop. I’m positioning for continuation with a “buy dips / rotate to BNB Chain beta” plan, with clear invalidations.
What’s happening (from the provided charts)
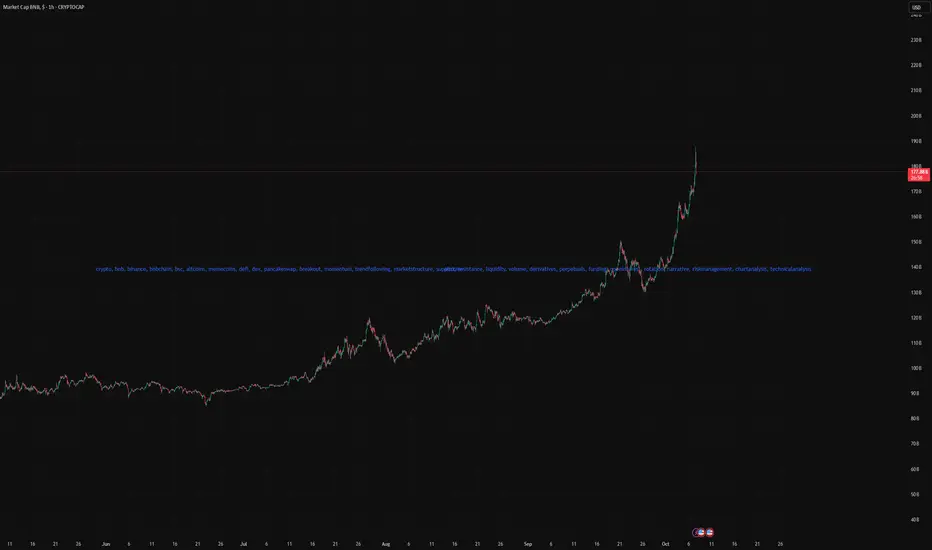
Perp flow: Daily perp volume on BSC crossed ~$100B two days ago (screenshot from @BNBCHAIN). Liquidity + leverage are back, and that historically fuels multi-day trend moves.
Market cap structure: BNB market cap chart (1h) shows a clean breakout to ~$180B after a month of stair-step advances. Vertical extension suggests momentum, but also raises the odds of sharp pullbacks.
Breadth / heat: Multiple watchlists show BNB memecoins ripping (Palu, “4”, BINA, GIGGLE, etc.). You’ve got 100–200M MC runners across the board and “OKX Wallet Trending” screenshots with BNB-pairs at the top.
Distribution layer: Trust Wallet is actively pushing SOL→BNB swaps (giveaway post), which validates and accelerates the rotation flow.
Narrative lock-in: Multiple posts repeat “BNB Szn” with compounding social proof (CMC Boosts, DEXScreener Boosts/Ads on $SZN, “BNB > XRP/USDT market-cap rank #3” callouts). This is the reflexive feedback loop you want during the early innings of a chain season.
Thesis
BNB is entering a chain-season regime: high perp activity → higher spot liquidity → memecoin breadth → more attention → more perp activity. Until perp volumes cool and breadth narrows, continuation is the base case.
Levels & structure (using the market-cap chart)
Breakout area: ~$170–172B mcap (prior ceiling). First buy-the-dip zone if momentum cools.
Trend support: rising 1h/4h structure sits roughly mid-170s B. Lose this with heavy perp unwind = momentum broken.
Upside magnet: $200B psychological round number. Extension targets beyond that depend on breadth staying hot.
Rotations
Core beta: BNB spot/perp on dips to prior highs.
Chain beta: BNB memecoins with liquidity + CEX/Wallet visibility. Names in your screenshots (Palu, “4”, BINA, GIGGLE) are already in motion; stick to rule-based entries (liquidity > $1–3M, no stealth revokes, active socials).
Tools signal: “Trending” tabs (OKX Wallet, Dexscreener Boosts, CMC boosts) are acting like momentum filters this week—lean into them while the season is hot.
Catalysts to monitor
More DEXScreener/CMC boosts for BNB-pairs.
CEX wallet trending panels featuring BNB tokens.
Trust Wallet / Binance ecosystem promos (SOL→BNB incentives).
Bottom line
As long as perp flow stays elevated and breadth remains wide, trend-following + dip-buying BNB and rotating into liquid BNB-chain beta is the optimal stance. Lose trend support + perp dries up → exit to strength and wait for the next setup.
solana x binance coin Solana follow it Binance Coin on its journey to $1k
CRYPTOCAP:SOL vs. CRYPTOCAP:BNB

ASTERUSDT - Extreme bullish ahead!BNB tokens are on fire right now 🔥.
If you ask me for a personal pick, I’d say #ASTER.
It’s currently forming a triangle pattern, and honestly, if it breaks it, you might miss the entry — so better buy now.
Short-term target: at least $3.5.
Best regards:
Ceciliones🎯

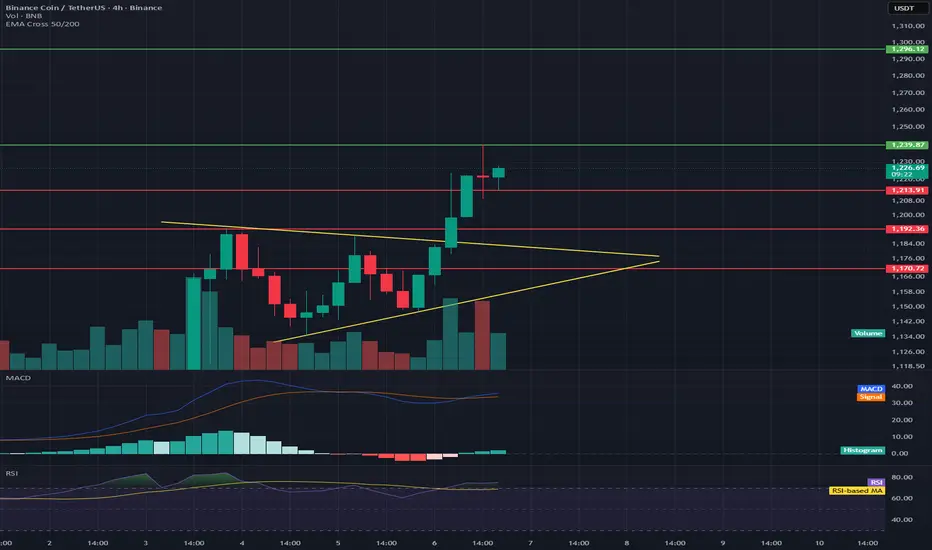
BNB/USDT 4H Chart Review📊 Market Structure
The chart shows a symmetrical triangle (yellow lines) from which a breakout occurred upwards—a classic signal of a continuing uptrend.
The price has broken above resistance at ~$1,210, which now acts as local support.
Current price: ~$1,226, following a dynamic breakout from the triangle.
📈 Key Levels
Support:
$1,210 — Retest after the breakout (important defensive level for bulls)
$1,193 — Previous local support in the triangle
$1,170 — Stronger support and lower boundary of the previous consolidation
Resistance:
$1,239 — Local resistance that has already been tested
$1,260–$1,265 — Next target upon breakout (equal movement or measuring the height of the triangle)
$1,300 — Psychological and technical resistance level
📊 Volume
The breakout was confirmed by a significant increase in volume, lending it credibility.
No sharp drop in volume after the breakout — the market remains in demand.
⚙️ MACD
The MACD is above the signal line and rising, confirming a bullish impulse.
The histogram is positive, but not excessively broad → momentum is healthy, but not overheated.
💪 RSI
RSI: ~75, which is slightly in the overbought zone.
It's worth watching for a short-term correction or retest of the $1,210 level before the uptrend becomes more established.
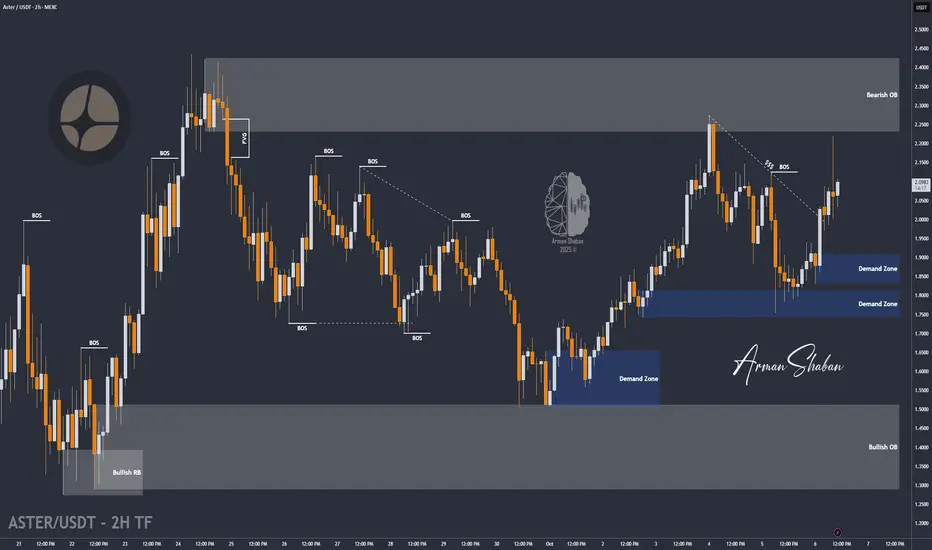
ASTER/USDT | +7000% Since Listing, What’s Next?By analyzing the Aster (ASTR) chart on the 2-hour timeframe, we can see that the price is currently trading around $2.08. Since its listing, this crypto has surged over 7000%, but later experienced a heavy drop. Now it’s consolidating within a key range — making it a high-risk, high-reward setup for early investors.
The first major support zone is between $1.83–$1.91, while the medium-term upside targets are $2.22, $2.38, and $2.50.
Please support me with your likes and comments to motivate me to share more analysis with you and share your opinion about the possible trend of this chart with me !
Best Regards , Arman Shaban
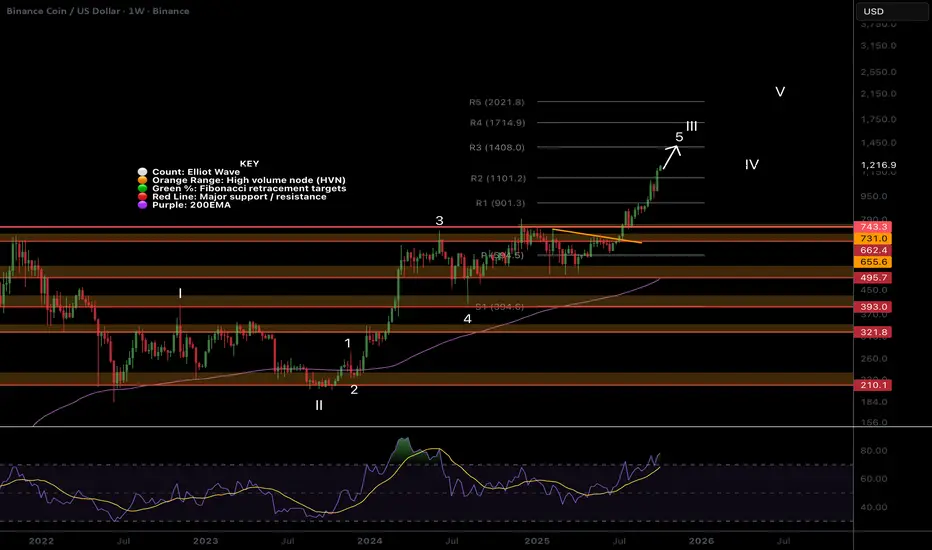
BNB/USDT | BNB Smashes $1200 Target – Momentum Remains Strong!By analyzing the BNB (Binance Coin) chart on the weekly timeframe, we can see that the price continued its bullish rally exactly as expected, breaking multiple new all-time highs (ATHs) and hitting the $1200 target.
It’s now trading around $1220, and the previous analysis remains valid. The next upside targets are $1400 and $1550, while the main support and demand zone lies between $980–$1050.
This setup has delivered over 30% profit so far — hope you made the most of it!
Please support me with your likes and comments to motivate me to share more analysis with you and share your opinion about the possible trend of this chart with me !
Best Regards , Arman Shaban

BNB cant be stopped!BNB is on a bullish journey of its own continuing into price discovery in what can only be described as wave 3 behaviour so I have upgraded my count to wave 5 of 3!
R5 pivot targets are $2021
Weekly bearish divergence persist!
Safe trading
BNB - Room to Move Up I think on this monthly timeframe price still has room to move up throughout the rest of 2025.
The structure in white is a rising wedge and allows for the next bear market.
Bullish medium term
ASTER/USDT — Retest the Fibonacci Zone: Rebound or Breakdown?ASTER is standing at a critical equilibrium zone, retesting a strong demand area between 1.75–1.83, which also aligns with the Fibonacci 0.5–0.618 retracement zone.
This area acts as the last line of defense for buyers to preserve the medium-term bullish structure.
---
📊 Structure & Pattern
After failing to break above the 2.43 resistance, ASTER corrected sharply and is now retesting its previous demand base.
This setup forms a Bullish Retest Pattern, where price seeks a new footing before the next potential leg up.
However, a confirmed break below this zone could shift the market structure into a bearish breakdown, signaling a possible trend reversal.
---
🟩 Bullish Scenario (Potential Rebound)
Buyers must defend the 1.75–1.83 area.
Bullish confirmation occurs when a 4H candle closes above 1.82 with increasing volume.
Upside targets:
→ 1.9469 (minor resistance)
→ 2.1319 (psychological resistance)
→ 2.3077 – 2.4331 (major distribution zone)
As long as demand holds, ASTER could form a new higher low and resume its bullish trajectory.
---
🟥 Bearish Scenario (Potential Breakdown)
A 4H close below 1.7485 (Fib 0.618) would signal that buyers are losing control.
Such a breakdown could trigger a deeper sell-off toward 1.50, possibly extending to 1.20 (major structural support).
A strong rejection at 1.95–2.13 without volume follow-through would also reinforce the bearish outlook.
---
📌 Technical Summary
ASTER is currently at a make-or-break zone where bulls and bears are battling for control.
Holding the 1.75–1.83 demand area keeps the door open for a +30% rebound toward the 2.43 region.
But a clean breakdown below 1.75 could invalidate the bullish setup and lead to a deeper correction toward 1.20.
The next few 4H candles will determine the dominant trend for the week.
---
🎯 Key Levels
Main Support: 1.8217 – 1.7485
Major Structural Support: 1.2000
Resistance Levels: 1.9469 / 2.1319 / 2.3077 / 2.4331
---
“ASTER is approaching a decision point — holding above 1.75–1.83 could trigger a sharp rebound to 2.43, but losing this zone might drag it down to 1.20.
A critical 4H battle between bulls and bears is underway.”
---
#ASTERUSDT #CryptoTrading #AltcoinAnalysis #TechnicalAnalysis #FibonacciRetracement #DemandZone

BNB is definitely on its way to $1000.BNB has been consolidating for around 250 days , which is a solid amount of time to build momentum for a breakout. It's almost certain that BNB will hit $1000 soon .
However, this prediction becomes invalid if the price breaks down below $500 with significant volume.
A good price range for accumulation is between $500–$650.
CRYPTO:BNBUSD

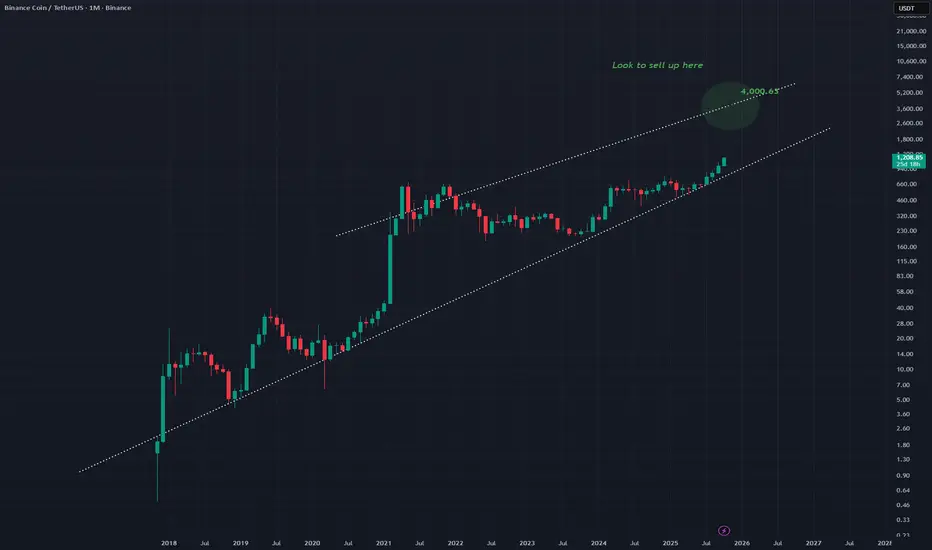
BNB Soars Above Key SupportLooking at this $BNB/USDT chart, here's a more concise breakdown:
Rising Support: The red line shows a strong support level that has held up since 2018, with the price bouncing off it several times, confirming its importance.
Accumulation Zone: Between 2020 and 2021, BNB traded sideways, building up buying pressure before the next move.
Breakout: After the accumulation phase, BNB broke out sharply, signaling the start of a strong upward trend.
Current Trend: The price is now above the rising support line, and the bullish momentum seems to be continuing, suggesting further potential upside.
In short , BNB is in a solid uptrend, with a key support line holding strong. The breakout indicates more gains ahead if the trend continues.

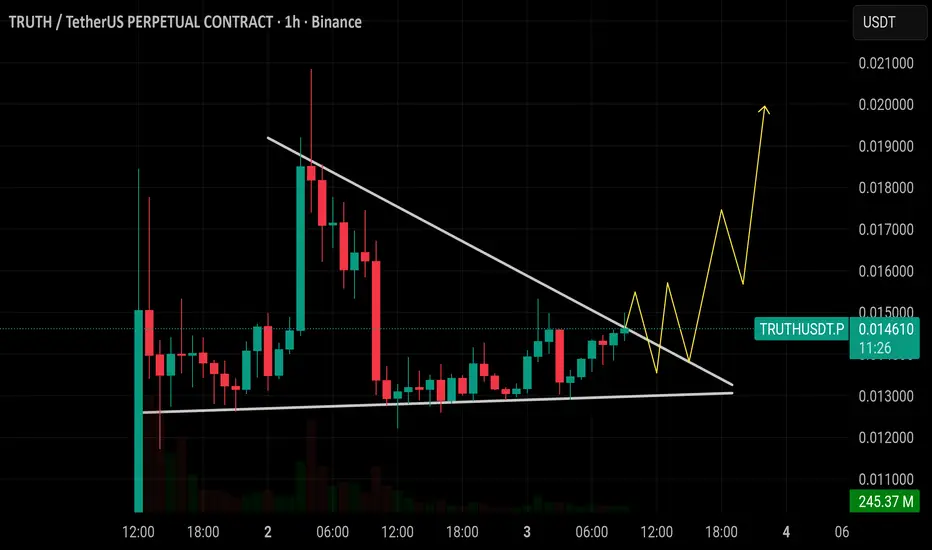
$TRUTH is breaking out from a falling wedge pattern around 0.014$TRUTH is breaking out from a falling wedge pattern around 0.0147. If momentum holds, price can push toward 0.0160 first and then extend toward 0.0200. Losing 0.0130 support would invalidate this bullish setup.
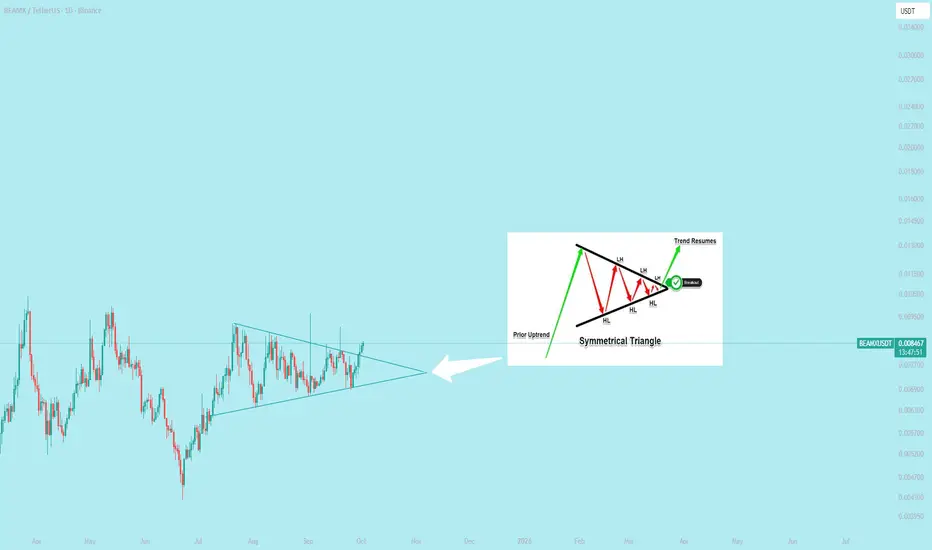
$BEAMX Breakout bullish symmetrical pattern in Daily time frame
**Execute the trade**
Once the breakout is confirmed, there are two primary entry strategies:
**Aggressive entry**: Enter a long position immediately after a candle closes above the upper trendline.
**Conservative entry:** Wait for a retest of the broken trendline, which now acts as a support level. Enter a long position when the price bounces off this line. This approach offers a tighter stop-loss but may cause you to miss the trade if the price does not retest the trendline.
@everyone
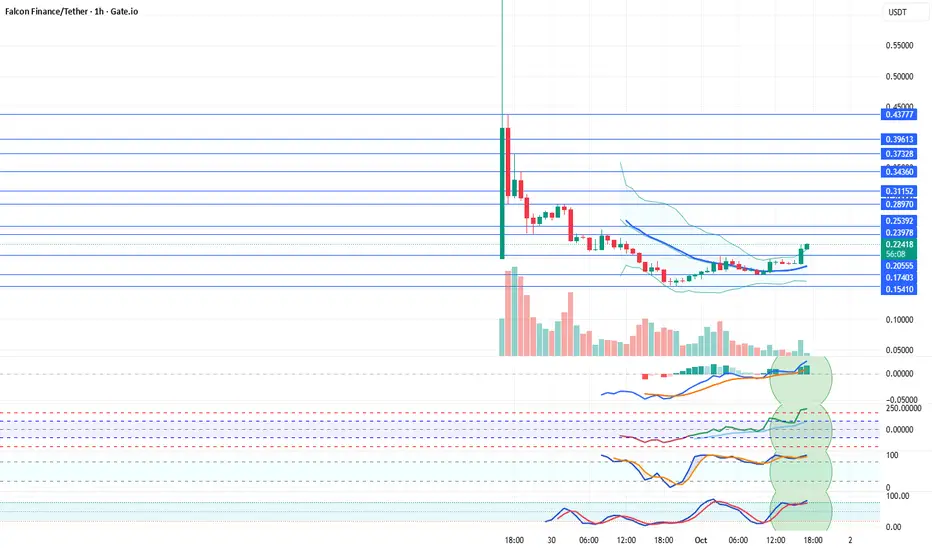
FFUSDT 1 Hour Technical AnalysisFFUSDT 1 Hour Technical Analysis
Falcon Finance Coin has risen above its 21-day moving average. After the sharp decline following its listing, it now appears to be recovering. Having broken above the 0.20555 resistance, we believe Falcon Finance Coin may continue its upward movement if indicators remain positive. Resistance levels will be monitored closely.
Resistances: 0.2397 – 0.2539 – 0.2897 – 0.3115 – 0.3436 – 0.3732 – 0.3961 – 0.4377
Supports: 0.2055 – 0.1740 – 0.1541
We’d appreciate it if you 🚀 rocket our posts. Also, don’t forget to share them on your social media accounts.
Legal Disclaimer:
The information, comments, and recommendations provided here do not constitute investment advisory services. Investment advisory services are offered within the framework of an investment advisory agreement to be signed between the client and brokerage firms, portfolio management companies, or non-deposit banks. The content shared on this page reflects only personal opinions. These views may not be suitable for your financial situation, risk profile, or return preferences. Therefore, no investment decisions should be made based on the information provided here.
BNB/USDT 4h chart review1. Trend and structure
• The price struck the relegation (orange) line, which is a positive signal.
• Currently, the course oscillates around 1007 USDT after reflection from holes ~ 930.
2. Key levels
• Support: 995, 971, 930.
• Resistance: 1026, 1051, 1084.
3. MacD
• The histogram grows, but begins to slightly weaken.
• MacD line still above the signal → slightly bullish signal, but with braking signs.
4. RSI (4H)
• RSI around 55–60 → neutral/bullish, not yet burdened.
5. Simple interpretation
• As long as the course lasts above 995, the upward scenario is possible.
• Breaking above 1026 will open the road to 1051 and 1084.
• decrease below 995 → Risk of retests 971, and later 930.
