US10Y This break-out can be the next Buy Signal.The U.S. Government Bonds 10YR Yield (US10Y) has been trading within a long-term Triangle pattern and more recently since May 22 2025 it has found itself declining inside a Channel Down.
This Bearish Leg (Channel Down) almost hit the bottom of the Triangle and has been rebounding in the past 10 days. As long as the 1W MA200 (orange trend-line) holds (right now almost at the bottom of the Triangle), the probabilities of a rebound and new Bullish Leg remain strong.
The confirmation for such Bullish Leg will come after the price closes a 1D candle above the 1D MA50 (blue trend-line). If it does, we an expect the price to rise to at least the 0.786 Fibonacci retracement level (Target 4.475%), which has happened all times (3) inside this Triangle after a Bearish Leg bottomed.
-------------------------------------------------------------------------------
** Please LIKE 👍, FOLLOW ✅, SHARE 🙌 and COMMENT ✍ if you enjoy this idea! Also share your ideas and charts in the comments section below! This is best way to keep it relevant, support us, keep the content here free and allow the idea to reach as many people as possible. **
-------------------------------------------------------------------------------
💸💸💸💸💸💸
👇 👇 👇 👇 👇 👇
Bondsignals

Bond Market Overview in Global TradingIntroduction
The global bond market is one of the largest and most influential components of the financial system, often considered the backbone of global capital markets. Bonds—also known as fixed-income securities—represent loans made by investors to borrowers, typically governments, municipalities, or corporations. In return, the borrower agrees to make periodic interest payments (coupons) and repay the principal at maturity.
With a total value exceeding $130 trillion globally, the bond market surpasses the global equity market in size. It serves as a vital mechanism for governments to finance deficits, corporations to raise capital, and investors to achieve stable income streams. In global trading, bonds play a key role in portfolio diversification, interest rate management, and economic stability.
1. The Structure of the Global Bond Market
The bond market can be broadly divided into sovereign bonds, corporate bonds, and municipal or supranational bonds. These segments cater to different types of issuers and investors:
1.1 Sovereign Bonds
Sovereign bonds are issued by national governments to fund public spending, infrastructure projects, and fiscal deficits. Examples include U.S. Treasuries, UK Gilts, German Bunds, and Japanese Government Bonds (JGBs).
They are considered the safest instruments in their respective countries, especially when denominated in a nation’s own currency. The U.S. Treasury market is the largest and most liquid, serving as a global benchmark for interest rates and risk-free returns.
1.2 Corporate Bonds
Corporations issue bonds to finance operations, mergers, or expansion without diluting ownership through equity issuance. Corporate bonds typically carry higher yields than government bonds due to increased credit risk. They are classified as:
Investment Grade Bonds: Issued by companies with strong credit ratings (e.g., Apple, Microsoft, Nestlé).
High-Yield or Junk Bonds: Issued by companies with lower credit ratings, offering higher returns to compensate for default risk.
1.3 Municipal and Supranational Bonds
Municipal bonds (or “munis”) are issued by states or local governments, primarily in the U.S., to finance public infrastructure like schools, hospitals, or transportation systems.
Supranational organizations—such as the World Bank, IMF, or Asian Development Bank—also issue bonds to support global development initiatives. These bonds are typically low-risk due to strong institutional backing.
2. How the Bond Market Works
2.1 Primary Market
The primary market involves the initial issuance of bonds. Governments issue bonds via auctions, while corporations issue through underwriters in public or private placements. The primary market provides direct funding to issuers.
2.2 Secondary Market
Once issued, bonds trade in the secondary market, where investors buy and sell existing bonds. Prices fluctuate due to changes in interest rates, inflation, credit ratings, and market sentiment.
Major secondary markets include the U.S. Treasury market, the London bond market, and electronic platforms like Tradeweb and MarketAxess. Liquidity in these markets ensures that investors can easily adjust portfolios and manage risks.
3. Key Features and Metrics
Understanding the global bond market requires familiarity with core concepts:
3.1 Coupon Rate
The coupon rate is the fixed or floating interest rate paid by the bond issuer to the bondholder. For instance, a 5% coupon bond with a $1,000 face value pays $50 annually.
3.2 Yield
Bond yield reflects the effective return an investor earns. It varies inversely with bond prices—when interest rates rise, bond prices fall, and yields increase. Common types include:
Current Yield
Yield to Maturity (YTM)
Yield Spread (difference between yields of two bonds)
3.3 Duration and Convexity
Duration measures a bond’s sensitivity to interest rate changes. Longer-duration bonds experience greater price volatility. Convexity refines this measure, accounting for nonlinear changes in prices relative to yields.
3.4 Credit Rating
Credit rating agencies—such as Moody’s, S&P Global, and Fitch—assess the creditworthiness of issuers. Ratings range from AAA (highest quality) to D (default), guiding investors on risk levels.
4. Participants in the Global Bond Market
The bond market brings together a diverse set of participants:
Governments: Issuing debt to fund national spending or manage monetary policy.
Corporations: Raising long-term capital for expansion.
Institutional Investors: Pension funds, insurance companies, and sovereign wealth funds seeking stable returns.
Central Banks: Managing monetary policy by buying or selling bonds (quantitative easing or tightening).
Retail Investors: Accessing bonds through ETFs or mutual funds.
In global trading, institutional investors dominate due to the market’s scale and complexity, though retail participation has grown with digital bond platforms.
5. Global Bond Market Instruments
The diversity of instruments reflects varying risk appetites and investment horizons:
5.1 Fixed-Rate Bonds
These bonds pay a constant coupon over their lifetime. They offer predictability, making them popular among conservative investors.
5.2 Floating-Rate Notes (FRNs)
Coupon payments adjust based on a benchmark rate (e.g., LIBOR, SOFR). FRNs protect investors from rising interest rates.
5.3 Zero-Coupon Bonds
Issued at a discount, these bonds pay no periodic interest but return the face value at maturity. They appeal to long-term investors seeking capital appreciation.
5.4 Inflation-Linked Bonds
Examples include U.S. TIPS and UK Index-Linked Gilts, which adjust coupon and principal payments for inflation, preserving real returns.
5.5 Convertible Bonds
Hybrid securities allowing investors to convert bonds into equity under certain conditions. These offer growth potential alongside fixed-income stability.
5.6 Green and Sustainable Bonds
These fund environmentally friendly or socially responsible projects. The green bond market has surged past $2 trillion, reflecting global ESG investment trends.
6. Importance of Bonds in Global Trading
Bonds serve several crucial functions in international finance:
6.1 Capital Formation
They enable governments and corporations to raise large amounts of capital efficiently.
6.2 Benchmark for Interest Rates
Sovereign bonds—especially U.S. Treasuries—serve as global benchmarks for interest rates, influencing mortgage rates, corporate debt costs, and derivatives pricing.
6.3 Portfolio Diversification
Bonds typically have low correlation with equities, reducing overall portfolio volatility.
6.4 Safe Haven Investment
During economic uncertainty, investors flock to high-grade government bonds, particularly U.S. Treasuries, as a refuge from market turbulence.
6.5 Monetary Policy Tool
Central banks use bond markets to influence liquidity and interest rates. For example, through open market operations or quantitative easing (QE).
7. Factors Influencing Bond Prices and Yields
Bond performance depends on macroeconomic and market dynamics:
7.1 Interest Rates
The most critical factor—bond prices move inversely to interest rates. When central banks raise rates to combat inflation, existing bond prices fall.
7.2 Inflation
Higher inflation erodes the purchasing power of fixed returns, reducing bond attractiveness unless yields rise accordingly.
7.3 Credit Risk
Downgrades in an issuer’s credit rating or default concerns can cause sharp price declines, especially in corporate or emerging market bonds.
7.4 Currency Movements
Global investors face exchange rate risk when investing in foreign bonds. A weaker local currency can erode returns.
7.5 Economic and Political Stability
Geopolitical tensions, wars, or policy uncertainty often drive investors toward stable, developed-market bonds.
8. Major Global Bond Markets
8.1 United States
The U.S. bond market, led by Treasury securities, is the most liquid and widely traded globally. Corporate bond trading is also highly active, supported by transparent regulations and deep investor demand.
8.2 Europe
The Eurozone bond market includes government bonds from Germany, France, and Italy, as well as Eurobonds—international bonds denominated in euros but issued outside the Eurozone.
8.3 Asia-Pacific
Japan, China, and India have growing bond markets. Japan’s low-yield JGBs influence global interest rate dynamics, while China’s bond market—now the world’s second largest—has opened to foreign investors via programs like Bond Connect.
8.4 Emerging Markets
Countries like Brazil, Mexico, Indonesia, and South Africa issue sovereign and corporate bonds that offer higher yields but carry elevated currency and credit risks.
9. Technological and Regulatory Developments
9.1 Digital Bond Trading
Technological platforms have transformed bond trading from traditional over-the-counter (OTC) methods to electronic trading networks. Platforms such as Bloomberg, MarketAxess, and Tradeweb enhance transparency, liquidity, and efficiency.
9.2 Blockchain and Tokenization
Blockchain technology allows tokenized bonds—digital representations of bond ownership on secure ledgers. These innovations promise faster settlement, lower costs, and greater accessibility.
9.3 ESG and Sustainable Finance Regulations
Regulatory bodies in the EU and other regions are promoting green disclosure frameworks, ensuring transparency in ESG-linked bonds.
9.4 Monetary and Fiscal Coordination
Global bond markets increasingly reflect coordinated central bank actions, as seen during COVID-19 stimulus efforts and post-pandemic tightening cycles.
10. Challenges and Risks
Despite its stability, the bond market faces key challenges:
Rising Interest Rates: As central banks tighten monetary policy, bond prices decline, causing capital losses.
Sovereign Debt Crises: Excessive government borrowing (e.g., Greece 2010, Argentina 2018) can trigger market shocks.
Liquidity Risk: In less developed or high-yield markets, bonds may be hard to sell quickly.
Currency Volatility: Cross-border investors face exchange rate fluctuations that impact returns.
Climate Risk: Environmental disasters and transition risks can affect bond valuations, especially for sectors with high carbon exposure.
11. The Future of the Global Bond Market
The future trajectory of the global bond market will be shaped by technological innovation, sustainable finance, and monetary policy evolution.
Digital Bonds and tokenized securities are expected to revolutionize issuance and settlement.
Green and social bonds will continue expanding, aligning finance with climate goals.
Artificial intelligence and data analytics will enhance credit risk assessment and trading strategies.
Interest rate cycles post-2025 will redefine global yield curves as inflation stabilizes.
Furthermore, greater participation from retail investors and emerging economies will democratize bond investing, creating a more balanced and inclusive market.
Conclusion
The global bond market is an intricate, dynamic, and essential part of the international financial system. It serves as a source of funding for governments and corporations, a tool for investors to earn stable income, and a mechanism for central banks to execute monetary policy.
In an era of technological transformation and shifting geopolitical landscapes, the bond market’s role remains indispensable in balancing risk, facilitating investment, and promoting economic growth worldwide. As sustainability, innovation, and global integration advance, bonds will continue to anchor financial stability and serve as a foundation for responsible global trading.
Investing in Bonds in the Global MarketIntroduction
In the ever-evolving landscape of global finance, bonds remain one of the most stable and reliable investment instruments. While equity markets often capture headlines with their volatility and potential for massive returns, the bond market — valued at over $130 trillion globally — forms the bedrock of the world’s financial system. Bonds provide essential capital for governments and corporations while offering investors predictable income streams and portfolio diversification.
Investing in bonds in the global market involves understanding the different types of bonds available, their risk-return characteristics, how interest rate movements influence them, and the factors shaping the global fixed-income environment. This essay explores the nature of global bond investing, its benefits, challenges, strategies, and the evolving dynamics in an interconnected global economy.
1. Understanding Bonds and Their Global Role
A bond is a debt security issued by a borrower — typically a government, municipality, or corporation — to raise funds from investors. In exchange, the issuer agrees to pay periodic interest (known as the coupon) and return the principal on maturity. In essence, bond investors are lenders rather than owners, unlike equity investors who hold a stake in a company.
The global bond market is divided broadly into:
Sovereign Bonds – Issued by national governments (e.g., U.S. Treasuries, German Bunds, Japanese Government Bonds).
Corporate Bonds – Issued by private or public corporations to finance operations or expansions.
Municipal Bonds – Issued by states, cities, or other local governments (mostly in the U.S.).
Supranational Bonds – Issued by international institutions like the World Bank or the European Investment Bank.
Global investors allocate funds to these instruments across various geographies to diversify risk and capture stable returns.
2. The Structure and Dynamics of the Global Bond Market
The global bond market is larger than the global stock market and plays a critical role in facilitating liquidity and funding across economies. It operates through both primary markets (where new bonds are issued) and secondary markets (where investors trade existing bonds).
The U.S. dominates the bond market, followed by the Eurozone, Japan, and China. Emerging markets have also become increasingly active players, issuing bonds denominated in both local and foreign currencies to attract international investors.
Key indicators in the bond market include:
Yield to Maturity (YTM): The total return expected if the bond is held to maturity.
Credit Rating: An assessment of the issuer’s creditworthiness, provided by agencies like Moody’s, S&P, and Fitch.
Duration and Convexity: Measures that indicate the bond’s sensitivity to interest rate changes.
These metrics help investors assess potential risks and rewards in a global portfolio.
3. Benefits of Investing in Global Bonds
a. Diversification
Investing in global bonds provides geographic diversification. Since interest rates, inflation, and economic cycles vary across countries, exposure to multiple bond markets reduces the portfolio’s overall volatility.
b. Stability and Predictable Income
Unlike equities, bonds provide fixed coupon payments, offering a predictable income stream. This stability attracts conservative investors, such as pension funds and retirees.
c. Risk Management
Bonds, especially government and high-grade corporate bonds, often act as a hedge during equity market downturns. When stock markets fall, investors typically move toward safer assets, driving bond prices higher.
d. Access to Foreign Currencies
Investing in foreign bonds can provide exposure to different currencies, offering potential gains from favorable exchange rate movements.
e. Inflation Protection
Certain bonds, such as inflation-indexed securities (like U.S. TIPS or U.K. Index-linked Gilts), adjust their principal and interest payments based on inflation, preserving real returns.
4. Risks in Global Bond Investing
While bonds are often viewed as safer than equities, they are not risk-free. Investing globally introduces additional layers of complexity.
a. Interest Rate Risk
Bond prices and interest rates move inversely. When global central banks raise rates, existing bonds with lower yields lose value. Hence, global investors must monitor monetary policies across major economies.
b. Credit Risk
There is a risk that the bond issuer may default on payments. Emerging-market bonds and corporate bonds typically carry higher credit risk compared to sovereign bonds of developed nations.
c. Currency Risk
Investing in bonds denominated in foreign currencies exposes investors to exchange rate fluctuations. For instance, if the U.S. dollar strengthens, returns from euro-denominated bonds may diminish for dollar-based investors.
d. Liquidity Risk
Certain bonds, especially those from smaller issuers or emerging markets, may have limited trading activity, making it difficult to sell them quickly without a price concession.
e. Geopolitical and Economic Risk
Global events such as wars, trade tensions, sanctions, and political instability can disrupt bond markets, particularly in developing regions.
5. Types of Global Bonds
a. Government Bonds
Issued by sovereign states, these bonds are considered the safest investments. Examples include:
U.S. Treasury Bonds – Global benchmark for risk-free rates.
German Bunds – The eurozone’s standard for stability.
Japanese Government Bonds (JGBs) – Used by investors seeking ultra-low yields but high safety.
b. Corporate Bonds
Issued by companies to raise capital. They offer higher yields than government bonds but with added credit risk. Global giants like Apple, Toyota, or Shell issue bonds accessible to global investors.
c. Emerging Market Bonds
Issued by developing economies (e.g., Brazil, India, South Africa). These bonds offer higher yields due to elevated risk but can be rewarding in periods of global growth.
d. Eurobonds
Issued in a currency different from the issuer’s home currency. For example, a Japanese company might issue dollar-denominated bonds in Europe. These instruments enhance global liquidity.
e. Green and Sustainable Bonds
An emerging category where proceeds are used for environmental or social projects. These have gained significant traction as investors prioritize ESG (Environmental, Social, and Governance) criteria.
6. Factors Influencing Global Bond Markets
a. Central Bank Policies
Interest rate decisions by central banks such as the U.S. Federal Reserve, European Central Bank, and Bank of Japan significantly impact bond yields globally. Quantitative easing and tightening cycles influence global liquidity and investor sentiment.
b. Inflation Trends
Rising inflation erodes real returns on fixed-income investments, leading investors to demand higher yields. Conversely, low inflation boosts bond prices.
c. Fiscal Deficits and Public Debt
Countries with large fiscal deficits may need to issue more bonds, influencing supply and yield levels. Investors also consider debt sustainability when investing globally.
d. Global Capital Flows
Institutional investors and sovereign wealth funds allocate massive capital across borders, affecting demand and yield spreads among regions.
e. Geopolitical and Economic Stability
Stable economies attract more bond investors. Events like Brexit, wars, or trade conflicts can trigger capital flight or yield volatility.
7. Strategies for Global Bond Investing
a. Active vs. Passive Investing
Active managers analyze global economic trends, interest rate expectations, and credit cycles to select bonds that may outperform. Passive investors, on the other hand, prefer bond index funds or ETFs that track global benchmarks such as the Bloomberg Global Aggregate Bond Index.
b. Currency Hedging
To mitigate currency risk, investors often use hedging tools like forward contracts or currency-hedged ETFs. This helps stabilize returns in home-currency terms.
c. Duration Management
Investors adjust portfolio duration based on interest rate outlooks. When rates are expected to rise, shorter-duration bonds are preferred to minimize price losses.
d. Credit Spread Analysis
Monitoring credit spreads — the yield difference between corporate and government bonds — helps investors gauge market sentiment and risk appetite.
e. Diversification Across Regions
Allocating investments across developed and emerging markets balances risk and return potential. For instance, combining U.S. Treasuries with Indian or Brazilian bonds can enhance yield without extreme exposure.
8. Role of Technology and Innovation
Technological innovation has transformed global bond investing. Electronic trading platforms have improved liquidity and transparency, while data analytics and artificial intelligence help investors identify opportunities faster.
Moreover, tokenized bonds — digital versions of traditional bonds traded on blockchain platforms — are emerging, promising greater accessibility and efficiency in global debt markets.
9. The Future of Global Bond Investing
The future of global bond markets will be shaped by several key trends:
Sustainability Focus: Growing demand for green and ESG-compliant bonds.
Digitalization: Blockchain-based issuance and trading to reduce costs.
Emerging Market Growth: As developing nations expand, their bond markets will attract more global investors.
Interest Rate Normalization: Following years of low or negative rates, the post-2020 era may witness gradual normalization, impacting bond valuations.
Geopolitical Realignment: Shifts in global power structures and currency preferences (e.g., de-dollarization trends) will influence international bond flows.
10. Conclusion
Investing in bonds in the global market offers investors a unique blend of safety, income stability, and diversification. While equities may deliver higher returns, bonds provide the essential balance in a diversified portfolio, helping manage risk and protect capital during volatile times.
However, success in global bond investing requires understanding complex factors — interest rate movements, currency dynamics, credit risks, and geopolitical developments. With proper strategy, diversification, and risk management, investors can harness the immense opportunities in the global bond market while safeguarding their wealth.
In an interconnected world, bonds remain not just a tool for income generation but a cornerstone of global financial stability. As economies evolve, technologies advance, and sustainability takes center stage, global bond investing will continue to adapt — offering investors both security and growth in an uncertain yet opportunity-rich financial landscape.

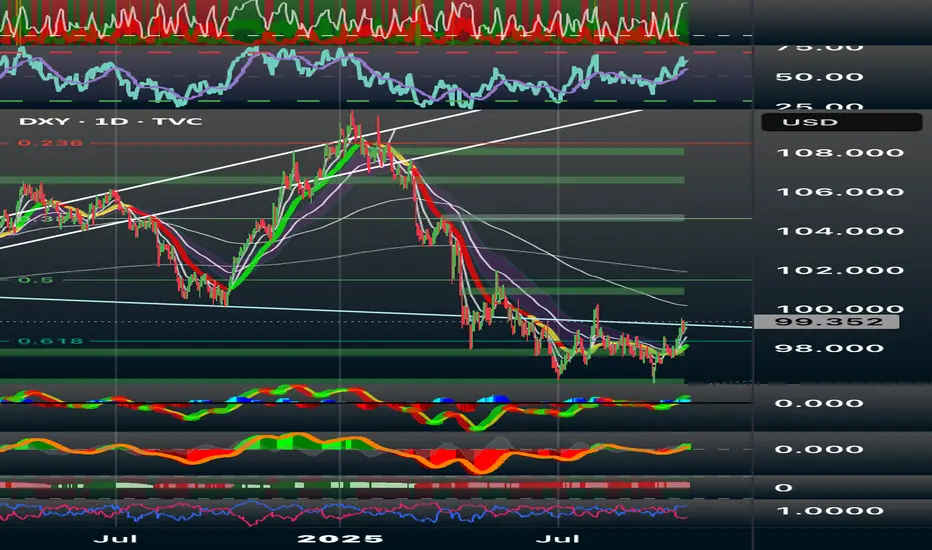
DXY: Key Reversal or Dead Cat Bounce?The U.S. Dollar Index has found footing around the 0.618 Fibonacci retracement near 97.8, breaking a long downtrend. Its push toward the 99.35–100 range suggests a possible retest of a broken structure and alignment with the 50-day EMA. I noticed this move also aligns with short-term recovery signals.
Technical View (1D)
RSI climbing above 50 hints at renewed momentum.
MACD turning green shows early signs of follow-through.
Price is testing 100–101, a former support turned resistance.
If momentum holds, 102, 104, and 106 are the next resistance zones.
Support remains steady at 98, 97, and 95.8, which are shown as strong confluence points with Fibonacci structure.
Scenarios:
If DXY closes above 100.3, I’d expect continuation toward 102.4 or 104.2.
Failure to clear 100 followed by a drop under 98.5 could send it back toward 97.2 or even 95.8.
For now, my bias stays neutral to slightly bullish in the short term. A clean breakout above 100 would confirm a structural shift upward. None the less, I’m watching U.S. yields and upcoming CPI data closely and considering the factor that stronger inflation or a hawkish Fed tone could fuel the next DXY leg higher.
Thank you for your time and support, and as always please remember that this is always NFA and DYOFR, respectfully.
Global Bond Trading1. Introduction to Global Bond Trading
Global bond trading forms the backbone of the world’s financial system. Unlike equities, which represent ownership in companies, bonds are debt instruments through which governments, corporations, municipalities, and international organizations raise capital. When an entity issues a bond, it is essentially borrowing money from investors with a promise to repay the principal along with interest (known as a coupon) at a predetermined future date.
What makes global bond trading so important is its size and influence. The global bond market is far larger than the stock market, with estimates suggesting it surpasses $130 trillion in outstanding debt securities. Every day, trillions of dollars’ worth of bonds are traded across continents, making them one of the most liquid and essential financial assets. From financing infrastructure projects to stabilizing national economies, bonds are at the center of global finance.
2. History and Evolution of Bond Markets
The concept of debt financing is not new. Ancient civilizations such as Mesopotamia and Rome engaged in lending and borrowing with basic debt contracts. However, the modern bond market began to take shape during the Renaissance, when Italian city-states like Venice and Genoa issued debt securities to fund wars and trade expeditions.
17th century: The Dutch East India Company and English Crown issued long-term bonds to finance naval operations and expansion.
18th–19th centuries: Government bonds became critical during wars. For instance, Britain financed the Napoleonic wars largely through bonds.
20th century: After World War II, the U.S. Treasury market became the global benchmark.
21st century: Globalization, electronic trading, and innovations like green bonds and digital bonds expanded the market dramatically.
Thus, bond markets have evolved from war financing to sophisticated platforms supporting global trade, corporate growth, and sustainable development.
3. Types of Bonds in Global Trading
The global bond market is diverse, with instruments catering to different needs:
Government Bonds
Issued by national governments.
Examples: U.S. Treasuries, UK Gilts, Japanese Government Bonds (JGBs), Indian G-Secs.
Seen as “risk-free” in stable economies.
Corporate Bonds
Issued by companies to fund operations or expansion.
Divided into investment-grade (safer, lower yields) and high-yield or junk bonds (riskier, higher yields).
Municipal Bonds (Munis)
Issued by state or local governments (popular in the U.S.).
Used to finance public infrastructure such as schools, roads, and hospitals.
Emerging Market Bonds
Issued by developing countries.
Offer higher returns but carry currency, political, and default risks.
Supranational and Multilateral Bonds
Issued by organizations like the World Bank, IMF, or European Investment Bank.
Support global development projects.
Green and Sustainable Bonds
Funds are directed toward environmentally friendly projects.
Growing rapidly as ESG investing gains momentum.
4. Key Players in Global Bond Markets
The global bond ecosystem involves multiple stakeholders:
Central Banks: Largest participants; they buy/sell bonds to control liquidity, set interest rates, and manage monetary policy.
Institutional Investors: Pension funds, insurance companies, and sovereign wealth funds are major long-term bondholders.
Investment Banks & Dealers: Act as intermediaries, underwriting new bond issues and facilitating secondary trading.
Hedge Funds: Use bonds for trading, arbitrage, and speculative strategies.
Retail Investors: Participate through mutual funds, ETFs, or direct purchases.
Credit Rating Agencies: Agencies like Moody’s, S&P, and Fitch assign ratings that guide investor decisions.
5. Bond Market Mechanics
Bond markets operate in two segments:
Primary Market: Where new bonds are issued. Issuers sell debt through auctions or syndications. Example: U.S. Treasury auctions.
Secondary Market: Where existing bonds are traded among investors, typically over-the-counter (OTC) or via electronic platforms.
Bond Pricing & Yield:
Price and yield move inversely.
Example: If interest rates rise, bond prices fall (because new bonds offer higher returns).
Yield types include current yield, yield to maturity (YTM), and yield to call.
Role of Ratings: Credit ratings (AAA, BBB, etc.) influence pricing and investor demand. A downgrade can sharply increase yields and reduce market value.
6. Factors Influencing Global Bond Markets
Bond markets are shaped by multiple macro and microeconomic factors:
Interest Rates: Central banks (Fed, ECB, BoJ, RBI) heavily influence bond yields. Rising rates usually depress bond prices.
Inflation: High inflation erodes the real return on bonds, leading to higher yields.
Currency Fluctuations: Foreign investors consider currency risks when buying bonds denominated in other currencies.
Credit Risk: Corporate health, sovereign debt sustainability, and fiscal deficits impact bond demand.
Geopolitical Events: Wars, sanctions, and global crises (COVID-19, Ukraine war) cause volatility in bond flows.
7. Trading Strategies in Global Bonds
Professional bond traders use several strategies:
Duration & Yield Curve Plays: Adjusting portfolios based on expectations of interest rate changes.
Credit Spread Trading: Exploiting differences in yields between corporate and government bonds.
Relative Value Trading: Identifying mispriced bonds compared to peers.
Carry Trade: Borrowing in low-yield currencies to invest in high-yield bonds abroad.
Hedging with Derivatives: Using bond futures, swaps, and options to manage risk.
8. Technology and Innovation in Bond Trading
The last two decades brought digital transformation:
Electronic Platforms: MarketAxess, Tradeweb, and Bloomberg revolutionized bond trading.
Algorithmic & AI-driven Trading: Helps in pricing, liquidity discovery, and execution.
Blockchain & Tokenization: Pilot projects are issuing bonds on blockchain, making settlement faster and transparent. Example: World Bank’s “Bond-i.”
9. Risks in Global Bond Trading
Key risks include:
Interest Rate Risk: Prices fall when rates rise.
Credit Risk: Risk of default by issuer.
Liquidity Risk: Some bonds, especially in emerging markets, may be hard to sell.
Currency Risk: Exchange rate volatility impacts foreign investors.
Systemic Risk: Global financial crises often spread through bond markets.
10. Global Bond Markets and Economic Impact
Government Financing: Bonds fund deficits and infrastructure.
Corporate Growth: Companies raise funds without diluting equity.
Capital Flows: Bonds attract cross-border investments, impacting currency values.
Financial Stability: Safe-haven government bonds provide security during crises.
Conclusion
Global bond trading is the invisible engine powering economies worldwide. From funding government welfare to financing corporate innovation, from stabilizing financial systems to driving sustainable growth, bonds remain indispensable. While risks exist—from interest rates to geopolitics—the continued evolution of technology and sustainability ensures that the global bond market will remain at the forefront of finance for decades to come.
US10Y This break-out will be massive.The U.S. Government Bonds 10YR Yield (US10Y) is trading within a 2-year Triangle pattern and following this week's trade events, got back on its 1W MA50 (blue trend-line). A potential break-out either way from this long-term pattern will be massive.
We do believe though that there are higher probabilities for a bearish break-out as the 1W MA50 is about to cross below the 1W MA100 and form the first 1W MA50/100 Bearish Cross since July 22 2019. Interestingly enough, that was following the last Trade War between the U.S. and China.
At the same time, the 1W RSI has been within a Channel Down since late 2022, indicating a huge Bearish Divergence.
-------------------------------------------------------------------------------
** Please LIKE 👍, FOLLOW ✅, SHARE 🙌 and COMMENT ✍ if you enjoy this idea! Also share your ideas and charts in the comments section below! This is best way to keep it relevant, support us, keep the content here free and allow the idea to reach as many people as possible. **
-------------------------------------------------------------------------------
💸💸💸💸💸💸
👇 👇 👇 👇 👇 👇

US Recession Imminent! WARNING!Bond traders are best when it comes to economics. Stock traders not so much.
As the chart shows, historically, when rates bunch up, what follows is a recession. During the recession, the economy tries to fix itself by fanning out the yield curve, marking it cheaper to borrow and boosting the economy.
The best time to be buying up stocks and going long the market is when the yield curve is uninverted and fanned out wide—not when it is bunched up like this.
My followers know this is my first warning of a recession since FEB. 2020.
WARNING! Things can get ugly from here very quickly!

US10Y Strong sell signal below the 1D MA50.The U.S. Government Bonds 10YR Yield (US10Y) has been trading within a Channel Down since the October 23 2023 High. In the past 2 months it has been on a downtrend, which is the technical Bearish Leg of the pattern.
The 1D MACD is on its 2nd Bullish Cross on a decline, very similar with the previous Bearish Leg of the Channel Down. We are again on the 0.5 Fibonacci level and as long as any rebound gets rejected below or on the 1D MA50 (blue trend-line), the long-term bearish pattern remains intact.
We expect a similar Bearish Leg of -24% overall to target 3.685%.
-------------------------------------------------------------------------------
** Please LIKE 👍, FOLLOW ✅, SHARE 🙌 and COMMENT ✍ if you enjoy this idea! Also share your ideas and charts in the comments section below! This is best way to keep it relevant, support us, keep the content here free and allow the idea to reach as many people as possible. **
-------------------------------------------------------------------------------
💸💸💸💸💸💸
👇 👇 👇 👇 👇 👇

US10Y will turn bullish on its 1D MA50.The U.S. Government Bonds 10YR Yield (US10Y) has been trading within a Channel Up pattern since the September 17 2024 Low and is currently on its Bearish Leg. This is now approaching the 1D MA50 (blue trend-line), below which the last Higher Low was priced that initiated the Bullish Leg.
With the 1D RSI approaching the same level as then, this is the ideal level to go long again and target 5.000%, which is just below the October 23 2023 Resistance.
-------------------------------------------------------------------------------
** Please LIKE 👍, FOLLOW ✅, SHARE 🙌 and COMMENT ✍ if you enjoy this idea! Also share your ideas and charts in the comments section below! This is best way to keep it relevant, support us, keep the content here free and allow the idea to reach as many people as possible. **
-------------------------------------------------------------------------------
💸💸💸💸💸💸
👇 👇 👇 👇 👇 👇

Bond Looks ready for PumpHi Guys
Bond Looks good here for move up.
Best buy area is around 3.30 - 3.40 but also we can buy a part here.
Dyor plz.
If u bought it please use stoploss.
Good luck.

US10Y going lower as Fed has no choice but to continue cutting.More than 1 year ago (November 7 2023, see chart below), we made a bold (for the time being) call on the U.S. Government Bonds 10YR Yield (US10Y), as against the prevailing market sentiment we gave a sell signal, right after what turned out to be a top:
Today we revisit this pattern, following yesterday's Rate Cut by the Fed primarily because of their statements that instead of 4, they will only proceed to 2 more cuts in 2025. We believe this to be false and expect the Fed to quickly resume the previous outlook.
The chart shows that the 1M RSI Lower Highs have are consistent with the previous Bearish Reversal on the US10Y price, similar to 2006 - 2007. We are expecting to hit the 0.382 Fibonacci retracement level at 2.100%, as the Fed's Cut Cycle will be accelerated in order to meet within 12-18 months their 2% inflation target and stabilize.
For better illustration we have plotted also the U.S. Interest Rate (red trend-line), where you can clearly see that the fractal we compare to today, is right before cuts started in August 2007. Also it is a natural consequence for the US10Y to fall when rate cut cycles start, evident also in June 2019, December 2000, May 1995, May 1989 September 1984, May 1981 etc.
-------------------------------------------------------------------------------
** Please LIKE 👍, FOLLOW ✅, SHARE 🙌 and COMMENT ✍ if you enjoy this idea! Also share your ideas and charts in the comments section below! This is best way to keep it relevant, support us, keep the content here free and allow the idea to reach as many people as possible. **
-------------------------------------------------------------------------------
💸💸💸💸💸💸
👇 👇 👇 👇 👇 👇

US10Y 1D RSI Bearish Divergence signals a long-term sell.The U.S. Government Bonds 10YR Yield (US10Y) has been trading within a Channel Down pattern since the December 27 2023 Low. The price is above both the 1D MA50 (blue trend-line) and the 1D MA200 (orange trend-line) and is approaching the patterns top.
The 1D RSI is already making a bearish reversal though, having posted Lower Highs against the price's Higher Highs, which technically is a Bearish Divergence. As a result, we expect the Bullish Leg to top soon and then reverse to the Channel's new Bearish Leg.
The previous one made a Lower Low at the bottom of the pattern on the 1.2 Fibonacci extension level and as a result our Target is just above it at 3.500%.
-------------------------------------------------------------------------------
** Please LIKE 👍, FOLLOW ✅, SHARE 🙌 and COMMENT ✍ if you enjoy this idea! Also share your ideas and charts in the comments section below! This is best way to keep it relevant, support us, keep the content here free and allow the idea to reach as many people as possible. **
-------------------------------------------------------------------------------
💸💸💸💸💸💸
👇 👇 👇 👇 👇 👇

US10Y Look for a 1D MA50 rejection.A month ago (August 21, see chart below) we argued why the U.S. Government Bonds 10YR Yield (US10Y) would go lower with the Fed having no choice but the cut the Interest Rates:
Well the Fed did it and cut the rates not just by -0.25% but -0.50%, initiating the new cut Cycle. Now let's look at the US10Y's price action on a smaller time-frame, namely the 1D.
As you can see the pattern is a double Channel Down, with the price trading below the 1D MA50 (blue trend-line) since July 03 2024. That is the current Resistance and until it breaks (1D candle closing above it), we should be looking every time for a sell near it.
Assuming the Bearish Legs of the diverging (dotted) Channel Down are symmetrical like those of May and June, our Target is 3.450%, representing a -10.50% decline (same as August's Bearish Leg).
-------------------------------------------------------------------------------
** Please LIKE 👍, FOLLOW ✅, SHARE 🙌 and COMMENT ✍ if you enjoy this idea! Also share your ideas and charts in the comments section below! This is best way to keep it relevant, support us, keep the content here free and allow the idea to reach as many people as possible. **
-------------------------------------------------------------------------------
💸💸💸💸💸💸
👇 👇 👇 👇 👇 👇

Recession Now Well Underway The yield curve is now fully inverted after reaching EXTREME levels. With that, we can conclude the recession has officially contaminated the financial sector.
Soon (likely before year end) we will see a significant selloff in equities.
Suggest: sell stocks & buy US Treasury Bonds.

20yr yield breakout from C waveCurrently monitoring the 20yr bond yield. On this Chart. I've found a desc. Triangle breakout set up with a bullish wave count. Also notice the yield is at an oversold level for this time frame and below the cloud. I'm looking for the yield to retrace back up above the 5th elliot wave and close above 4.367at minimum before going higher.
Disclosure: I have puts on NASDAQ:TLT

US10Y Expecting a bullish reversal at the bottom.The U.S. Government Bonds 10 YR Yield (US10Y) initially expanded but then took a breather on the new Bullish Leg, as per our January 24 (see chart below) buy signal, before hitting our Target:
The price is now approaching the bottom of the 2-year Channel Up yet again and by next week a 1D Death Cross will be completed. The 2 previous such formations within the Channel Up, have both been made right on its Higher Lows.
As a result, we consider this a great bullish opportunity for the medium-term. Our Target is intact at 5.000%.
-------------------------------------------------------------------------------
** Please LIKE 👍, FOLLOW ✅, SHARE 🙌 and COMMENT ✍ if you enjoy this idea! Also share your ideas and charts in the comments section below! This is best way to keep it relevant, support us, keep the content here free and allow the idea to reach as many people as possible. **
-------------------------------------------------------------------------------
💸💸💸💸💸💸
👇 👇 👇 👇 👇 👇

US10Y First 1D Golden Cross after 9 months formed!The U.S. Government Bonds 10 YR Yield (US10Y) is expanding the new Bullish Leg, and continues to follow the buy signal we gave on January 24 (see chart below):
The key development today is the formation of the first Golden Cross on the 1D time-frame in 9 months (since July 10 2023). This is a huge technical buy signal on its own and becomes even more so since it is so rare. The previous Golden Cross before July 2023 was on October 29 2021, which means that when the market forms this pattern, the price rallies aggressively.
That is exactly what we expect to happen now. A short-term pull-back to test the 1D MA50 (blue trend-line) similar to July 19 2023, is possible but as long as it holds, we expect our 5.000% Target to get hit relatively soon.
Beyond that, we need to see the previous Higher High breaking (similar to August 21 2023) to justify further buying. If that happens we will look for a new Higher High extension on the 1.618 Fibonacci extension level, approximately around 5.800%.
-------------------------------------------------------------------------------
** Please LIKE 👍, FOLLOW ✅, SHARE 🙌 and COMMENT ✍ if you enjoy this idea! Also share your ideas and charts in the comments section below! This is best way to keep it relevant, support us, keep the content here free and allow the idea to reach as many people as possible. **
-------------------------------------------------------------------------------
💸💸💸💸💸💸
👇 👇 👇 👇 👇 👇

US10Y Touched its 1D MA50. Time to rebound?The U.S. Government Bonds 10 YR Yield (US10Y) is expanding the new Bullish Leg, which we gave a buy signal on last time (January 24, see chart below):
Yesterday it touched the 1D MA50 (blue trend-line for the first time since the February 05 break-out. During the previous leg of the 1.5 year Channel Up, the 1D MA50 held all the way until the formation of the new Higher High.
As a result, we are bullish as long as it closes the 1D candles above it, with our 5.000% Target intact.
-------------------------------------------------------------------------------
** Please LIKE 👍, FOLLOW ✅, SHARE 🙌 and COMMENT ✍ if you enjoy this idea! Also share your ideas and charts in the comments section below! This is best way to keep it relevant, support us, keep the content here free and allow the idea to reach as many people as possible. **
-------------------------------------------------------------------------------
💸💸💸💸💸💸
👇 👇 👇 👇 👇 👇

US10Y About to form a 1D Death Cross. How to trade it?The U.S. Government Bonds 10 YR Yield (US10Y) has gone a long way since our last 1D analysis 3 months ago (October 21 2023, see chart below), hitting all 3 Targets in the process:
This time however it is in a completely different situation as it may be rebounding since the Higher Low at the bottom of the long-term Channel Up on December 28, but is being rejected on the 1D MA50 (blue trend-line) since Friday. As a result by tomorrow it will complete a 1D Death Cross, which is technically a bearish pattern.
Last time it was formed however (May 04 2023), it did so exactly on a bottom and a very strong 6-month rally started. Also technically, every time it finished such a downtrend (blue ellipse), strong rallies above the 1D MA50 followed.
As a result our trading plan will be based on simple break-outs. As long as the price closes a 1D candle above the 1D MA50, and remains within the Channel Up, we will be bullish targeting the 5.000% Resistance. If however it breaks below Support 1, the loss will be minimal and we will reverse to a sell, targeting Support 2 at 3.300%.
-------------------------------------------------------------------------------
** Please LIKE 👍, FOLLOW ✅, SHARE 🙌 and COMMENT ✍ if you enjoy this idea! Also share your ideas and charts in the comments section below! This is best way to keep it relevant, support us, keep the content here free and allow the idea to reach as many people as possible. **
-------------------------------------------------------------------------------
💸💸💸💸💸💸
👇 👇 👇 👇 👇 👇

Macro Monday 30~U.S. Net Treasury International Capital FlowsMacro Monday 30
U.S. Net Treasury International Capital Flows
In essence the U.S. Net Treasury International Capital Flows (US TIC Flows) refer to the movement of funds into or out of the United States through the purchase or sale of U.S. Treasury securities by foreign investors and governments. These flows of capital are an essential component of the overall balance of payments, reflecting the financial transactions between the United States and the rest of the world.
What does the data represent exactly?
The U.S. Treasury International Capital (TIC) system is compiled by the U.S. Department of the Treasury and provides information on cross-border financial transactions. The TIC data include details on purchases and sales of various U.S. financial assets and liabilities, such as Treasury securities, corporate bonds, equities, and banking flows.
In simple terms the Foreign Purchases of U.S. Securities (inflows) are taken away from the U.S. Purchases of Foreign Securities (outflows) to present a overall net figure. The net result of these two components determines whether there is a net inflow or outflow of capital.
What are the drivers of positive & negative flows?
Positive Flows (>0 on chart)
POSITIVE FLOWS in U.S Net Treasury International Capital result from factors such as attractive U.S. interest rates, a stable domestic economy, and global uncertainty that drives foreign investors to seek the safety of U.S. Treasury securities. During these periods, there is a net inflow of capital into the United States pressing the number higher above zero.
Negative Flows (<0 on chart)
Conversely, NEGATIVE FLOWS occur when other countries offer higher returns, there are concerns about the U.S. economic outlook, or global risk aversion prompts investors to repatriate funds. Exchange rate movements also play a role, as a stronger U.S. dollar can make U.S. assets less appealing.
The interplay of the above mentioned factors influences the direction of international capital flows, which impacts the balance of purchases and sales of U.S. Treasury securities by foreign and domestic investor.
Now that we have a general sense of what’s driving the data, and what makes an overall net positive and or net negative flow, let’s have a look at the chart.
The Chart
✅ Since Jan 2019 there has been an upward trend in Treasury Inflows into the U.S (Black Arrow).
❌This upward trend had one sudden interruption causing a decline from Mar - May 2023 going from positive inflows of $114B to negative outflows of $159.4B, the timing of which coincided with the 2023 U.S Banking Crisis where three small-to-mid size U.S. banks failed.
✅ Since the Banking Crisis in May 2023 Treasury Capital flows have moved from overall negative outflows of $159.4B to overall positive inflows of $260.2B. A major turn around and reversion to the long term trend.
✅The recent surge in positive inflows to $260.2B are the highest recorded since August 2022 ($275B)
In summary inflows to U.S Treasuries have been in an general uptrend since January 2019 with one brief interruption from Mar – May 2023 and inflows have increased significantly in recent months and look like they may be about to take out the Aug 2022 highs.
Recession Patterns
1. More isolated recessions that were not globally systemic events led to positive net inflows into the U.S. Treasury however larger global events led to outflows from U.S. Treasuries, particularly if those global events involved the U.S. engaging in foreign conflicts.
▫️ During the DotCom Crash (No. 3 on the chart) – The tech sector was badly hit but it was not necessarily a global recession with the associated geopolitical turmoil. Foreign investors sought safety in the U.S. Treasury Market during this time.
▫️ Similarly during the brief Gulf War Recession (No. 4 on the chart) you can see that initially, there was increased net inflows however in Jan 1991 inflows sharply turned to outflows which coincided with the U.S. led invasion of Kuwait (a response to Iraq’s invasion of Kuwait). This was considered a global event and thus led to an exodus of outflows and repatriation of funds from the U.S Treasury Market.
▫️ More recently during the Great Financial Crisis (no. 2 on the chart) and the COVID-19 Crash (No. 1 on the chart) there was a significant outflow from U.S. Treasuries due to the magnitude of these global events. You can imagine foreign market participants clawing funds back into their respective countries to batten the hatches and get into a defensive financial position with global systemic risks high. Better to have a bird in the hand than two in the bush when the bush is on fire.
▫️One other pattern worth mentioning is highlighted in yellow on the chart with an A, B and C. Prior to the Great Financial Crisis and COVID-19 crashes we first had a reduction in overall U.S. Net Treasuries of $373B (A on chart) and $393B (B on chart), respectively. Within 13 to 16 months of both treasure drawdowns we had a recession. We recently had a drop of $437B (C on chart) which ended in May 2023. If history repeats and we had a recession within 13-16 months of this happening, this would be sometime between June and Sept 2024. An alternative view would be that the increase in declines from $373B (A) to $393B (B) to $437B (C) may correspond with the shortening timeframes from 16 months(A) to 13 months(B) to potentially 10 months(C) for the current $437B drop (C on the chart). This would suggest March/April 2024 as a potential recession timeframe (based on the historic reductive time pattern).
The U.S. Net Treasury International Capital Flows is a fascinating chart to keep an eye on and should be added to the economic data armory as it will help us interpret what is really going on in the treasury market (there is a lot of false narratives out there ATM). It is also useful in informing us on what the global perspective is in terms of systemic risk vs isolated risk, and also from a historic recessionary standpoint offers value.
The best investors in the world call the bond market the market of truth but I have found it hard to find a chart that illustrates this through a global lens UNTIL today. This chart captures that beautifully.
Thanks for coming along again
PUKA

Time Doesn't Matter, Price Matter ..Double Your Money PlanTime Doesn't Matter, Price Matter ..Double Your Money Plan..Bond will Pump More than 100 % From here. It has found support

BOND/USDT Break out the descending channel. Continue Upward ???💎 BOND is currently a standout in the market, having achieved a breakout from a descending channel pattern. It's now moving into a retesting phase at the resistance trendline, a pivotal moment for its next market move.
💎 Should BOND successfully complete this retest, we could see a continuation of its upward trajectory, aiming for a significant resistance area that we've been targeting.
💎 However, if BOND fails to affirm its breakout during the retest at the resistance trendline, it might suggest a false breakout. In this case, BOND could retreat back to the demand zone.
💎 A key aspect to monitor is BOND's behavior in the demand area. If it fails to demonstrate a strong recovery and only manages to consolidate, this could indicate a weakening demand. Such a scenario could see BOND transitioning into a bearish phase, potentially moving downwards towards a more substantial support area.

US10Y Is this the end of Bond Yields' 3.5 year run?The U.S. Government Bonds 10 YR Yield (US10Y) is pulling-back towards the 1W MA50 (blue trend-line) and bottom of the Rising Wedge. The pattern is getting too tight and the squeeze will inevitably result in a break-out and new trend/ pattern.
If the Rising Wedge breaks downwards, it will mean the end of the yield's +3.5 year bullish run and will have a high impact both on stocks and Gold. In fact there are high probabilities of that happening as a similar Rising Wedge broke to the downside at the end of 2018.
If that gets materialized, then the first attempt should be on the 3.300% Support 1 level, before the 1W MA200 (orange trend-line) gets closer for the test of its long-term Support status.
-------------------------------------------------------------------------------
** Please LIKE 👍, FOLLOW ✅, SHARE 🙌 and COMMENT ✍ if you enjoy this idea! Also share your ideas and charts in the comments section below! This is best way to keep it relevant, support us, keep the content here free and allow the idea to reach as many people as possible. **
-------------------------------------------------------------------------------
💸💸💸💸💸💸
👇 👇 👇 👇 👇 👇
