Support and Resistance Area: 0.9563-1.0036
Hello, traders!
Follow us to get the latest information quickly.
Have a great day!
-------------------------------------
(TWTUSDT 1W Chart)
The key support and resistance area is 1.65-1.8839.
To break above this important support and resistance zone, we need to see if the price can maintain support near 1.0036 and rise above 1.4026.
-
(1D chart)
Since the HA-High indicator on the 1D chart was generated at 0.9563, it's crucial to see if the price can maintain above 0.9563-1.0036.
To achieve this, the key is whether the price can rise after finding support near 1.2224.
Therefore, if the price falls below 1.2224, support around 0.9563-1.0036 will be crucial.
------------------------------------
The basic trading strategy is to buy in the DOM(-60) ~ HA-Low range and sell in the HA-High ~ DOM(60) range.
However, if the price rises from the HA-High to DOM(60) range, it is likely to exhibit a step-like upward trend, while if it falls from the DOM(-60) to HA-Low range, it is likely to exhibit a step-like downward trend.
Therefore, the basic trading strategy should be a segmented trading strategy.
Buying when the HA-High to DOM(60) range shows support requires a short and quick response.
As mentioned earlier, the HA-High to DOM(60) range is considered a sell zone, or resistance zone.
Therefore, if possible, it's best to find a buying opportunity when the price declines and then rises.
1. The K indicator of the StochRSI indicator should be rising. If possible, it should not enter the overbought zone.
2. The On-By-Sign-Operative (OBV) indicator should be rising. If possible, it should remain above the High Line.
3. The TC (Trend Check) indicator should be rising. If possible, it should be above the 0 point.
When the three indicators listed above are met, the price is likely to continue its upward trend.
-
Thank you for reading to the end.
We wish you successful trading.
--------------------------------------------------
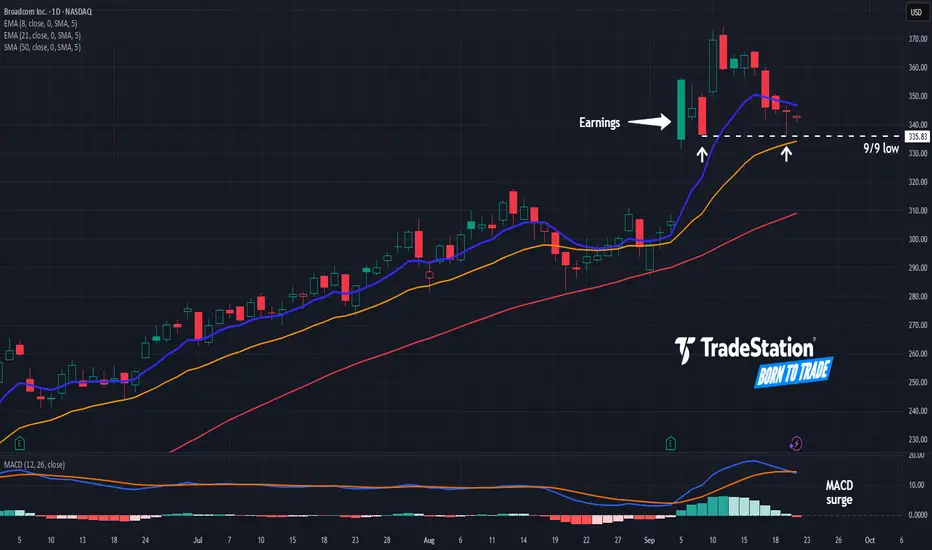
Breadth Indicators

Broadcom Rallied. Now it’s Pulled Back.Broadcom surged to new record highs two weeks ago and now it’s pulled back.
The first pattern on today’s chart is the gap on September 5 after results beat estimates and management revealed a new large customer. That surge may reflect bullish sentiment in the chip stock.
Second, AVGO went on to make a weekly low of $335.83 two sessions later. Last Friday, it bounced slightly above that level. Is new support in place?
Third, the 8-day exponential moving average (EMA) is above the 21-day EMA. MACD has also surged. Those signals may reflect short-term bullishness.
Next, AVGO is an active underlier in the options market. That could help traders take positions with calls and puts.
TradeStation has, for decades, advanced the trading industry, providing access to stocks, options and futures. If you're born to trade, we could be for you. See our Overview for more.
Past performance, whether actual or indicated by historical tests of strategies, is no guarantee of future performance or success. There is a possibility that you may sustain a loss equal to or greater than your entire investment regardless of which asset class you trade (equities, options or futures); therefore, you should not invest or risk money that you cannot afford to lose. Online trading is not suitable for all investors. View the document titled Characteristics and Risks of Standardized Options at www.TradeStation.com . Before trading any asset class, customers must read the relevant risk disclosure statements on www.TradeStation.com . System access and trade placement and execution may be delayed or fail due to market volatility and volume, quote delays, system and software errors, Internet traffic, outages and other factors.
Securities and futures trading is offered to self-directed customers by TradeStation Securities, Inc., a broker-dealer registered with the Securities and Exchange Commission and a futures commission merchant licensed with the Commodity Futures Trading Commission). TradeStation Securities is a member of the Financial Industry Regulatory Authority, the National Futures Association, and a number of exchanges.
Options trading is not suitable for all investors. Your TradeStation Securities’ account application to trade options will be considered and approved or disapproved based on all relevant factors, including your trading experience. See www.TradeStation.com . Visit www.TradeStation.com for full details on the costs and fees associated with options.
Margin trading involves risks, and it is important that you fully understand those risks before trading on margin. The Margin Disclosure Statement outlines many of those risks, including that you can lose more funds than you deposit in your margin account; your brokerage firm can force the sale of securities in your account; your brokerage firm can sell your securities without contacting you; and you are not entitled to an extension of time on a margin call. Review the Margin Disclosure Statement at www.TradeStation.com .
TradeStation Securities, Inc. and TradeStation Technologies, Inc. are each wholly owned subsidiaries of TradeStation Group, Inc., both operating, and providing products and services, under the TradeStation brand and trademark. When applying for, or purchasing, accounts, subscriptions, products and services, it is important that you know which company you will be dealing with. Visit www.TradeStation.com for further important information explaining what this means.
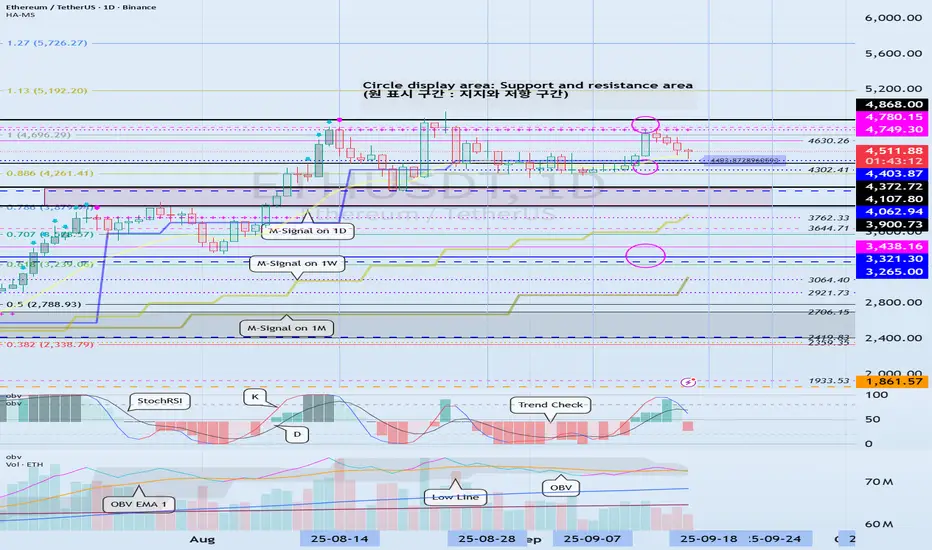
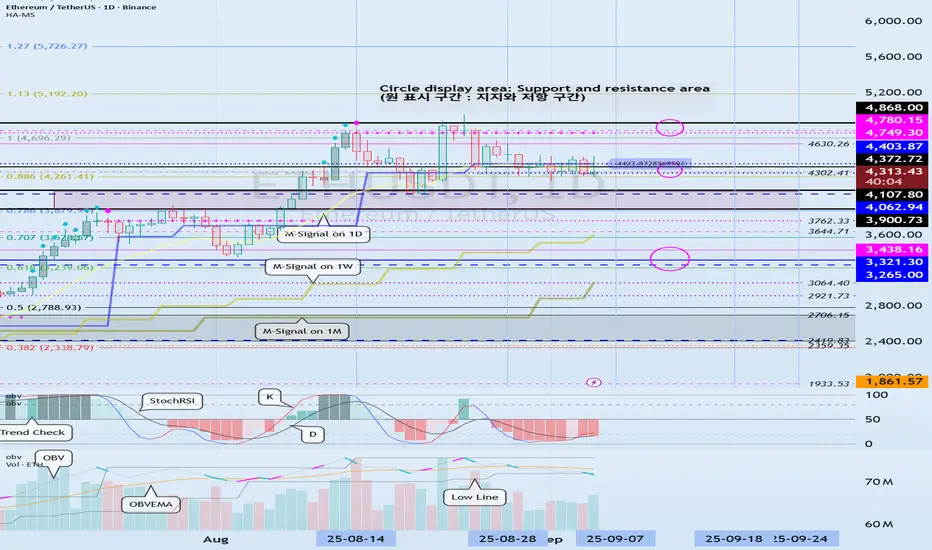
Volatility Period: Around September 18th (September 17th-19th)
Hello, fellow traders!
Follow us to get the latest information quickly.
Have a great day!
-------------------------------------
(ETHUSDT 1D Chart)
The 4403.87-4749.30 range, which is the HA-High ~ DOM (60) range, represents a resistance zone.
Therefore, we need to monitor the price movement after the current volatility period, around September 18 (September 17-19).
To sustain the uptrend, the price must remain above the 3900.73-4107.80 range.
From a medium- to long-term perspective, the 3265.0-3321.30 range is a key area.
Considering the above, if it falls below 4403.87,
1st: 4107.80-4372.72
2nd: 3265.0-3321.30
Therefore, it is likely to fall to the first and second levels above.
Therefore, the key question is whether it can find support near 4403.87 after this period of volatility.
-
When trading, it's important to understand the current price level.
I believe there are several ways to determine this.
My basic trading strategy is to determine when to trade.
My basic trading strategy is to buy when support is found in the DOM(-60) ~ HA-Low range and rise, and to sell when it touches the HA-High ~ DOM(60) range.
However, if the price rises in the HA-High ~ DOM(60) range, a step-like upward trend is likely, while if it falls in the DOM(-60) ~ HA-Low range, a step-like downward trend is likely.
Therefore, the basic trading strategy should be a segmented trading strategy.
If you were unable to buy in the DOM(-60) ~ HA-Low range, but the current price is within the DOM(-60) ~ HA-Low range, you should check for support.
Support is determined by checking whether support is found near the HA-Low or DOM(60) indicators.
If you bought when support was found near the HA-Low indicator, the first sell position would be near the DOM(60) indicator.
If you bought when support was found near the DOM(60) indicator, you should execute the trade quickly and effectively.
If the price falls below the purchase price, it would be considered a buy at the high.
To prevent this to some extent, we've utilized several indicators for verification.
First, we utilize the M-Signal indicator on the 1M, 1W, and 1D charts.
That is, if the M-Signal indicator is passing near important support and resistance levels, the presence of support in that area is likely to play a more important role.
Currently, the M-Signal indicator on the 1D chart is passing near 4403.87, so we should consider the area around 4403.87 as a potential important support and resistance level.
Second, we should monitor the movements of auxiliary indicators such as the TC (Trend Check) indicator, the StochRSI indicator, and the On-By-Signal (OBV) indicator.
For the price to continue its upward trend in this important support area,
- the StochRSI indicator must show an upward trend. If possible, it's best to avoid entering the overbought zone.
- The OBV indicator should be showing an upward trend. If possible, it should remain above the High Line.
- The TC (Trend Check) indicator should be showing an upward trend. If possible, it should remain above the 0 level.
By monitoring the movements of the three indicators above, you can determine whether there is support near important support and resistance levels.
However, you should not blindly trust the movements of auxiliary indicators. Even if you have identified the movements of auxiliary indicators, you should always monitor the price movement.
To determine support, you should monitor the price movement for at least 1-3 days.
This is especially important during periods of volatility.
Volatility is a period where you cannot predict the direction of movement, so extra caution is required.
Therefore, if possible, it's better to observe the situation and find a trading opportunity after the volatility period has passed rather than entering a new trade during a volatile period.
-
Thank you for reading to the end. I wish you successful trading.
--------------------------------------------------
- Here's an explanation of the big picture.
(3-year bull market, 1-year bear market pattern)
I'll explain more in detail when the bear market begins.
------------------------------------------------------

The key is whether it can rise above 3.9509
Hello, fellow traders.
Please "Follow" to always get the latest information quickly.
Have a great day.
-------------------------------------
(SUIUSDT 1D Chart)
Since the HA-High ~ DOM (60) ranges on the 1W and 1D charts partially overlap, a breakout above the 3.9509-4.7328 range is expected to lead to a sharp rise.
Therefore, the 3.9509-4.7328 range is considered a resistance zone.
The HA-Low and HA-High indicators are converging as price movements move.
If this convergence occurs, the converged range, i.e., the HA-Low ~ HA-High range, can be considered a buy zone.
If the price falls below the 2.4495-2.8161 range, trading should be halted and the situation should be monitored.
Currently, the M-Signal indicator on the 1M chart is moving between 2.4495 and 2.8161. Therefore, if the price falls below this level, a stop loss should be considered and a response strategy should be developed.
Based on a basic trading strategy, a buy signal is signaled when support is found in the 2.4495-2.8161 range.
However, if the price falls below the M-Signal indicator on the 1M chart, a downtrend is likely, requiring a response strategy.
-
I mentioned the resistance range as 3.9509-4.7328. However, since the HA-High ~ DOM (60) range on the 1D chart is 3.9509-4.3260, a buy signal can be made when the price finds support within this range and rises.
However, since the buy signal is near the resistance level, a quick and short response is required.
The first sell range is 4.7328-4.96.
-
Thank you for reading to the end.
I wish you successful trading.
--------------------------------------------------

The 115854.56-119177.56 area is a resistance zone
Hello, fellow traders!
Follow us to get the latest information quickly.
Have a great day!
-------------------------------------
(BTCUSDT 1D chart)
Looking at the big picture, there are two important areas.
These are the 104463.99-18353.0 and 84814.27-93570.28 levels.
To continue the stepwise uptrend, an upward breakout of the 116259.91-119177.56 level is necessary.
The M-Signal indicator on the 1D and 1W charts is passing through the 108353.0-116259.91 level. If support is found in this area, the price is likely to continue attempting to break above the 116259.91-119177.56 level.
If the price declines to the 104463.99-18353.0 level and encounters resistance, it is expected to eventually encounter the M-Signal indicator on the 1M chart.
Currently, the M-Signal indicator on the 1M chart is moving between 84814.27 and 93570.28, so it's important to determine whether it can find support within this range.
--------------------------------------
Two OBV EMA lines have been added to the OBV indicator in the Low Line ~ High Line channel.
OBV EMA 1 can be used as a short-term indicator, EMA 2 as a medium-term indicator, and EMA 3 as a long-term indicator.
Disabling EMA 3 reveals that the OBV is currently above both EMA 1 and EMA 2, indicating a transition from EMA 1 to EMA 2.
If OBV rises above the High Line and remains above it, the price is likely to continue its upward trend.
Currently, the price has been trending upward as the OBV indicator has risen above the High Line, but with the High Line indicator re-emerging, it appears to be declining below the High Line.
However, as mentioned earlier, since the OBV indicator is holding above EMA 1 or EMA 2, the key is whether the current support and resistance zones hold support.
In other words, the key is whether support can be found and an upward movement can occur around the 115,854.56-116,259.91 range.
The 115,854.56 and 116,259.91 points are the HA-High indicator levels on the 1D and 1W charts.
Therefore, the current support and resistance zones should be considered resistance zones and a corresponding strategy should be developed.
The basic trading strategy is to buy between DOM(-60) and HA-Low and sell between HA-High and DOM(60).
However, if the price rises in the HA-High ~ DOM(60) range, it could exhibit a step-like upward trend, while if it falls in the DOM(-60) ~ HA-Low range, it could exhibit a step-like downward trend.
Therefore, the basic trading strategy should be a segmented trading strategy.
Therefore, those who bought near the DOM(-60) ~ HA-Low range should consider selling in segments.
If you want to make a new purchase, you can do so when the HA-High ~ DOM(60) range shows support. However, this requires a quick and short response, so caution is advised.
From a broader perspective, this means buying in a sell zone.
-
I believe whether the price will rise or fall in the future depends on whether it can break above Zone 1.
There's a possibility of a bear market turning around, with a new all-time high (ATH) occurring between the week of November 24th and the week of January 26th, 2026.
More details will likely emerge as this month progresses.
This month's volatility period will be around September 19th and September 28th.
-
Thank you for reading.
I wish you successful trading.
--------------------------------------------------
- This is an explanation of the big picture.
(3-year bull market, 1-year bear market pattern)
I will explain in more detail when the bear market begins.
------------------------------------------------------

Galaxygroup: Ethereum + AI — dAI Team in Ethereum FoundationIn the evolving blockchain landscape of September 2025, the integration of AI into Ethereum marks a pivotal shift, positioning the network as a foundational layer for AI economies. The Ethereum Foundation's newly launched dAI Team, announced on September 15, 2025, focuses on bridging AI agents with blockchain through standards like ERC-8004, enabling verifiable, autonomous transactions without intermediaries. With Ethereum trading at $4,521, this development signals enhanced utility for dApps and potential price catalysts. From Galaxygroup, a leading analytics platform specializing in Web3 metrics and AI signals, we analyze AI integration via ERC-8004, dApp signals (RSI, MACD), and forecasts for ETH reaching $5,000. Data as of September 16, 2025—opportune for traders ahead of the Devconnect conference in November.
Galaxygroup provides real-time dashboards for Ethereum AI tracking; sign up for our demo to leverage these insights.
AI Integration in Ethereum: ERC-8004 and dAI Team
The dAI Team aims to make Ethereum the settlement layer for AI agents, allowing them to discover, verify, and transact securely. ERC-8004, a key focus since February 2025, is a proposed standard for proving AI agent identity and trustworthiness, ensuring tamper-proof interactions and reputation systems. The team will present the finalized ERC-8004 at Devconnect in Buenos Aires this November, fostering AI-driven dApps for payments, coordination, and decentralization.
Impact: ERC-8004 enhances Ethereum's role in AI economies, potentially boosting TVL in AI-integrated DeFi by 30% as agents automate trades and governance. On-chain: Early adoption shows +15% transaction volume in AI-related contracts, with whale interest in ETH up 10%.
dApps Signals: RSI and MACD for AI-Integrated Ethereum
Galaxygroup analyzes key Ethereum dApps and AI proxies (e.g., Fetch.ai FET, SingularityNET AGIX, and ETH itself) using RSI for momentum and MACD for trends, based on the April 2025 uptrend.
ETH ($4,521): Support at $4,350–$4,450 (50% Fibonacci retracement). Resistance at $4,760–$4,900. RSI at 58 (bullish momentum above 50, healthy without overbought). MACD: Bullish crossover (histogram +0.15), signaling accelerating impulse—entry on dips for 10–15% upside. On-chain: Gas fees down 20% post-Pectra, AI dApp TVL +25%.
FET (AI Proxy dApp): Support at $2.50–$2.70 (38.2% Fibonacci). Resistance at $3.00–$3.20. RSI at 62 (strong trend). MACD: Histogram +0.12, divergence bullish—target 12% to $3.20 amid ERC-8004 hype. On-chain: AI agent transactions +30%, integrations with Ethereum up 15%.
Ethereum AI Aggregate (e.g., AGIX/ETH proxies, ~$1.20 equivalent): Support at $1.10–$1.15 (61.8% Fibonacci). Resistance at $1.30–$1.35. RSI at 55 (neutral-bullish divergence). MACD: Squeeze in Bollinger Bands—breakout signal for 8–12% gains. On-chain: dAI Team announcements drove +20% volume in AI contracts.
Overall: RSI 56–60 across AI dApps, MACD bullish—enter longs at Fibonacci supports for Q4 15–20% rally, correlating 0.7 with ETH.
Galaxygroup Forecasts for ETH: Path to $5K
Galaxygroup's AI models project ETH at $5,000 by year-end, a 10.6% rise from $4,521, driven by dAI Team momentum and ERC-8004 adoption. Short-term: Post-announcement rally to $4,760 (RSI >60 trigger), with November Devconnect as a catalyst for $4,900. Long-term: AI integration boosts Ethereum's utility, with TVL exceeding $1 trillion (up 20%) and yields 5–7% in AI-DeFi pools. Risks: Regulatory scrutiny on AI agents; hedge with stablecoins. Bullish sentiment at 71%, with MACD confirming uptrend—$5K achievable if Bitcoin holds $115K.
Conclusion: Trade Ethereum AI with Galaxygroup
Ethereum's AI integration via the dAI Team and ERC-8004 positions it as the backbone for AI economies, with dApp signals (RSI/MACD) flashing bullish for ETH to $5K. Galaxygroup's tools deliver precise on-chain forecasts.
Ready to invest? Join Galaxygroup for AI alerts and demo access. What's your ETH target? Comment below!
#EthereumAI #dAITeam #ERC8004 #ETH #Galaxygroup
Advanzia Group: Tokenization of RWA — BlackRock and $29B On-ChaiIn 2025, the tokenization of real-world assets (RWA) has evolved from a niche trend to a mainstream financial tool, bridging traditional finance with blockchain. The total on-chain RWA market has reached $29 billion (up 260% YTD), with Ethereum dominating at 57%. BlackRock, through its BUIDL fund, leads in tokenized treasuries with $5.5 billion in assets. From Advanzia Group, an analytics platform specializing in Web3 metrics and AI-driven signals, we explore the RWA market, Fibonacci and RSI levels for key tokens (ONDO, MKR, RWA tokens), and trading signals. Data as of September 16, 2025—prime time for positioning ahead of institutional inflows.
Advanzia Group equips traders with dashboards for on-chain analysis; sign up for demo access to seize the edge.
RWA Market Overview: $29B On-Chain, Ethereum 57%
RWA tokenization digitizes assets like treasuries, real estate, and bonds on the blockchain, enabling liquidity and 24/7 trading. The total market stands at $29 billion, with treasuries accounting for 40% ($11.6 billion), led by BlackRock’s BUIDL at $5.5 billion (45% of tokenized treasuries). Ethereum holds 57% ($16.5 billion), followed by Solana (20%) and Polygon (15%). The 260% YTD growth is driven by regulations (MiCA, GENIUS Act) and institutional inflows: $4.7 billion in Q2.
On-chain: DeFi RWA TVL is $150 billion, with transactions up 25% (Ethereum + Solana). Advanzia’s AI detects a 71% bullish sentiment: whale accumulation in ONDO (+15%), with potential for $50 billion by year-end.
BlackRock’s Role: BUIDL and Tokenized Treasuries
BlackRock, with $10 trillion AUM, drives RWA through BUIDL (launched 2024), tokenizing US Treasuries on Ethereum with $5.5 billion in assets. The fund offers a 5.2% yield (above inflation), redeemable in USDC. Impact: BUIDL boosts RWA liquidity by 30%, integrating with Aave and Uniswap. Forecast: BlackRock aims for $2 trillion in RWA by 2030, with BUIDL reaching $10 billion by 2026.
For traders: BUIDL strengthens RWA-treasury correlation (0.8), reducing volatility; BUIDL token RSI at 55 signals neutral-bullish momentum.
Fibonacci and RSI Levels for Key RWA Tokens
Advanzia analyzes top RWA tokens: ONDO (Ondo Finance), MKR (MakerDAO), and aggregated RWA protocols. Levels based on April’s trend.
ONDO ($1.45): Support at $1.20–$1.30 (50% Fibonacci retracement). Resistance at $1.50–$1.60. RSI at 58 (bullish momentum, above 50). MACD: Crossover above zero—signal for 10–15% growth to $1.65. On-chain: TVL $2.5 billion, inflows +20%.
MKR ($2,800): Support at $2,500–$2,600 (38.2% Fibonacci). Resistance at $2,900–$3,000. RSI at 62 (healthy trend, not overbought). Bollinger Bands: Squeeze signals upward breakout. On-chain: DAI collateral $8 billion, RWA integration +15% TVL.
RWA Tokens (aggregate, ~$0.95 equivalent): Support at $0.85–$0.90 (61.8% Fibonacci). Resistance at $1.00–$1.05. RSI at 55 (neutral, bullish divergence). MACD: Histogram +0.12—8% growth momentum. On-chain: Ethereum 57%, treasury inflows $1.2 billion.
Overall trend: RWA RSI 56–60, Fibonacci support at $0.90—bullish for Q4.
Trading Signals from Advanzia Group
Leverage our AI signals for RWA trading:
Long ONDO: Enter above $1.30 (RSI >55), stop at $1.20, target $1.65 (Fib 61.8%). Yield 10–15% on DeFi collateral.
MKR Arbitrage: On MACD crossover and Bollinger breakout, long with DAI hedge; target $3,000, 5% risk.
RWA Aggregate: Buy at Fibonacci support ($0.90), RSI divergence—8–12% upside. Hedge with treasury ETFs.
Forecast: $50 billion on-chain by December, with BlackRock at $10 billion. RWA/BTC correlation at 0.7—diversify 10–20% of portfolio.
Conclusion: Invest in RWA with Advanzia
RWA tokenization at $29 billion (Ethereum 57%) is a breakthrough, led by BlackRock’s BUIDL. Fibonacci and RSI signal a bullish trend for ONDO/MKR. Advanzia’s AI is your tool for signals and on-chain insights.
Ready for growth? Join Advanzia Group for alerts. Which RWA is on your radar? Comment below!
#RWA #Tokenization #BlackRock #Ethereum #AdvanziaGroup

Explanation of the Basic Trading Strategy
Hello, fellow traders!
Follow me to get the latest information quickly.
Have a great day.
-------------------------------------
To understand the charts, the basic trading strategy is the concept used.
Let's look at an example.
---------------------------------------------------------
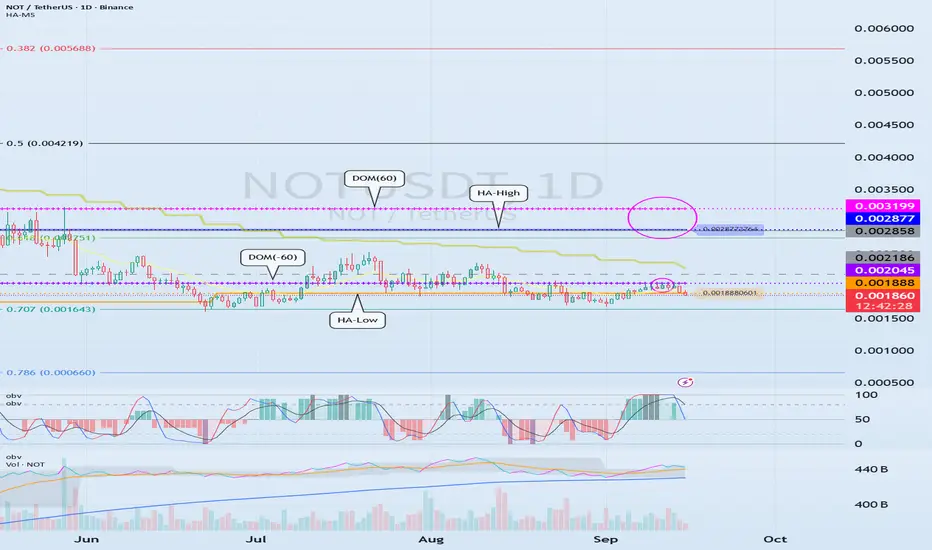
The OBV indicator, which follows the Low Line ~ High Line channel, has shown an upward trend as it has broken above EMA 1 and EMA 2.
Afterwards, the DOM(60) and HA-High indicators were formed, ultimately returning the price to its original position.
Since the HA-Low indicator is forming at 0.001888, we need to examine whether it can find support and rise around this level.
In other words, a buy signal is in the 0.001888-0.002045 range, where support is found and the price rises.
Since the HA-Low and HA-High indicators have converged, a sharp rise is expected if the sideways movement ends and the price rises above 0.002877-0.003199.
-
The basic trading strategy is based on the HA-Low and HA-High indicators, indicators developed for trading on Heikin-Ashi charts.
The basic trading strategy is to buy in the DOM(-60) to HA-Low range and sell in the HA-High to DOM(60) range.
However, if the price rises from the HA-High to DOM(60) range, a step-like upward trend is likely, while if it falls from the DOM(-60) to HA-Low range, a step-like downward trend is likely.
Therefore, the basic trading strategy should be a segmented trading approach.
Therefore, rather than predicting trends based on the movements of one or two indicators, you should prioritize developing a basic trading strategy.
-
If the HA-Low indicator touches and rises to meet the HA-High indicator, the wave should be considered closed.
Furthermore, if the HA-High indicator touches and falls to meet the HA-Low indicator, the wave should also be considered closed.
Remember that the closing of these waves serves as a benchmark for creating new trading strategies.
Previous waves should be forgotten and new trading strategies developed.
-
Thank you for reading to the end.
I wish you successful trading.
--------------------------------------------------
Volatility Period: Around September 7th (September 6th-10th)
Hello, traders!
Follow us to get the latest information quickly.
Have a great day!
-------------------------------------
(ETHUSDT 1D Chart)
This volatility period is around September 7th (September 6th-10th).
After this period of volatility, the key question is whether the price can find support and rise above the 4403.87-4749.30 level.
-
To continue the cascading upward trend, the price must rise above 4749.30.
Therefore, we need to monitor whether the price maintains above the 4749.30-4868.0 level.
-
If resistance is encountered at 4403.87 and the price declines, it is likely to decline until it meets the HA-Low indicator.
Therefore, we need to check for support around 4302.41-4403.87.
However, there is a possibility of a rise after touching the previous all-time high (ATH) range of 3900.73-4107.80, so we need to consider a response plan.
If the price falls below 4107.80, it is expected to touch the M-Signal indicator on the 1W chart and resume the trend.
-------------------------------
The On-By-Signal (OBV) indicator is falling below the Low Line.
The TC (Trend Check) indicator is below 0.
The K value of the StochRSI indicator is showing signs of rising from the oversold zone.
If the High Line of the OBV indicator falls and forms a downward channel, it is highly likely that selling pressure will continue to dominate, so caution is advised when trading.
Therefore, the key issue this time is whether support is found around 4302.41-4403.87.
The TC (Trend Check) indicator is a comprehensive evaluation of the StochRSI, On-By-Signal (OBV), and PVT-MACD Oscillator indicators.
Therefore, if the TC indicator is below 0, selling pressure is dominant, and the price is likely to decline.
If the K value of the StochRSI indicator continues to rise, the price is likely to rise after this period of volatility.
However, for the uptrend to continue, the OBV and TC indicators must show upward trends.
-
Thank you for reading to the end.
We wish you successful trading.
--------------------------------------------------
- Here's an explanation of the big picture.
(3-year bull market, 1-year bear market pattern)
I'll explain more in detail when the bear market begins.
------------------------------------------------------
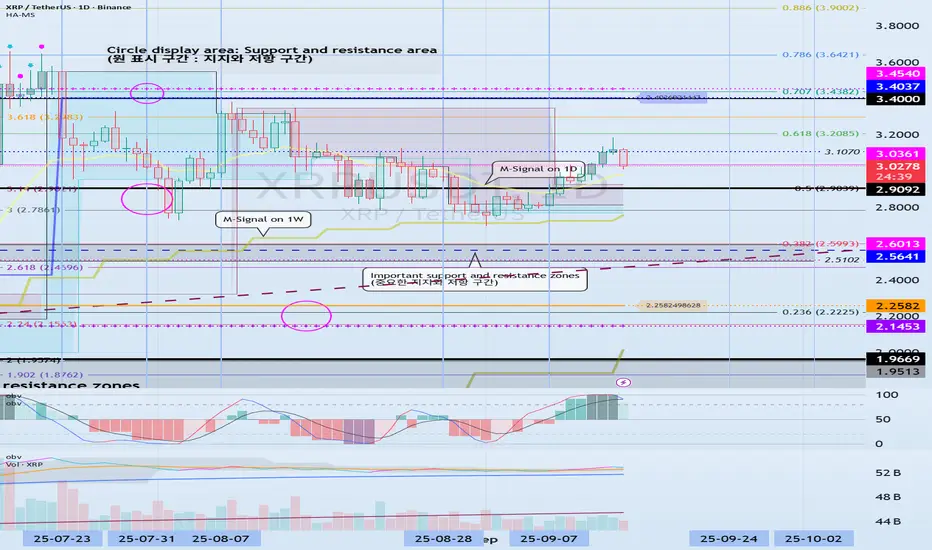
Check for support around 3.0361
Hello, fellow traders!
If you "Follow" me, you'll always get the latest information quickly. Have a great day today.
-------------------------------------
(XRPUSDT 1D chart)
The next volatility period is around September 24th.
However, we should closely monitor the movements around September 18th, which is also the volatile period for BTC.
The key is whether it can find support near 3.0361 and rise above 3.4037.
If not, we should check for support near 2.9092.
The 3.0361 level is the DOM (60) indicator point on the 1M chart. If it finds support near this level and rises, it could potentially lead to a long-term, step-like uptrend.
However, since the HA-High ~ DOM (60) range on the 1D chart is currently formed in the 3.4037-3.4540 range, a breakout above this range is expected to initiate a stepwise uptrend.
-
Thank you for reading to the end.
I wish you successful trading.
--------------------------------------------------
- Here's an explanation of the big picture.
(3-year bull market, 1-year bear market pattern)
I will provide more details when the bear market begins.
------------------------------------------------------
Long TLT/SPY📌 Bonds Explained: What They Are, How They Work & Key Risks
Bonds are one of the oldest and most important financial instruments in global markets. They are used by governments, corporations, and institutions to raise money, and by investors to earn income, diversify portfolios, and manage risk.
At their core, a bond is a loan:
The issuer (borrower) raises capital by selling bonds.
The investor (lender) provides money in exchange for periodic interest payments (coupon payments) and the return of the principal (face value) at maturity.
🔹 1. What is a Bond?
When you buy a bond, you are lending money to the issuer. The issuer promises:
Interest payments (usually fixed) on a regular schedule (semiannual or annual).
Repayment of principal (the original investment amount) when the bond matures.
📌 Example:
You invest $1,000,000 in a 10-year bond paying 3% annually (semiannual coupons).
Every 6 months, you receive $15,000 in interest payments.
At the end of 10 years, you (hopefully) receive back your original $1,000,000 principal.
🔹 2. Why Do Companies and Governments Issue Bonds?
Governments → Fund infrastructure, social programs, defense, or refinance existing debt.
Corporations → Finance expansion, research, acquisitions, or refinance loans.
Municipalities → Build schools, hospitals, and roads.
Bonds allow issuers to access large pools of capital without giving up ownership (like stocks).
🔹 3. Why Do Investors Buy Bonds?
Stable Income: Regular coupon payments.
Capital Preservation: Return of principal at maturity (assuming no default).
Diversification: Bonds often behave differently from stocks, balancing risk.
Hedging Inflation/Interest Rates: Certain bonds (like TIPS) protect against inflation.
Relative Safety: High-quality government bonds are considered safe-haven assets.
🔹 4. Key Types of Bonds
Government Bonds
Issued by sovereign states.
Example: U.S. Treasuries, UK Gilts, German Bunds.
Generally low risk, lower yields.
Corporate Bonds
Issued by companies.
Higher yields than government bonds but higher risk.
Municipal Bonds
Issued by local governments or agencies.
Often come with tax benefits for investors.
High-Yield (Junk) Bonds
Issued by lower-credit issuers.
Higher potential returns, but much riskier.
Inflation-Protected Bonds
Coupon/principal linked to inflation.
Example: U.S. TIPS (Treasury Inflation-Protected Securities).
🔹 5. Three Main Risks of Investing in Bonds
Even though bonds are often seen as “safe,” they carry risks that investors must understand:
1️⃣ Credit Risk (Default Risk)
The issuer may fail to pay coupons or repay the principal.
Higher with corporate bonds and emerging market government bonds.
Mitigated by credit ratings (Moody’s, S&P, Fitch).
📌 Example:
If a company defaults, you may lose part or all of your investment.
2️⃣ Interest Rate Risk
Bond prices move inversely to interest rates.
If rates rise, existing bond prices fall (since new bonds offer better yields).
If you sell before maturity, you could face a loss.
📌 Example:
You bought a 10-year bond at 3%. A year later, rates rise to 5%. Your bond’s market value falls, because investors prefer newer bonds paying higher coupons.
3️⃣ Inflation Risk (Purchasing Power Risk)
Even if you hold the bond to maturity, rising inflation erodes the real value of your returns.
A 3% coupon loses attractiveness if inflation rises to 6%.
📌 Example:
Your bond pays $30,000 annually, but inflation pushes up costs by $40,000 per year → you are effectively losing purchasing power.
🔹 6. Bonds vs. Stocks
Bonds: Debt, fixed income, contractual obligation, lower risk, limited upside.
Stocks: Equity ownership, dividends (optional), higher risk, unlimited upside.
In a company bankruptcy, bondholders are paid before shareholders.
🔹 7. How Investors Use Bonds in Portfolios
Income generation: Retirees and pension funds rely on coupon payments.
Diversification: Bonds often rise when stocks fall, reducing portfolio volatility.
Risk management: Safe-haven bonds (like Treasuries) act as “insurance” during crises.
Speculation: Traders can bet on interest rate moves via bond futures and ETFs.
🔹 8. Bonds vs. Stocks: The TLT–SPY Correlation
One of the most widely followed relationships in global markets is the correlation between:
TLT → iShares 20+ Year Treasury Bond ETF (tracks long-dated U.S. Treasury bonds).
SPY → SPDR S&P 500 ETF (tracks U.S. equities).
📈 Historical Relationship
Over the past two decades, TLT and SPY have often moved in opposite directions. (The Correlation between SPY/TLT often hovers around 0.)
Why? When stocks sell off, investors typically seek safety in Treasuries, pushing bond prices up (yields down).
This negative correlation makes bonds a powerful diversifier in equity-heavy portfolios (60/40).
📌 Example:
2008 Financial Crisis → SPY plunged ~37%, while long-dated Treasuries (TLT) surged as investors fled to safety.
March 2020 COVID Crash → SPY fell ~34% peak-to-trough, TLT spiked ~20% as the Fed cut rates and investors piled into Treasuries.
🐂 Strategy #1 (MA):
Buy SPY when TLT crosses below the 95 MA.
Sell SPY when TLT crosses above the 95 MA.
🔄 But the Correlation Can Shift
In inflationary environments, bonds and stocks can fall together.
2022 is a perfect example:
Inflation spiked → Fed hiked rates aggressively.
TLT dropped ~30% (yields surged).
SPY also fell ~19%.
Both asset classes sold off simultaneously, breaking the hedge.
🐂 Strategy #2 (Re-Balancing):
Buy TLT at the close of the seventh last trading day of the month.
Sell TLT at the close of the last trading day of the month.
Sell TLT short at the close of the month.
Cover TLT at the close of the seventh trading day of the month.
Higher Returns after rate hikes.
📊 Why This Matters for Investors
In normal times: TLT acts as a counterweight to SPY, smoothing portfolio volatility.
In inflationary shocks: Both can decline, reducing diversification benefits.
Lesson: Don’t assume bonds will always hedge equities — context (inflation, Fed policy, growth cycles) matters.
📌 Practical Uses of the TLT–SPY Correlation
Portfolio Diversification
A 60/40 portfolio (60% stocks, 40% bonds) relies on the negative correlation.
Works best when inflation is low and stable.
Risk-On / Risk-Off Gauge
If both SPY and TLT rise → markets are calm, liquidity flows into both risk and safety.
If SPY falls while TLT rises → classic risk-off move (flight to safety).
If both fall → inflation or policy tightening environment (no safe haven).
Trading Signals
Divergence trades: When SPY rallies but TLT also rallies strongly, it may signal equity rally exhaustion (risk-off brewing).
Macro hedge: Long TLT positions can offset downside risk in SPY-heavy portfolios — but only in disinflationary or deflationary shocks.
🔹 9. EWJ–TLT Correlation: Japan Equities vs. U.S. Treasuries
EWJ → Tracks Japanese equities (large & mid-cap companies).
TLT → Tracks U.S. long-dated Treasuries.
Unlike the classic SPY–TLT inverse correlation, the EWJ–TLT relationship is more complex, shaped by:
Global risk sentiment (risk-on/risk-off flows).
Currency effects (USD/JPY exchange rate).
Japan’s ultra-low interest rate environment (BoJ policy).
📈 Historical Tendencies
1️⃣ Risk-Off Periods (Global crises → flight to safety):
TLT rallies (U.S. Treasuries bid).
EWJ often falls, as Japanese equities are highly cyclical and export-driven.
Negative correlation dominates.
📌 Example:
2008 Crisis → TLT surged; EWJ plunged with global equities.
2020 COVID Crash → Same pattern: safety flows to Treasuries, Japanese stocks sold.
2️⃣ Risk-On Periods (Liquidity, global growth optimism):
EWJ rallies with global equities.
TLT may drift lower (yields rising on stronger growth).
Correlation weak to moderately negative.
📌 Example:
2016–2018: Global growth rebound → EWJ rose, TLT fell as U.S. yields climbed.
3️⃣ Currency Channel (USD/JPY)
Japanese equities (EWJ) are sensitive to the yen.
A stronger USD/JPY (weaker yen) boosts exporters (good for EWJ).
TLT rallies often coincide with USD weakness (yields down, dollar down), which can hurt Japanese exporters, adding another layer of inverse correlation.
🔄 Shifts Over Time
Long-term average correlation: Mildly negative (similar to SPY–TLT, but weaker).
During inflation shocks (2022): Correlation turned positive at times:
TLT fell as U.S. yields spiked.
EWJ also struggled due to global tightening & yen weakness.
Both moved down together, breaking the hedge.
📊 Why EWJ–TLT Matters
Global Diversification Check: Investors often think Japanese equities diversify U.S. equities, but they can be just as cyclical. Adding TLT creates the real hedge.
Risk-Off Signal: When both EWJ and TLT rise, it may indicate global liquidity easing (rare but bullish).
Currency Overlay: Always factor USD/JPY → sometimes EWJ’s move is more about currency than equities.
🐂 Strategy #3 (EWJ):
When Japanese stocks are above their 150-day moving average, go long TLT (US long-term Treasury). When the average is below the 150-day average, stay out. The correlation between TLT and EWJ can serve as a breath signal.
📌 Conclusion: Bonds as the Foundation of Finance
Bonds are the backbone of the global financial system, connecting borrowers (governments, corporations) with lenders (investors).
✅ Bonds provide regular income and capital preservation.
✅ They carry risks: credit, interest rate, and inflation.
✅ They are essential for diversification and risk management.
✅The TLT–SPY correlation is dynamic. Historically negative, providing diversification. In inflationary shocks (like 2022), the correlation turns positive, breaking the hedge.
✅ EWJ–TLT is a Global Macro Hedge, But Fragile. Usually inverse: Risk-off = TLT up, EWJ down. Sometimes aligned: Inflation shocks or synchronized global tightening → both down. Currency filter essential: USD/JPY often mediates the relationship. This makes EWJ–TLT correlation a powerful barometer of global macro regimes: Disinflationary slowdowns → Strong hedge. Inflationary crises → Hedge breaks.
For investors, understanding bonds is crucial, even if you primarily trade equities or commodities, because bond yields influence everything: stock valuations, mortgage rates, and even currency markets.

Check if it can rise above 347.21
Hello, traders!
Follow us to get the latest updates quickly.
Have a great day!
-------------------------------------
(TSLA 1D chart)
The key is to determine which direction the price breaks out of the two support and resistance areas of 268.07-311.48 and 347.21-382.40.
For a step-up trend to occur, the price must remain above 334.09-347.21.
However, a step-up trend is highly likely only if the price rises above the support and resistance levels of 382.40 and 421.06 on the 1W and 1M charts.
Even so, a larger increase is likely if the price rises above the 334.09-347.21 range on the 1D chart.
-
The 268.07-311.48 range also falls within the HA-High indicator.
Therefore, it's important to remember that the current position is not a buy position, but rather a sell position.
However, for new buys, it's best to initiate them when support is found near the M-Signal indicator on the 1M chart, if possible.
Therefore, when the 268.07-311.48 range acts as a support zone, it can be considered a buying opportunity.
However, since it's within the HA-High indicator zone, trades should be executed with short and quick responses.
The key volatility period is around October 7th, but before that, we should check the movements around September 5th and September 12th.
At this time, the trend is likely to be determined by which direction the price moves: the 268.07-311.48 range or the 347.21-382.40 range.
-
Thank you for reading to the end.
I wish you successful trading.
--------------------------------------------------

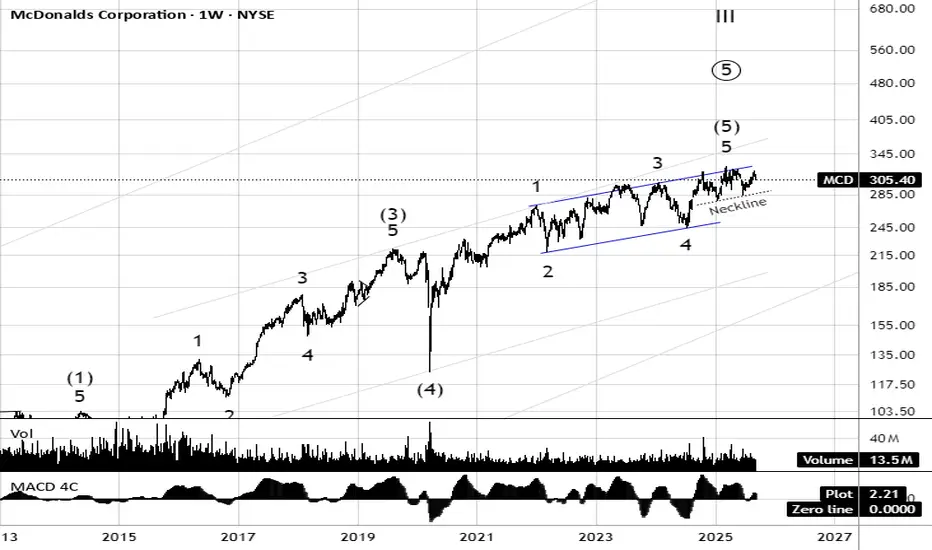
MCD produces ending diagonal to terminate 2020 advanceMcDonald’s (MCD) appears to be in the late stages of a long-term Elliott Wave advance, with the final 5th (5) wave nearing exhaustion inside a rising wedge pattern. Momentum divergences and the neckline support around $285 highlight growing risk of a breakdown. If the wedge fails, a corrective phase could unfold, targeting the 210–240 region where prior 4th wave support lies. Until then, upside is capped near $330–340, making the risk-reward skewed toward caution at current levels.
Elementary TA - Cup & HandleIn pure return % from the 2022 bottom (+330%) ; following 'Cup & Handle' TA guidelines, the +330% yields a future CRYPTOCAP:BTC price near the $300k mark...
Using the drawdown % from the 2021 ATH (-76.5%) and applying the same 'Cup & Handle' methodology, we have a more sober target of +76.5% from ~$70k and yield a future CRYPTOCAP:BTC price of $125k...
God speed

CAD/CHF – Bearish Outlook In 3 StepsCAD/CHF – Bearish Outlook 🚨
Pair: CAD/CHF
Bias: Bearish
The CAD/CHF is showing signs of weakness
on the charts. Here’s what to think about:
Fibonacci Breakdown 📉
Price has broken below key Fibonacci
retracement levels, confirming
that the upward correction is exhausted.
Sellers are now in control, and deeper
retracement toward lower
fib zones is expected.
MACD Crossover 🔻
The MACD has crossed bearish, signaling
momentum is shifting
strongly to the downside.
This crossover aligns with the Fibonacci
breakdown, giving confluence
to the bearish setup.
Trend Context 📊
On higher timeframes, CAD/CHF
has been struggling near resistance.
Current structure suggests a potential
continuation lower as the
Canadian Dollar weakens against the Swiss Franc.
📌 Trading Plan
Sell Bias: Look for short entries
below broken fib levels.
Targets: Next Fibonacci zones
lower (0.618 → 0.786 retracement area).
Stop Loss: Above the broken
fib retracement + MACD confirmation zone.
👉 In simple words: CAD/CHF is crashing,
and technicals (Fibonacci + MACD crossover)
confirm the bearish momentum.
Rocket boost this content to learn more.
Disclaimer: Please use a simulation
trading account before you trade with
real money because trading is risky.

Check for support near 111696.21
Hello, traders!
Follow us to get the latest information quickly.
Have a great day!
-------------------------------------
(BTCUSDT 1D chart)
The TC (Trend Check) indicator appears to have risen above the 0 level.
Accordingly, the key question is whether support can be found around 111696.21.
For the uptrend to continue, the OBV indicator must rise above the High Line and remain so.
-
The volatility period in September is expected to occur around September 9th, September 19th, and September 28th.
-
Thank you for reading.
I wish you successful trading.
--------------------------------------------------
- This is an explanation of the big picture.
(3-year bull market, 1-year bear market pattern)
I will explain in more detail when the bear market begins.
------------------------------------------------------

Checking for support near 171.26
Hello, traders!
Follow me to get the latest information quickly.
Have a great day!
-------------------------------------
(NVDA 1M chart)
The basic trading strategy is to buy in the DOM(-60) ~ HA-Low range and sell in the HA-High ~ DOM(60) range.
However, if the price rises from the HA-High to DOM(60) range, a step-like uptrend is likely, while if it falls from the DOM(-60) to HA-Low range, a step-like downtrend is likely.
Therefore, the basic trading strategy should be a segmented trading strategy.
-
Looking at the current 1M chart, the HA-High to DOM(60) range is 121.80-138.23.
Therefore, if the price holds above 121.80-138.23, the step-like uptrend is likely to continue.
The left Fibonacci ratio was drawn in the first wave, and the key is whether the price can rise above 3.618 (181.85) and hold.
The right Fibonacci ratio was drawn in the second wave, and the key is whether the price can rise above 1 (198.88).
Therefore, the key question is whether the price can break above the 181.85-198.88 range.
If the price fails to rise,
1st: 152.89
2nd: 121.80-138.23
We need to check for support near the 1st and 2nd levels above.
-
(1D chart)
The HA-High ~ DOM(60) range on the 1D chart is 180.76-182.70.
Therefore, for a stepwise uptrend to begin, the price must rise above 180.76-182.70 and maintain its position.
The 171.26 level is the HA-High indicator level on the 1W chart.
Therefore, the key question is whether support is found near 171.26.
If it falls below 171.26, it is likely to decline until it meets the M-Signal indicator on the 1W chart.
At this point, the key is whether it can find support near 152.89, the Fibonacci 3 level (157.76) to the left.
If it falls below the M-Signal indicator on the 1W chart, there is a possibility of a downtrend, so you should consider a response plan.
------------------------------------------------
If this is your first time hearing this explanation, you may not understand what I'm talking about.
The important thing is that the DOM(-60) and HA-Low indicators indicate lows, while the DOM(60) and HA-High indicators indicate highs.
Therefore, buys should be made near the DOM(-60) and HA-Low indicators, and sells should be made near the DOM(60) and HA-High indicators.
To interpret charts from a long-term perspective, you need to check the positions of the DOM(-60), HA-Low, HA-High, and DOM(60) indicators on the 1M chart.
The 1W chart is interpreted from a medium- to long-term perspective, while the 1D chart is interpreted from a short-term perspective.
In the stock market, price fluctuations are often driven by issues other than the chart itself, so it's important to always be aware of volatility.
Even so, since volatility ultimately occurs after the chart is created, it's best to analyze the chart first and then examine other issues.
Otherwise, you'll likely end up creating a trading strategy that heavily reflects your own subjective opinions.
-
Thank you for reading to the end.
I wish you successful trading.
--------------------------------------------------
The key is whether the price can rise above 240.55 and hold
Hello, fellow traders!
Follow me to get the latest information quickly.
Have a great day.
-------------------------------------
(AAPL 1D chart)
The basic trading strategy is to buy in the DOM(-60) ~ HA-Low range and sell in the HA-High ~ DOM(60) range.
However, if the price rises from the HA-High to DOM(60) range, a step-like uptrend is likely, while if it falls from the DOM(-60) to HA-Low range, a step-like downtrend is likely.
Therefore, the basic trading strategy should be a segmented trading strategy.
-
The HA-High to DOM(60) range on the current 1D chart is 229.27-232.78.
Therefore, if the price remains above the 229.27-232.78 range, a step-like uptrend is highly likely.
However, looking at the chart overall, the 226.67-240.55 range corresponds to the HA-High indicator.
Therefore, it is necessary to check for support within the 226.67-240.55 range.
If it rises above 240.55, it is expected to attempt to rise to the 250.42-260.10 range.
The 250.42 and 255.59 levels correspond to the DOM(60) indicator on the 1M chart and the DOM(60) indicator on the 1W chart, respectively.
Therefore, to sustain the mid- to long-term uptrend, the price must rise above 250.42-255.59 and maintain its position.
-
Based on the basic trading strategy mentioned earlier, this is currently within the range for a partial sell-off.
Buying in this range requires a short and quick response, so be cautious.
Buying is possible when the 226.67-240.55 range shows support.
If it falls below 226.67, cut your losses and wait to see how the situation develops.
If the price falls below the M-Signal indicator on the 1M chart and remains there, there's a possibility of a medium- to long-term downtrend, so a countermeasure is needed.
-
The HA-Low indicator on the 1D chart is currently at 192.31.
This point is located within the previous all-time high (ATH) range of 182.94-199.62, making the 182.94-199.62 range an important support area.
-
(1M chart)
The area highlighted by the circle represents an important area.
-
Thank you for reading to the end.
I wish you successful trading.
--------------------------------------------------

EURAUD 1 Sep 2025Reasons for entering the trade:
1- Simultaneous breakout of the last high/low and the bearish Kumo (1H)
2- Weakening of the bearish wave
3- RSI divergence (1H)

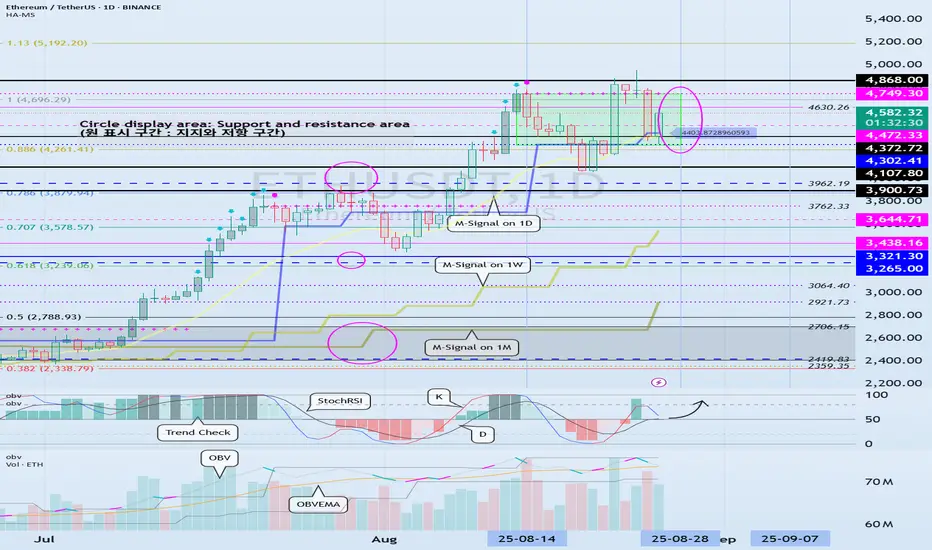
Volatility Period: Around August 28 (August 27-29)
Hello, fellow traders!
Follow us to get the latest information quickly.
Have a great day!
-------------------------------------
(ETHUSDT 1D chart)
It's rising, with support near 4372.72.
However, since the TC (Trend Check) indicator is at 0, it's unclear where the price will bounce.
Therefore, we need to determine whether support is found around 4630.26 or whether the price falls below 4472.33.
This period of volatility is expected to last from August 27th to 29th.
-
To initiate a cascading upward trend, support must be found around 4749.30.
-
Thank you for reading to the end.
I wish you successful trading.
--------------------------------------------------
- This is an explanation of the big picture.
(3-year bull market, 1-year bear market pattern)
I will explain in more detail when the bear market begins.
------------------------------------------------------
The key is whether it can rise above 237.60
Hello, fellow traders!
Follow us to get the latest information quickly.
Have a great day.
-------------------------------------
(SOLUSDT 1M Chart)
To understand the strangely drawn trendline, you need to refer to the StochRSI indicator.
This is because the StochRSI indicator was used to draw the trendline.
When the K indicator of the StochRSI forms a peak in the overbought zone, a trend line is drawn by connecting those peaks. When the K indicator forms a peak in the oversold zone, a trend line is drawn by connecting those peaks.
When drawn this way, the trend line drawn in the overbought zone becomes the high trend line, and the trend line drawn in the oversold zone becomes the low trend line.
However, due to the long timeframe of the 1M chart, the high and low trend lines are not separated and are instead displayed as a single line.
Of the three trend lines, we need to determine whether the upward trend can continue along trend line (1).
The DOM (60) indicator is forming at 237.60, so the key question is whether it can break above this level.
Illegible areas are marked with circles.
-
(1W Chart)
Looking at the explanation of the big picture below, a major bear market is expected to begin in 2026.
However, the trend lines drawn on the chart suggest that the upward trend could continue until the first quarter of 2026.
With time remaining until the end of 2025, we need to closely monitor BTC's movements.
The DOM (60) indicator on the 1M chart is at 237.60, so the key question is whether it can break above 237.60 and maintain its price.
However, the DOM (60) ~ HA-High range formed in the 202.45-222.61 range on the 1W chart, so whether it can find support within this range is crucial.
Accordingly, the volatility period on the 1W chart is the period around the week of September 29th, i.e., September 22nd to October 5th.
Please refer to the circled area on the 1M chart for the important period.
-
(1D chart)
This volatility period ends on August 29th.
The next volatility period will be around September 7th.
After the volatility period around September 7th, we need to see if the price remains above 195.92.
If the price remains above trendline (1), it is highly likely that an attempt to rise above 222.61 will occur.
---------------------------------
As mentioned earlier on the 1W chart, the key question is whether the price can rise above 237.60.
To draw a line, we need to examine whether the 202.45-222.61 range provides support and can move upward.
From this perspective, if the 202.45-222.61 range provides support, it's considered a buying opportunity.
However, considering the basic trading strategy, buying in the DOM(-60) ~ HA-Low range and selling in the HA-High ~ DOM(60) range is necessary, so we can see that this is actually a selling opportunity.
Therefore, executing a new purchase in the 202.45-222.61 range requires a short and quick response.
If you maintain a basic trading strategy, you can either sell in installments to gain psychological stability or choose to purchase additional shares when the 202.45-222.61 range provides support.
-
Some people argue that support and resistance aren't important, but rather whether the price will rise or fall.
Yes, I agree with this.
However, to move up or down, you need to understand the support and resistance points or ranges that serve as reference points.
If you can't distinguish between these, you won't be able to trade, regardless of whether the price is rising or falling.
Therefore, you need to evaluate how important the support and resistance points or ranges formed at the current price are.
If you don't understand this, you'll end up trading by buying late after the price has risen or selling late after the price has fallen.
-
Thank you for reading to the end.
I wish you successful trading.
--------------------------------------------------
- This is an explanation of the big picture.
(3-year bull market, 1-year bear market pattern)
I will explain in more detail when the bear market begins.
------------------------------------------------------

Important range: 115854.56-119177.56
Hello, traders!
Follow us for quick updates.
Have a great day!
-------------------------------------
(BTCUSDT 1D chart)
This period of volatility is expected to last from August 23rd to 25th.
It found support near 111696.21 and rose above 115854.56.
Therefore, the key question is whether it can find support near 115854.56 and rise above 119177.56.
If it falls below 115854.56, it could fall to around 108353.0.
If it rises above 119177.56 this time and holds, it could attempt to rise near the right Fibonacci level 2.618 (133889.92) during the next volatility period, around September.
Therefore, we should watch for support in the HA-High ~ DOM (60) range of 115854.56-119177.56 and see if it rises above that level.
-
Looking at the OBV indicator of the Low Line ~ High Line channel, it appears to be transitioning into a downward channel.
Therefore, if the OBV indicator fails to rise above the High Line, there is a possibility of forming a short-term top.
-
Thank you for reading to the end.
I wish you successful trading.
--------------------------------------------------
- Here's an explanation of the big picture.
(3-year bull market, 1-year bear market pattern)
I will explain more in detail when the bear market begins.
------------------------------------------------------
