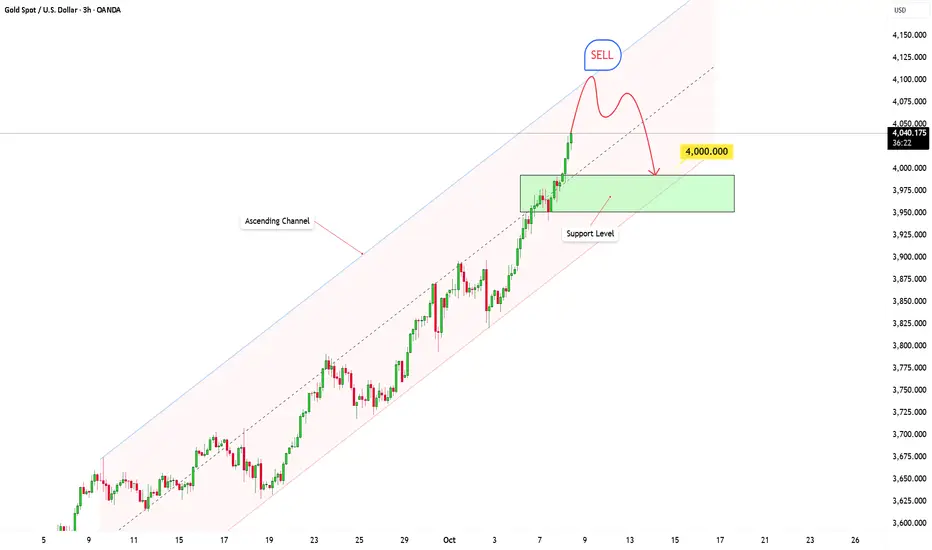
Gold Setup: Overbought Conditions Indicate Potential PullbackHey everyone, it's Kilian!
Right now, gold is entering a really interesting phase. The price is approaching the 4100 level, a key psychological threshold, and it could potentially become a dynamic resistance formed by the upper boundary of the ascending channel. This is a crucial area where selling pressure might increase, leading to the possibility of a short-term pullback or profit-taking.
Based on the current market structure, if the price confirms rejection at this resistance level, there's a high likelihood of a price drop. The nearest target for this decline could be around the 4000 level, near the lower boundary of the channel. However, if the price breaks through this support level, the bullish structure will be invalidated, and we may witness a continuation of the downtrend.
This setup reflects the potential for a pullback after a strong upward move, as indicated by the current market structure. If you agree with this analysis or have any additional insights, feel free to share your thoughts in the comments!
Breakout!
Gold Market: Waiting for the Necessary CorrectionHey everyone, Kilian here!
Right now, XAUUSD is at a crucial point. After a strong surge, the price of gold broke through the upper boundary of its channel, but it’s now pulling back. This correction could signal that the buying momentum is starting to fade, hinting at a potential shift in market direction.
If selling pressure increases, it’s likely that the price will test the middle, or even the lower boundary of the channel. This could indicate a deeper correction as the market consolidates before deciding its next move.
For now, we need to closely monitor the price action. If buyers can regain control and push the price back above the previous breakout level, it would be a strong confirmation that the uptrend is still intact. However, if the price continues to slide, we could be witnessing a short-term bearish phase.
I hope your trades are going well. Stay tuned and follow me for more updates and in-depth analysis!

EURUSD BEARISH BREAKOUT|SHORT|
✅EURUSD confirms a clean breakout below the key level, showing bearish continuation as price rejects premium pricing. Liquidity has been cleared above structure, and Smart Money targets the 1.1520 zone for rebalancing. Time Frame 6H.
SHORT🔥
✅Like and subscribe to never miss a new idea!✅

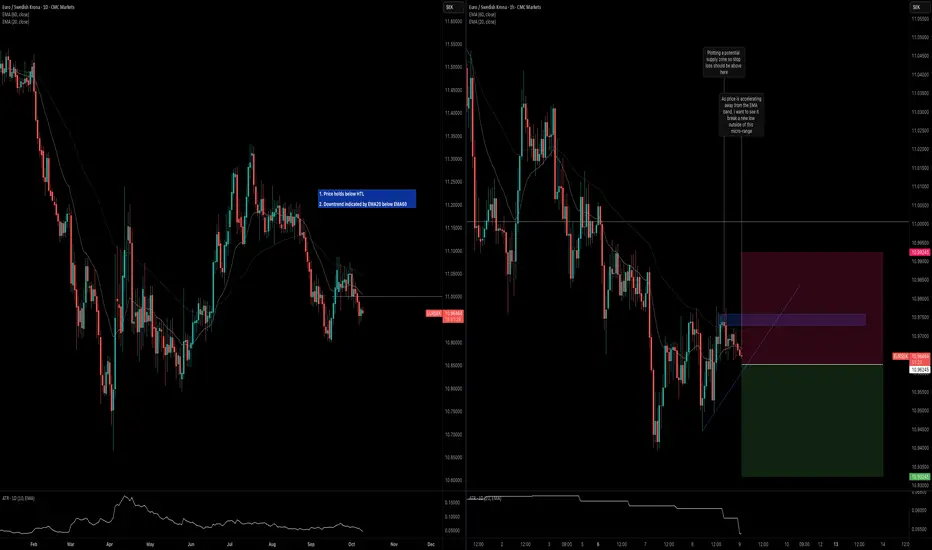
EURSEK: Trend ContinuationKey observations on the daily and H1 timeframes below.
Daily Timeframe:
Price is holding below HTL
Downtrend is indicated by EMA20 below EMA60
H1 Timeframe:
Price is accelerating away from EMA band
Sell stop set to enter when price breaks out of the micro-range
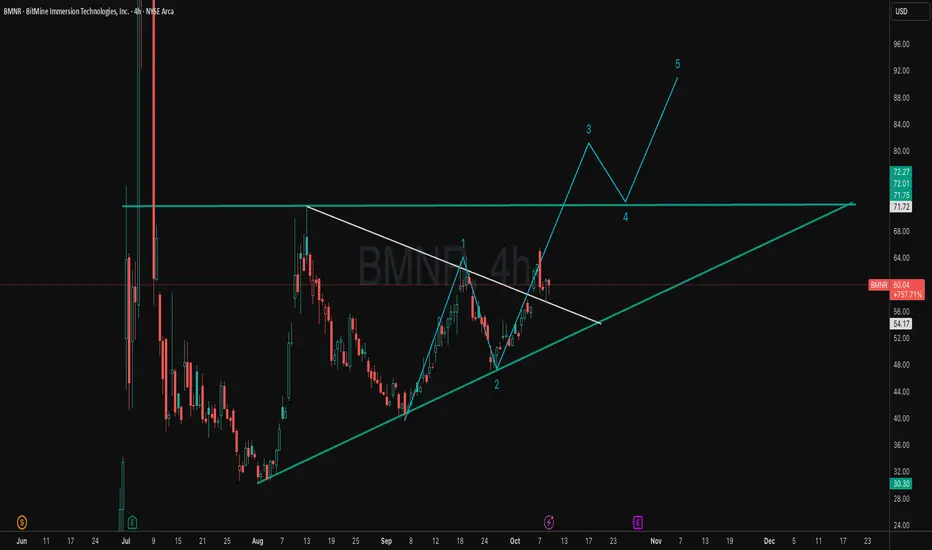
BMNR: Post-Compression Breakout Map (Wave 3 → 4 → 5)Price action is compressing against horizontal resistance while riding a rising base, suggesting a completed 1–2 and positioning for an impulsive wave 3 breakout, followed by a wave 4 retest and a measured wave 5 extension.
Confirmation comes on a decisive breakout and hold above the range high; a brief throwback into former resistance is acceptable if structure stays intact.
Invalidation sits on sustained closes back below the rising trend line or a clean breach of the wave‑2 pivot, which would imply the structure is morphing into a corrective pattern.
Execution plan favors scaling on confirmation, trimming into projected wave 3 strength, re‑loading on a controlled wave 4 pullback, and final distribution into wave 5 targets.
If momentum stalls or gaps fail to hold, reduce risk and reassess the count versus an ABC/flat alternative.
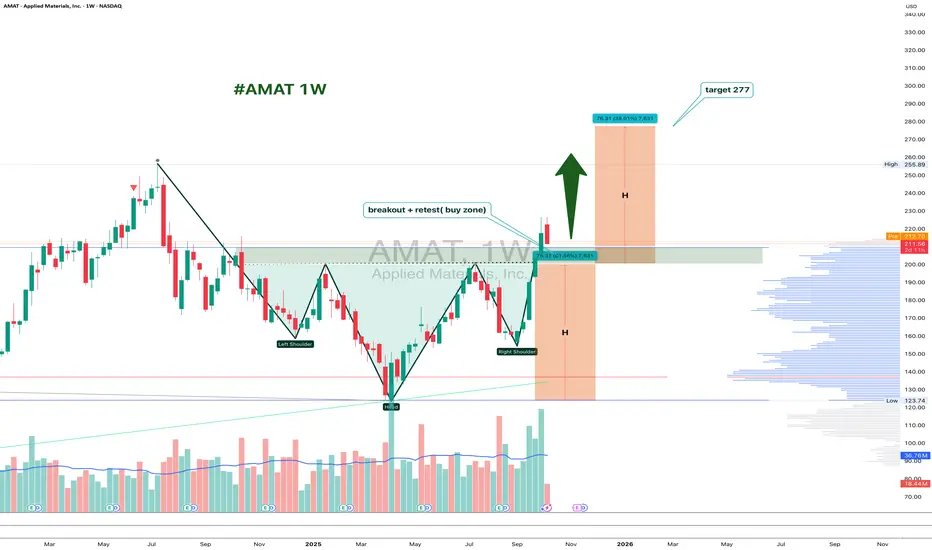
AMAT 1W: Retesting the Neckline Before the Next Move?On the weekly chart, Applied Materials (AMAT) has completed a clean inverted head and shoulders breakout around $226, and is now pulling back to retest the neckline zone near $200–211.
This area acts as strong support. If buyers defend it, the bullish pattern stays valid, with a projected target around $277, matching the 1.618 Fibonacci extension.
From a fundamental perspective, AMAT remains a key semiconductor player, benefiting from ongoing demand for chip-making equipment. The pullback looks more like a healthy pause than weakness - a classic chance for latecomers to re-enter.
Funny enough, the “head and shoulders” pattern, known for signaling tops, is doing the exact opposite here - apparently, even the market likes a good plot twist.
US30: Consecutive breakouts signal an emerging downtrend
SPREADEX:DJI – When price rejects the high, the market begins to shift
On the 30-minute chart, price action is clearly signaling a loss of bullish momentum and a transition toward a bearish structure.
________________________________________
🧠 Price Action Analysis
1. First Failed Breakout
Price initially broke above the ascending trendline that had held since early October — but failed to hold the breakout.
➤ A classic early warning of buyer exhaustion, often seen during distribution phases.
2. Multi-Layered Resistance Zone
The 46,725 – 46,779 region has become a clustered resistance zone, rejecting price repeatedly.
➤ Multiple rejections here suggest dominant selling pressure, with strong supply overhead.
3. Second False Breakout
A more subtle second breakout attempt followed — but again, price was swiftly rejected.
➤ Consecutive failed breakouts typically indicate a lack of conviction and precede sharp reversals.
________________________________________
📉 Trend Structure Has Shifted Bearish
• Lower highs and lower lows now visible
• Price broke below the previous trendline
• Pullback attempts failed to reclaim broken support
• Market is respecting resistance instead of support
➡ These are clear signs of a short-term downtrend emerging.
________________________________________
🔻 Trading Strategy: Favoring Sell Setups in the New Bearish Context
✴️ Scenario 1: Sell at Retest of Proven Resistance Zone
• Optimal Sell Zone: 46,700 – 46,750
• This area has already triggered two failed breakouts — a third touch could be the ideal trap for late buyers
• Watch for bearish rejection candles (pin bars, bearish engulfing, etc.)
Suggested Sell Limit Order:
→ Entry: 46,730
→ Stop Loss: 46,830 (above prior swing high)
→ TP1: 46,500
→ TP2: 46,300
→ Risk-Reward: At least 1:2
_______________________________________
✴️ Scenario 2: Momentum Sell on Breakdown of Local Support
• Trigger Level: 46,580 — if price breaks below with strong momentum (long red candle, increased volume)
• Confirms trend continuation after consolidation
Suggested Sell Breakout Order:
→ Entry: 46,580
→ Stop Loss: 46,680
→ Target: 46,350 – 46,200
→ Tip: Use smaller position size if breakout appears weak to avoid getting trapped in a fakeout
________________________________________
🎯 Trade Management
• Only enter trades with clear price rejection or momentum confirmation
• Move SL to breakeven after TP1 is hit to lock in safety
• Exit the trade if price closes above 46,830 — that would invalidate the bearish thesis
________________________________________
False breakouts leave a trail — for those who know how to read it. It's not a failure. It’s the market whispering that direction has changed.
Please like and comment below to support our traders. Your reactions will motivate us to do more analysis in the future 🙏✨
Harry Andrew @ ZuperView

EURAUD: DowntrendKey Observations
Daily Timeframe
EMA20 is slightly lower than EMA60 and price is below both to indicate weak downtrend
However, price is also holding below a daily HTL so buying pressure also remains weak or non-existent
H1 Timeframe
Price is exiting away from the EMA band and below both EMA20 and EMA60 to indicate high probability of downside momentum
If price crosses below the ATL, that's a further indication of downside momentum

Bullish Breakout – Monitor for follow-through Support: ₹500–₹570 (previous resistance)
Upside Targets: ₹650, ₹750
Stop-loss: Below ₹499

NZDUSD BEARISH BREAKOUT|SHORT|
✅NZDUSD breaks below the key level with strong bearish momentum, confirming a clean breakout setup. Price may retest the broken structure before continuing lower toward the 0.5790 target liquidity zone. Time Frame: 2H.
SHORT🔥
✅Like and subscribe to never miss a new idea!✅

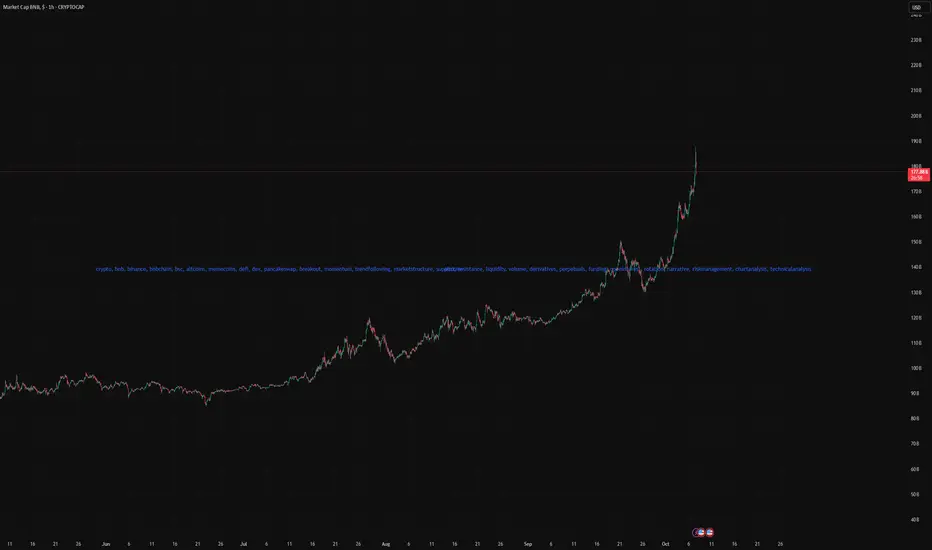
It's BNB SZ Real Flow. Perps >$100B, Memes ExplodingSummary
BNB just put in a vertical move on market cap and the BNB Chain narrative has flipped risk-on. Perp flow spiked, memecoin breadth exploded, and CEX/Wallet primitives are amplifying the loop. I’m positioning for continuation with a “buy dips / rotate to BNB Chain beta” plan, with clear invalidations.
What’s happening (from the provided charts)
Perp flow: Daily perp volume on BSC crossed ~$100B two days ago (screenshot from @BNBCHAIN). Liquidity + leverage are back, and that historically fuels multi-day trend moves.
Market cap structure: BNB market cap chart (1h) shows a clean breakout to ~$180B after a month of stair-step advances. Vertical extension suggests momentum, but also raises the odds of sharp pullbacks.
Breadth / heat: Multiple watchlists show BNB memecoins ripping (Palu, “4”, BINA, GIGGLE, etc.). You’ve got 100–200M MC runners across the board and “OKX Wallet Trending” screenshots with BNB-pairs at the top.
Distribution layer: Trust Wallet is actively pushing SOL→BNB swaps (giveaway post), which validates and accelerates the rotation flow.
Narrative lock-in: Multiple posts repeat “BNB Szn” with compounding social proof (CMC Boosts, DEXScreener Boosts/Ads on $SZN, “BNB > XRP/USDT market-cap rank #3” callouts). This is the reflexive feedback loop you want during the early innings of a chain season.
Thesis
BNB is entering a chain-season regime: high perp activity → higher spot liquidity → memecoin breadth → more attention → more perp activity. Until perp volumes cool and breadth narrows, continuation is the base case.
Levels & structure (using the market-cap chart)
Breakout area: ~$170–172B mcap (prior ceiling). First buy-the-dip zone if momentum cools.
Trend support: rising 1h/4h structure sits roughly mid-170s B. Lose this with heavy perp unwind = momentum broken.
Upside magnet: $200B psychological round number. Extension targets beyond that depend on breadth staying hot.
Rotations
Core beta: BNB spot/perp on dips to prior highs.
Chain beta: BNB memecoins with liquidity + CEX/Wallet visibility. Names in your screenshots (Palu, “4”, BINA, GIGGLE) are already in motion; stick to rule-based entries (liquidity > $1–3M, no stealth revokes, active socials).
Tools signal: “Trending” tabs (OKX Wallet, Dexscreener Boosts, CMC boosts) are acting like momentum filters this week—lean into them while the season is hot.
Catalysts to monitor
More DEXScreener/CMC boosts for BNB-pairs.
CEX wallet trending panels featuring BNB tokens.
Trust Wallet / Binance ecosystem promos (SOL→BNB incentives).
Bottom line
As long as perp flow stays elevated and breadth remains wide, trend-following + dip-buying BNB and rotating into liquid BNB-chain beta is the optimal stance. Lose trend support + perp dries up → exit to strength and wait for the next setup.
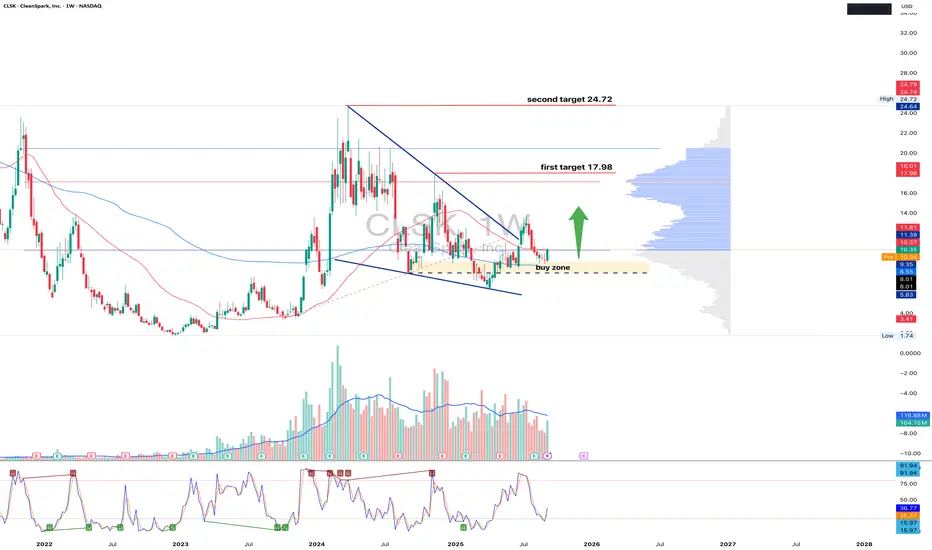
CLSK - accumulation before a breakout or a trap?CLSK price is consolidating in the 9.5–10.5 buy zone, which aligns with a key volume area. On the weekly chart, a breakout from the falling wedge is forming, and if bulls manage to hold above the current range, the next targets stand at 17.98 and 24.72. Volumes indicate institutional interest, while RSI at lower levels suggests a potential reversal.
Fundamentally , CLSK is strongly correlated with Bitcoin and the mining sector: declining hash rate among competitors and expectations of a softer Fed policy provide a supportive backdrop.
The tactical setup is straightforward: defending 9.5–10.5 opens the way toward 17.98 and 24.72, while a breakdown would shift the price lower.
For now, it looks like accumulation, but the real question is who will give up first - the bulls or the bears.
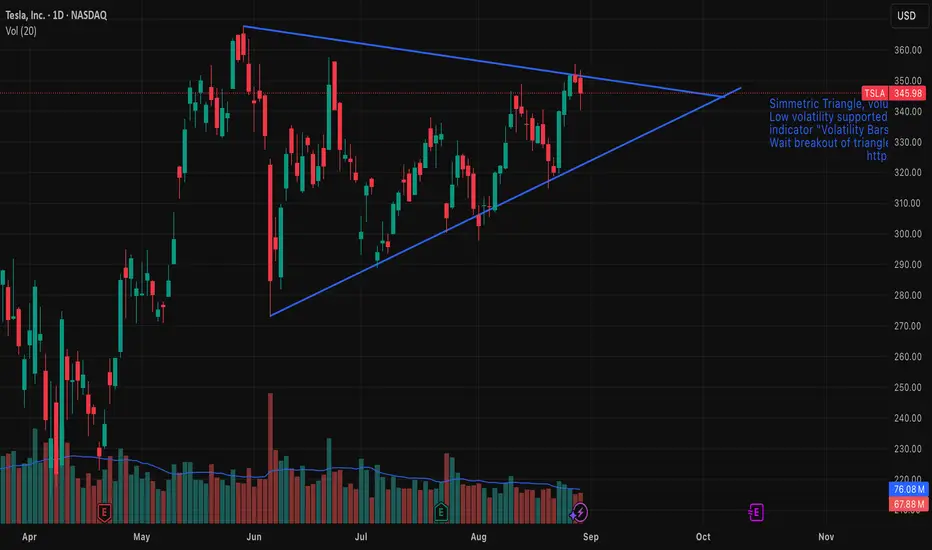
Tesla (TSLA) — Symmetrical Triangle Breakout IdeaSummary
Pattern: Symmetrical triangle on daily chart.
Expected timeframe for breakout: Within 1–2 weeks.
Targets: $367 on an upside breakout; $273 on a downside breakout.
Risk management: Use a stop-loss just outside the triangle after breakout confirmation; position size per your risk rules.
Setup & Rationale
A well-defined symmetrical triangle has formed on TSLA’s price action, characterized by converging trendlines connecting lower highs and higher lows. Volume has contracted inside the pattern, consistent with consolidation. Symmetrical triangles are neutral continuation/reversal patterns; the breakout direction provides the trading signal.
Key technical points:
Price is approaching the apex, increasing the likelihood of a decisive breakout in the next 1–2 weeks.
Volume decline during the consolidation and a volume spike on breakout would confirm conviction.
The breakout should be taken after a daily close beyond the upper or lower trendline (or after a retest), not merely intraday probes.
Entry Criteria
Upside trade: Enter long on a daily close above the upper trendline (or on a confirmed retest).
Downside trade: Enter short on a daily close below the lower trendline (or on a confirmed retest).
Targets & Measurement
Measure the pattern height (vertical distance between the initial high and low of the triangle) and project it from the breakout point.
Upside target (projected): $367.
Downside target (projected): $273.
Adjust targets proportionally if you use a measured move from the actual breakout point rather than the pattern’s maximum height.
Stops & Risk Management
Place stop-loss slightly outside the opposite trendline or beyond a recent swing point to avoid false breakouts.
Preferred approach: fixed-risk percent per trade (e.g., 1–2% of portfolio) and scale position size accordingly.
Consider tightening stops to breakeven after price clears ~50% of the distance to the target.
Confirmation: daily close beyond trendline plus above-average volume (up or down depending on direction).
Symmetrical triangles are neutral; false breakouts occur. Wait for confirmation.
News, earnings, or market-wide events can invalidate technical setups quickly—monitor catalysts.
Adjust targets/stops if volatility expands or if the breakout lacks volume confirmation.
$OPEN - OpenDoor Tech - $9.69 Retest - $10.87 PT🧠 Technical Overview
Ticker: NASDAQ:OPEN (Opendoor Technologies Inc.)
Timeframes: 15-min & 4-hour combo
Current Price: ~$9.30
Trend Summary:
Strong bounce from $8.10 base with two clean BOS (break of structure) signals.
Retested and held $9.19 intraday; momentum candle formed near close.
Channel projection (yellow) shows potential path toward $10.87 → $10.97 short-term.
Volume uptick confirms accumulation — buyers stepping back in.
Key supports: $8.43 / $8.10
Analysis Overview:
NASDAQ:OPEN (Opendoor) is back in motion!
After reclaiming $9.00 support and breaking its short-term structure, the chart shows a clean path toward $10.87–$11.00.
Volume confirms renewed buyer strength after weeks of consolidation near $8.
Watch $9.69 for breakout confirmation — trend remains bullish above $8.43.
#Opendoor #OPEN #NASDAQ #MomentumTrading #RealEstateTech #AIStocks #MyMIWallet

CROX BULLISH OCT 7 2025Crox is looking good here as price has a support from higher time frames. Price is also trying to narrow its range. I am long here . Do not blindly trade any thing
Always manage your risk & then trade

AUDUSD: Trend ContinuationKey Observations
Daily Timeframe:
EMA20 remains above EMA60 > uptrend indication
Price holds above HTL > no strong downside momentum
H1 Timeframe:
Price crossed above DTL and holds
Price pulled back to DTL and held above it
Price also exited EMA band with momentum strength

$RR - Richtech Robotics - $7.25 RetestNASDAQ:RR (Richtech Robotics) continues its breakout trend, now holding above $6.50 after reclaiming key $5.70 support.
Momentum volume is accelerating as automation and AI robotics names heat up again.
Channel projections show room toward $7.25–$7.60 in the near term if bulls hold trend support.
#RichtechRobotics #RR #AIStocks #Automation #NASDAQ #MomentumTrading #MyMIWallet

$DVLT - #DataVault #AI - $2.68 PTNASDAQ:DVLT has officially broken out above $2.00 after multiple retests of the $1.10–$1.40 range last week. Momentum remains strong following its IBM partnership news, and price action is respecting an ascending channel projecting toward $2.50–$2.80.
A clean hold above $1.74 could confirm continuation — eyes on the next leg up.
#DatavaultAI #DVLT #AI #AIStocks #MomentumTrading #NASDAQ #StockMarket

EURSEK: Trend ContinuationKey Observations
Daily Timeframe:
Price breaks HTL and shows downtrend confluence with EMAs
EMA20 is also expanding away from EMA60 to indicate the downtrend continuation
H1 Timeframe:
Swinging this downtrend as intraday upside is exhausted
Price is also showing confluence with EMA20 and EMA60

BTCUSD Setup You Can’t MissHey everyone, Kilian here!
The Bitcoin market keeps showing positive signals as the uptrend holds steady. On the technical chart, a double bottom pattern is gradually taking shape, with the first low followed by a higher low, a clear sign that buying pressure is building. At the moment, price is trading just above the neckline, a critical level that many analysts see as the key decision point for the next move.
If price holds above the neckline and confirms the breakout, the bullish scenario aiming toward 124,625 becomes stronger. But if the market slips back below this level, it could signal buyer weakness and raise the risk of a reversal.
As always, traders should wait for clear confirmation before entering, and stick to strict risk management rules in this volatile environment.
Trade safe and stay disciplined.

ETHEREUM BULLISH BREAKOUT|LONG|
✅ETHUSD shows a clean breakout above the key level as ICT traders anticipate continuation toward the next liquidity pool near 4,760$. Price may retest the breakout zone before pushing higher. Time Frame 2H.Setup Risk: High!
LONG🚀
✅Like and subscribe to never miss a new idea!✅

USDCAD: H1 ConfluenceKey Observations
Daily Timeframe:
On Friday's close last week, price held above the daily level
This week's open indicate price is likely held supported
H1 Timeframe:
There's confluence on the H1 timeframe where price is crossing above the DTL
Price is also moving away from the EMA band, which indicates momentum could be picking up here

06/10/25 Weekly OutlookLast weeks high: $125,735.08
Last weeks low: $111,559.20
Midpoint: $118,6547.14
New All Time High for Bitcoin in the first week of "Uptober", really impressive strength since flipping $117,500.
BTC still finds itself within a range between ATH and $108,000 but with such strength on the bounce from range lows, could we see price discovery going into the last leg of the year?
From a macro perspective month/quarter end is now over and done with, banks have completed their window dressing/de-risking and we can expect liquidity to flow back into the risk markets. Rate cut cycle continues, M2 Global money supply at ATH with seemingly no plans to stop in the near future.
For now I am still treating trading BTC as it is in a range until we get price acceptance above $125,000. If there is a breakout above and a rally altcoins should follow. In terms of news releases this week because of the US Government shutdown there is a disruption on data releases but overall nothing of great importance is disrupted.
Good luck this week everybody!
