GBPUSD Short Position (4Hr Timeframe)• Monthly- MACD bullish crossover
• Weekly – MACD signalling bearish move as crossover approaching
• Daily – broken out of rising trend with further bearish move due to last week fundamentals
- MACD about to cross signalling bearish move
• 4 Hour- will wait for retracement/pull back before taking position
• Hourly- MACD signalling possible retracement/pullback which could produce a good breakout opportunity
Breakout-pullback

USDCHF Long Position (4hr Timeframe)• Monthly- breakout from bullish trend
• Weekly- MACD about to cross and bullish engulfing candle signal bullish bias this week
• Daily- Trend has crossed over 21 MA and both MA about to cross
• 4 hour- potential pull back in area of resistance will look for breakout before going long
• Hourly – MACD signalling bearish move which could be just the pullback will look to take position once pullback is broken
• Verdict: Long bias which I will take few hours into market opening only if pull back is broken in bullish move
• Fundamentals: Fundamentals: US economic data e.g. CPI

NZDUSD Short Position (1Hr Timeframe)• Weekly- bearish engulfing candle which could see bearish week
- Worth noting MA cross over in weekly
• Daily- breakout from rising wedge however potentially see a potential ABCD pattern formation
- MACD crossover signalling bearish move
• 4 Hour- missed short opportunity due to NFP however looking to short pullback however be wary of both spinning tops so best to wait for market opening to see how pair moves
• Hourly – MA about to crossover and will look to short once pullback is broken
• Verdict – will look to short once pullback is broken. This a particularly a shorter term trade so not considering this weeks fundamentals

EURUSD Short Position• Monthly- bullish movement towards resistance of channel & weekly resistance
• Weekly- rising wedge & shooting star candle stick could signal bearish week
• Daily – bearish engulfing 3 candles at resistance of rising wedge
- Potential crossover in MACD signalling bearish move
• 4 hour – trend has crossed 21 MA and there’s cross over in MACD
• Hourly – pullback which has produced good sell opportunity however MACD signals bullish move
- MA crossover signalling bearish move
• Verdict: will look to sell once broken hourly trend and set TP at 1.16610 TP with 2:1 risk/rewards
• Fundamentals: US economic data e.g. CPI

HighProbable Trendtrade 2:1 RRR The same set up is given on the Eurodollar but the Eurosterling provides a much better RRR

As announced earlier... Entry opportunity cameThos who would like to play the Long side of AUD/USD may find an entry at this key support zone

Sell on potential pullback into resistanceMid term and short term sellers can look for shorting opportunities on pullbacks into 0.9860...


EURAUDprice broke the lower boundary of the triangle, waiting for a signal on a pullback to the
resistance


EURJPYAt D1 price is near the support zone of consolidation, at H1 there is consolidation. Sell at breakout pullback.


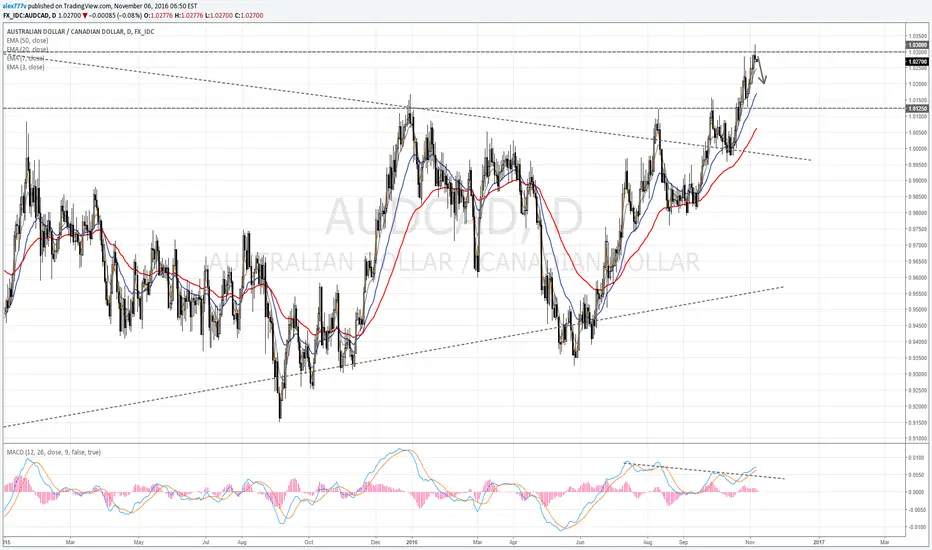
AUDCAD - Huge Divergence - Trendline BreakoutAs you can see in the chart, there has been a breakout upwards, wait for a pullback and then, based on your strategy for this kind of setups, buy.
The idea is also supported for a huge divergence.


AUD/CAD nice short opportunity Good morning traders, good short opportunity on this pair. MACD bearish divergence on 4H and 1H charts, price deceleration at 1.0300 resistance.
I'm going to trade this on a shorter time frame than daily to be sure to be out of it before elections day.
Good luck and trade with care!
EURCAD Long: Buy The Next ImpulseThere has been a short bullish impulse out of the predicted reversal zone, indicating the potential for a completed wave (c) of the correction. This setup allows for a very tight stop behind the base of the impulse. Any drop below this level will require re-evaluation. The target is set at AB=CD but may change depending on price action. If we see a strong swift impulse I may move it higher, and if the correction seems to be continuing sideways I will either take profit at market or move the TP level down toward a potential triangle boundary. Will update as the tide rolls.

GBP/AUD Short SetupGBP/AUD couldn't break the strong resistance at 1.78 and broke to the downside. Now I'll wait for a pullback and a breakout to enter my short Position.
Always follow your Plan, Daniel

GBP/USD Descending Triangle Sell SetupGBP/USD is moving within a descending Triangle. This Pair broke an ascending Trendline to the bottom and formed a little pullback. I expect another move to the upside (the Trendline) and then a breakout to the bottom. I'll enter a short Position after the breakout. Scenario 2 is a break to the upside, out of the descending Triangle which cancels the short setup and offers the opportunity to enter long positions.
Trade safe, Daniel
Likes and comments are appreciated and would keep me motivated

EUR/USD Buy Set Up @ 1.11 PullbackA buy set up is now in motion. Once price pulls back towards 1.11 and selling becomes exhausted price is then likely to begin rising towards the previous highs around 1.14.
I am seeking a buy entry on a 4HR candle around the 1.11 once price action presents a signal candle.

CADJPY LONGTRADE TRIGGERED ENTRY ON FRIDAY........LOOKING FOR A BREAK OF TREND, NEW HIGH & CONTINUATION......
