WCT Breakout Confirmed – Ready for Lift-Off?🚀 WCT Breakout Alert – 80% Potential Incoming?! 👀🔥
Hey Traders! If you're all about high-conviction plays and real alpha, smash that 👍 and tap Follow for more setups that actually deliver! 💹💯
WCT has finally broken out of its long-standing symmetrical triangle on the 4H timeframe 🔥. After weeks of consolidation, we’re seeing a fresh move building up, hinting at strong momentum ahead.
🔎 Chart Insights:
✅ Breakout above resistance zone ✔️
📈 Retest happening around the breakout zone ✔️
📊 Previous pump: 81% surge! Will history repeat?
Trade Idea:
Entry: Current Market Price (CMP) and add more in dip
Targets: $0.44/$0.48 / $0.56 / $0.68 🎯
Stop Loss: $0.35 🚨
Lev: Use low leverage (Max 5x)
The chart looks clean with solid structure—keep an eye as this can build up for a big move 💥.
💬 What’s your take? Drop your analysis or ride along with this setup!
Breakout

Breakout in Dave Inc...Chart is self explanatory. Levels of breakout, possible up-moves (where stock may find resistances) and support (close below which, setup will be invalidated) are clearly defined.
Disclaimer: This is for demonstration and educational purpose only. This is not buying or selling recommendations. Please consult your financial advisor before taking any trade.

Breakout Confirmed: XRP on the Move Toward $4+🚀 XRP Breakout Alert – 70% Potential Incoming?! 👀🔥
Hey Traders! If you're all about high-conviction plays and real alpha, smash that 👍 and tap Follow for more setups that actually deliver! 💹💯
📈 XRP/USDT – Breakout Alert! 🚀
XRP is breaking out from a long-term falling wedge pattern on the 12H timeframe, signaling the potential for a strong bullish move ahead!
🔹 Entry: CMP $2.39 – Add more up to $2.32
🔹 Targets:
• TP1: $2.85
• TP2: $3.32
• TP3: $3.78
• TP4: $4.13
🔻 Stop-Loss: $2.09
⚙️ Leverage: Up to 5x (Trade responsibly)
This structure mirrors the previous 70%+ pump from the same wedge formation. History might just be ready to repeat. 👀
Let’s ride this breakout with tight risk management! 💥

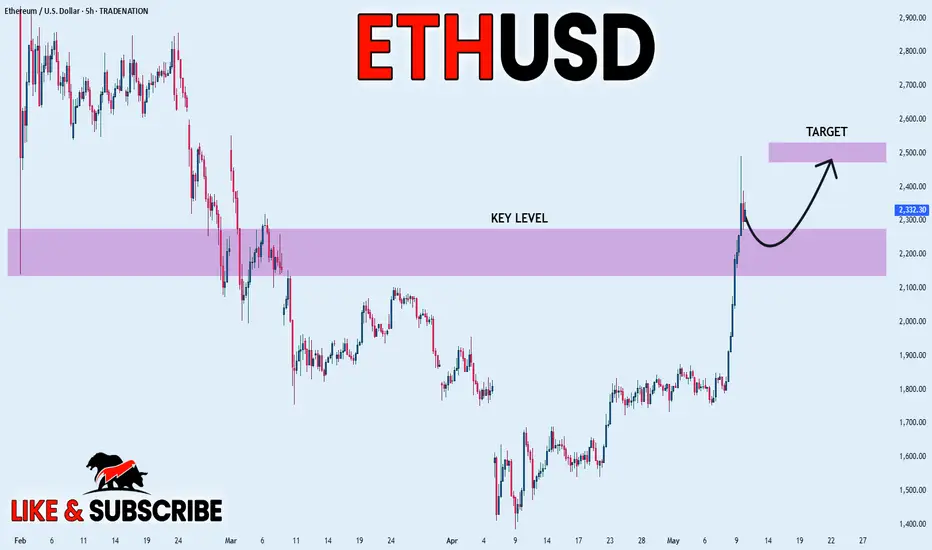
ETHEREUM BULLISH BREAKOUT|LONG|
✅ETHEREUM is growing finally
And the coin broke a key horizontal
Level of 2,200$ and the breakout
Is confirmed so we are bullish biased
And we will be expecting a
Further bullish move up
LONG🚀
✅Like and subscribe to never miss a new idea!✅
Disclosure: I am part of Trade Nation's Influencer program and receive a monthly fee for using their TradingView charts in my analysis.
Ethereum waking up?One of the most disappointing projects in the crypto space in recent years has to be ETH, losing ground on BTC since September '22. Finally ETH looks to have woken up outpacing BTC this week and broken out from the daily downtrend channel and currently at the underside of the DAILY 200 EMA.
BTC.D has printed a SFP and dropped 2% from 65.4% to 63%, could we be seeing a rollover and rotation into altcoins?
How I see it the moving average should cap off this move for now and a retrace towards the breakout area & previous lower high. That would then be the first higher high and higher low of this calendar year, a very bullish change in structure.
A more aggressive bullish scenario in the short term would be a reclaim of the 1D 200 EMA, leaving the inefficiency zone at the breakout level unfilled.
Either way the next HTF target is $2,800 for ETH which would bring price to the range midpoint and a key supply zone with many resting Stop losses.

Gold will continue to grow and exit from pennantHello traders, I want share with you my opinion about Gold. After looking at this chart, we can see how the price of Gold has been developing inside an upward pennant, formed after a powerful impulse from the buyer zone. This earlier move created a strong bullish foundation, supported by consistent reactions from the support area, which has since become a key defensive level. After the breakout from the upper boundary of the previous ascending channel, the price entered a phase of consolidation. However, rather than fading, the price action has remained tightly squeezed between the support line and the resistance trendline, creating the structure of a classic pennant. This pattern usually signals continuation, especially when supported by strong preceding momentum, which is exactly what we’re seeing here. Currently, the price is hovering around the support line of the pennant and has already shown signs of bouncing back up. If this rebound continues, the next logical move is a breakout through the resistance line of the pennant, with the 3450 level as a target. It aligns perfectly with the upper boundary and represents a strong technical TP1. Please share this idea with your friends and click Boost 🚀

PIXEL Breakout Alert: Ready for the Next Leg Up?🚀 PIXEL Breakout Alert – 100% Potential Incoming?! 👀🔥
Hey Traders! If you're all about high-conviction plays and real alpha, smash that 👍 and tap Follow for more setups that actually deliver! 💹💯
PIXEL has broken out from a bull flag on the 4H timeframe after consolidating for weeks. This clean breakout signals a potential trend reversal with strong upside momentum building. 💥
Trade Setup:
👉 Entry: $0.0380–$0.0400 (post-breakout zone)
🎯 Targets:
$0.0455
$0.0520
$0.0630
$0.0770
🛡 Stop-loss: $0.0360 (below channel re-entry)
Why I Like It:
Clear breakout of the falling channel
Strong volume surge confirms momentum
Previous 100% move shows solid potential
If BTC stays stable, this one looks set for a strong run! 🚀 Keep it on your radar.

ENS ANALYSIS📊 #ENS Analysis
✅There is a formation of Falling Wedge Pattern on 12 hr chart and currently trading around its major support zone🧐
Pattern signals potential bullish movement incoming after the breakout of resistance 1
👀Current Price: $22.58
🚀 Target Price: $31.29
⚡️What to do ?
👀Keep an eye on #ENS price action and volume. We can trade according to the chart and make some profits⚡️⚡️
#ENS #Cryptocurrency #TechnicalAnalysis #DYOR

AXL/USDT – Falling Wedge Breakout! Time to Ride the Wave!!🚀 AXL Breakout Alert – 100% Potential Incoming?! 👀🔥
Hey Traders! If you're all about high-conviction plays and real alpha, smash that 👍 and tap Follow for more setups that actually deliver! 💹💯
AXL has broken out of its long-term falling wedge pattern on the daily timeframe—this is a strong reversal signal and could set the stage for a big move ahead! 🔥
🟢 Entry Zone:
CMP (Current Market Price)
Add more up to: $0.38
🎯 Targets:
🎯 TP1: $0.515
🎯 TP2: $0.634
🎯 TP3: $0.751
🎯 TP4: $1.007+
🛡️ Stop Loss: $0.325 (below wedge support)
💡 Insight:
This breakout is aligning with the overall bullish momentum we're seeing in the altcoin market. Watch for a healthy retest of the breakout zone to confirm strength. 🚀
📊 Risk Management Tip: Start taking partial profits at each target and trail your SL to lock in gains.
Let’s ride this breakout smartly! 🔥

TWT ANALYSIS🚀#TWT Analysis :
🔮As we can see in the chart of #TWT that there is a formation of "Falling Wedge Pattern". Some time ago the same structure was made and it performed well and this time also the same is happening with a perfect breakout
🔰Current Price: $0.8464
🎯 Target Price: $1.0865
⚡️What to do ?
👀Keep an eye on #TWT price action. We can trade according to the chart and make some profits⚡️⚡️
#TWT #Cryptocurrency #TechnicalAnalysis #DYOR

PNUT/USDT: FALLING WEDGE BREAKOUT ALERT!!🚀 PNUT Breakout Alert – 100%+ Potential Incoming?! 👀🔥
Hey Traders! If you're all about high-conviction plays and real alpha, smash that 👍 and tap Follow for more setups that actually deliver! 💹💯
PNUT has officially broken out of a falling wedge structure — a bullish reversal pattern we've been eyeing for weeks! After weeks of consolidation and pressure along the wedge resistance, the price has now made a clean breakout with increasing volume.
🔹 Last time it broke out from this zone, we witnessed a massive 109% move.
🔹 Currently, it’s showing a similar breakout structure with room for a big upside move.
🔵 Entry Zone: $0.158–$0.162
🎯 Targets:
• Target 1: $0.21
• Target 2: $0.27
• Target 3: $0.31+
🛑 Stop-loss: $0.142
📊 Leverage: 3x–5x (low to moderate risk)
⚠️ As always, manage your risk and don’t chase pumps. Setup looks strong as long as the breakout holds and we don’t see a fakeout candle back inside the wedge.
📍Let me know what you think — will PNUT fly again?

BITCOIN - Important Breakout (BoS)Hello Traders !
On Monday 5 May, The BTC reached the support level (92800 - 93500).
The price broke the higher high (Break of Structure).
So, I expect a new bullish move🚀
_______________
TARGET: 104000🎯

$GRAB Long Term Trade IdeaTaxi and delivery service stocks all look bullish at the moment. Lyft and Grab are both a couple of my favorite longer term swing trade/investment plays just based off risk/reward and how beaten down both the stocks are.
If shown patience this trade could work wonders. I like it a lot because it gets me a little exposure to assets outside the U.S. and from a chart perspective its hard not to love a setup like this.
1. The buy side volume shown here is the highest its ever been for the stock by a long shot.
2. Price has been in a descending wedge type formation for several months now and is attempting to make a breakout, though this month's candle still has a lot of time left.
3. That hammer candle, especially considering it being printed on the 1M timeframe, is incredibly bullish in my eyes.
This chart reminds me a lot of NYSE:BABA but a bit earlier in its breakout stages. To me it is clear that accumulation has been taking place for over 2 years now and a big markup is upon us.
I have 3 take profit areas marked based off a few different Fibonacci levels I like that also have confluence with supply/demand dynamics present on the chart.
multiple daily/weekly candles below $4 could be a a good stop loss area as that would invalidate a lot of the bullish structure. Based off the current price this provides you with a minimum 2.75x RR trade and a maximum of 7x RR.
My average price is $4.25. Any pullbacks below $4.50 I will be looking at as great buying opportunities.
Will do my best to update this idea periodically over the next year or so.

SUI ANALYSIS📊 #SUI Analysis
✅There is a formation of Descending Channel Pattern in daily time frame in #SUI .
Also there is a perfect breakout and retest. Now we can expect a bullish move. If the price successful retest the major support zone then we will see more bullish move
👀Current Price: $3.89
🎯 Target Price : $4.25
⚡️What to do ?
👀Keep an eye on #SUI price action and volume. We can trade according to the chart and make some profits⚡️⚡️
#SUI #Cryptocurrency #Breakout #TechnicalAnalysis #DYOR

USDCAD - BULLISH MOVEHello Traders !
The USDCAD price formed a descending triangle.
Currently, The Resistance line is broken !
So, I expect a bullish move🚀
______________
TARGET: 1.39260🎯

HOOD daily chart: breakout or fakeout? Key zone approaching.Robinhood's stock has formed a falling wedge pattern on the daily chart, indicating a potential bullish reversal. The price has broken above the 0.618 Fibonacci level at $44.00, suggesting further upside potential. Next targets are $48.40, $52.79, $58.22, and $67.00. RSI and MACD indicators confirm bullish momentum.
Fundamental Factors:
Robinhood continues to show revenue and profit growth, supporting positive investor sentiment. The company is expanding its services and attracting new users, strengthening its market position.
Scenarios:
Main scenario: continued rise to $48.40, then to $52.79 and higher.
Alternative scenario: pullback to $39.71 with potential decline to $36.00.

BANK / USDT Long Trade Setup – Big Breakout Watch!🚀 BANK Breakout Alert – 100%+ Potential Incoming?! 👀🔥
Hey Traders! If you're all about high-conviction plays and real alpha, smash that 👍 and tap Follow for more setups that actually deliver! 💹💯
BSE:BANK has broken out of a massive symmetrical triangle on the 1H chart — signaling a potential continuation move after a long consolidation! ⚡📈
📌 Entry Zone: $0.0372 – $0.0390 (current breakout area)
🎯 Targets:
• Target 1 → $0.0450
• Target 2 → $0.0520
• Target 3 → $0.0600
Target 4 → $0.0720
Target 5 → $0.0820
🛡 Stop Loss (SL): $0.0350 (below breakout support)
🔑 Why this setup matters:
✅ Clean breakout after long consolidation
✅ Strong bullish volume on breakout
✅ Previous breakout gave +114% move!
⚠️ Always manage your risk — breakouts can retest!
💬 What’s your target on BSE:BANK ? Drop your thoughts below! 👇👇👇

POPCAT Breakout Alert – Fresh Rally Incoming?🚀 POPCAT Breakout Alert – 60% Potential Incoming?! 👀🔥
Hey Traders! If you're all about high-conviction plays and real alpha, smash that 👍 and tap Follow for more setups that actually deliver! 💹💯
POPCAT has just broken out cleanly from its ascending triangle pattern on the 4H timeframe 🔥. This follows a strong consolidation phase after its last explosive move of 61% gains—and it’s looking primed for a fresh leg up! 📈
Key Levels:
💥 Entry: $0.416 and add more in dip
🎯 Targets:
1️⃣ $0.48
2️⃣ $0.55
3️⃣ $0.61+
🛡 Stop-loss: Below $0.378
Why I Like This Setup:
✅ Clear breakout from a textbook pattern
✅ Strong volume pickup
✅ Previous breakout history shows solid momentum
Keep your eyes on this one 👀—momentum could build fast! Let’s ride the trend 🚀

Euro will exit from pennant and grow to resistance levelHello traders, I want share with you my opinion about Euro. Looking at this chart, we can see how the price, after a strong upward impulse, the price entered into a consolidation phase, forming a classic upward pennant pattern. Throughout this structure, the price repeatedly respected both the support line and resistance line, tightening inside the pennant while still holding above the support level at 1.1300. This zone, between 1.1280 and 1.1300, marked as the buyer zone, has acted as a strong floor multiple times. Every touch to this area sparked bullish reactions, and most recently, we can see the rice once again starting to grow after dipping into this zone. On the upper side, the resistance level at 1.1430 coincides with the breakout target of the pennant, and also lies just below the seller zone, making it a logical TP 1 area for bulls. The current price action suggests that after a minor pull-back, the price may test the lower pennant edge and then rebound, potentially initiating an impulsive breakout toward 1.1430. Given this structure and the strong base forming around 1.1300, I expect Euro will grow upward toward my TP 1 at the 1.1430 level, thereby exiting from the pennant. Please share this idea with your friends and click Boost 🚀

Morning Star To Wake GU TradersFX:GBPUSD has fallen into a Wedge Pattern after breaking Mondays Highs!
Price this morning has seemingly found Support at the 50% Retracement level signaling the potential ending of the Consolidation phase of the Wedge!
This Retracement comes in the form of a Morning Star, a strong Triple Candle Reversal Pattern!
If Price is supported in this area, we could see a Bullish Break to this Pattern delivering a Long Opportunities as a Break and Retest Set-up!

Equity Research - TATA MOTORS LTD 📈 Buy Zone: ₹670.50 – ₹680.30
🎯 Target: ₹740.00
🛑 Stop Loss: ₹641.70
💹 CMP: ₹680.30
Technical Highlights:
✅ Bullish volume spike
✅ RSI above 60 – strong momentum
✅ Price above 20EMA & 50EMA
✅ Breakout and retest on 15m & 1H chart
✅ Good risk-reward setup
📊 Strategy: Wait for confirmation candle on 15min TF above ₹681 for entry.
📉 Stop loss below recent swing low at ₹641.70.
For Education Purposes Only

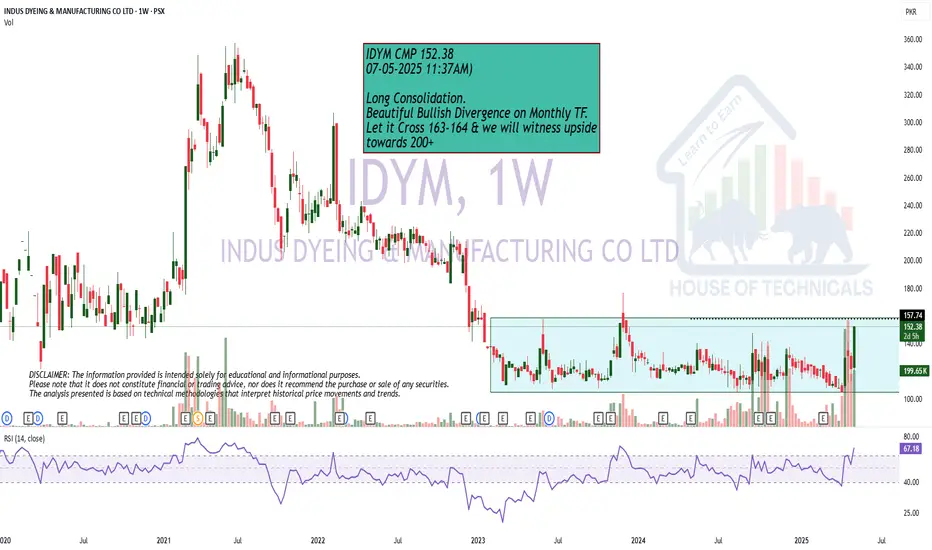
Near BreakoutLong Consolidation.
Beautiful Bullish Divergence on Monthly TF.
Let it Cross 163-164 & we will witness upside
towards 200+
Trade Setup Alert : BNB Levels to Watch 👀 Welcome to my Trading View Analysis and Trading Channel Here , we share the latest market analysis, trading signals, and key insights together .
Ready for smarter trades ? ⭐️
📊 BNB Technical Analysis – Key Zone in Focus for the Next Move
The BNB coin recently broke above the critical $584 resistance level and has successfully consolidated above it. This marks the second time the price has touched this zone, and in response, a strong bullish candle has formed — indicating a clear respect for this important area.
📍 Key Levels & Potential Trade Setups
Currently, the $584–$618 range acts as a decision zone, and price action here will likely determine the next major move.
🟢 If the price breaks above $618:
✅ A long position trigger is confirmed
🎯 Bullish targets:
First target: $732
Second target: $793
🔴 If the price drops below $584:
✅ A short position trigger is activated
🎯 Bearish target: $531
🧠 Additional Insights:
The 3 SMA indicator is currently positioned above the consolidation zone, potentially acting as dynamic resistance.
This area holds strategic importance for the Binance Smart Chain (BSC) ecosystem, making price behavior here highly significant.
⚠️ Final Notes:
We are at a crucial inflection point in the market. So:
Watch candlestick behavior closely
Maintain proper risk management
Wait for clear breakout confirmation before entering any trade
I love you all so much . 👀
don't forget about capital management and risk management .
Be careful with your positions . 🥇
