BITCOIN PREDICTION: HERE IS WHERE THE CRASH WILL STOP!!! (deep) Yello Paradisers! In this video, I'm sharing with you an Ultra High Time Frame: the double-top shooting star candlestick pattern formation plus bearish divergence, plus that we are trying to break below our channel.
On a high timeframe chart, I'm sharing with you the ABC zigzag, explaining that right now we are in the C wave, which is a motive mode wave. That means five waves to the upside, and with the highest probability, right now we are in the secondary wave that on its primary waves is creating a zigzag formation.
The 0.786 Fibonacci retracement level needs to hold, and the channel can't be reclaimed. I'm sharing with you the kind of confirmations for both short and long positions we are waiting for with the ParadiseTeam.
On a medium timeframe, we are seeing the first bullish signs and a bullish divergence, where we need to wait for confirmations before taking action. We are also looking at the Fibonacci support that is supporting the finishing of Wave 2.
On the low timeframe chart, we are analyzing the higher degree secondary wave, which is a zigzag. A and C waves are motive mode waves, so we are waiting for the completion of the five-moonstone downside inside of the C wave. This might perfectly confluence with the 0.618 Fibonacci's extension of Wave A, which is usually where the C Wave ends.
Paradisers! Keep in mind to trade only with a proper professional trading strategy. Wait for confirmations. Play with tactics. This is the only way you can be long-term profitable.
Remember, don’t trade without confirmations. Wait for them before creating a trade. Be disciplined, patient, and emotionally controlled. Only trade the highest probability setups with the greatest risk to reward ratio. This will ensure that you become a long-term profitable professional trader.
Don't be a gambler. Don't try to get rich quick. Make sure that your trading is professionally based on proper strategies and trade tactics.
Btc!

BITCOIN PREDICTION: BIGGER CRASH INCOMING!?? (warning) Yello Paradisers! In today's video, I'm revealing the truth to you. I'm sharing the Ultrahigh timeframe chart, which includes the shooting star double top formation, plus bearish divergence and the channel. And I'm revealing the Elliot wave theory on the Ultrahigh timeframe.
On the high timeframe chart, I'm revealing to you the ABC zigzag and the possibility that we have already concluded the five moves to the upside. I'm sharing with you the bearish divergence and the confirmation that is needed, and what needs to happen for us to go down to $108,000.
On a medium timeframe, we are seeing the triangle reclaim on low volume, but we are also checking the bullish divergence where we are waiting for confirmation. If the Elliott Wave breaks below $112,000, we will go lower toward $108,000. Then, the structure from an Elliott Wave perspective is going to turn bearish, and we will be treating the market as bearish and looking for short opportunities. But if you are able to reclaim it, we are looking for buying opportunities if you are able to defend the low. I'm sharing with you what kind of confirmations I'm waiting for so you can tactically also approach the market.
On the low timeframe chart, we are concluding the wave structure and waiting for its next move.
Paradisers! Keep in mind to trade only with a proper professional trading strategy. Wait for confirmations. Play with tactics. This is the only way you can be long-term profitable.
Remember, don’t trade without confirmations. Wait for them before creating a trade. Be disciplined, patient, and emotionally controlled. Only trade the highest probability setups with the greatest risk to reward ratio. This will ensure that you become a long-term profitable professional trader.
Don't be a gambler. Don't try to get rich quick. Make sure that your trading is professionally based on proper strategies and trade tactics.

Bitcoin, Quick Update · Is The Retrace Over?We are looking at Bitcoin and we are tracking Bitcoin's movements but we trade mainly the altcoins. How Bitcoin behaves affects the altcoins market and how the altcoins market behaves reveals what Bitcoin intends to do next. The chart reveals what is happening and what is about to happen.
Bitcoin produced a low of $112,000 2-August. Today Bitcoin produced a low of $112,353. If $112,000 holds as support or remains unchallenged, we can have an early end to the present retrace. Several things to consider:
1) Trading volume is low and this can be considered good. It can happen that the retrace ends or the final flush is still upon us. In both scenarios everything unravels within the next few days. No more than a week.
2) Trading volume was really high on the bearish side late July but so far there is no follow through.
3) Seeing six days red yet only a small retrace is a positive signal. Again, it can happen that the final flush happens today and the market turns. Something to keep in mind; when a flash crash happens, we tend to think of this as the start of a major down-move but normally this is the end. It can happen that Bitcoin moves lower and that's it, it starts to grow again.
4) Seeing how the market lacks bearish pressure—and also how the small altcoins are performing—we are going with the bulls.
5) As long as Bitcoin trades above $110,000, we are bullish long-term. Above $112,000, ultra-bullish including the short-term. When Bitcoin is trading above $100,000, the bullish bias is confirmed. It doesn't matter how you slice it, the bulls have control of this chart. The trading price is the most important data point and right now Bitcoin's price is really strong.
If $112,000 holds, expect Bitcoin to grow.
Namaste.

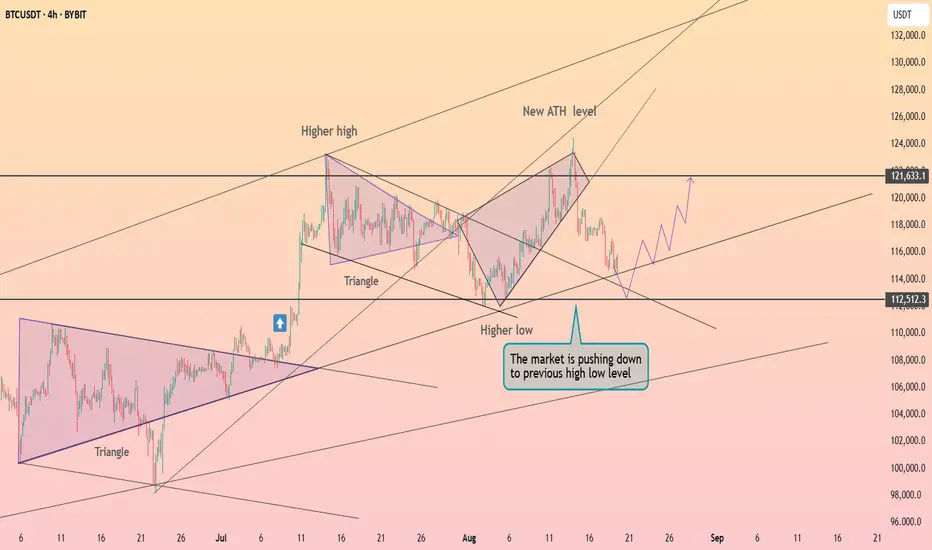
Bitcoin reached the support line ┆ HolderStatBINANCE:BTCUSDT reached a new ATH and is now consolidating with a retest of $112,500 support. As long as this level holds, a rebound toward $121,600 and higher remains likely. Breakdown risks correction to $108,000.
NASDAQ (CASH100) – Buy the Dip or Trend ReversalThe Cash100 has been trending in an upward channel since May 2025.
Today, price has broken through diagonal support.
For confirmation that the upward channel is over, I will be looking for these signals:
✅ First signal: a 4H close below diagonal support.
✅ Second signal: a retest of the diagonal. If price fails to reclaim,
I’ll start looking for short setups if both signals above confirm.
What do you think — is the uptrend finally breaking, or will buyers step back in? 👀
Thanks for checking out my post! Make sure to follow me to catch the next update. If you found this helpful, give it a like 👍 and share your thoughts 💬 — I’d love to hear what you think!
Please note: This is not financial advice. This content is to track my trading journey and for educational purposes only.

BTC 1H Analysis – Key Triggers Ahead | Day 17💀 Hey , how's it going ? Come over here — Satoshi got something for you !
⏰ We’re analyzing BTC on the 1-hour timeframe timeframe .
👀 On the 1-hour timeframe, we can see that Bitcoin, after losing the $115,000 support zone, moved toward its next support at $113,000 .
⚙️ Our key RSI zone is 27.89, and if this level is lost, Bitcoin will face more selling pressure. The next key RSI zone is 49.74, and breaking above this level could push Bitcoin higher .
🕯 The size of the red candles has increased, and with each rise in trading volume, selling pressure grows stronger. Step by step, as supports are lost (big money in whale wallets and unrealized positions being released), Bitcoin faces heavier selling pressure .
💵 USD.D on the 1-hour timeframe is moving upward and is facing a strong resistance around 4.5%. If this resistance is broken, Bitcoin will likely come under even more selling pressure .
🔔 Our Bitcoin alert zone is set at $113,000: if this zone is broken, Bitcoin could fall to lower support levels. Our alert zone for a long trade is $115,000, and by observing price action around these two zones, we can identify the best type of trade .
❤️ Disclaimer : This analysis is purely based on my personal opinion and I only trade if the stated triggers are activated .

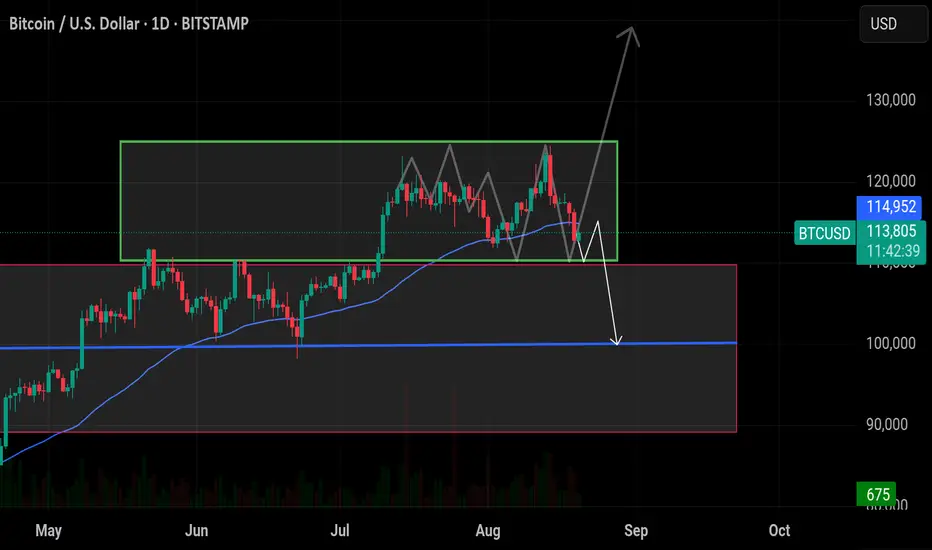
Bitcoin will bounce up from wedge to 117K pointsHello traders, I want share with you my opinion about Bitcoin. The recent price action for Bitcoin has been complex, marked by a significant breakout from a prior downward channel that failed to produce a sustained trend, leading instead to the current corrective structure. This new market phase has taken the form of a large downward wedge, a pattern of contracting volatility that often resolves to the upside. The price has been making a series of lower highs and lower lows within this wedge, with the major buyer zone around the 113000 support level acting as a foundational floor. Currently, the price is in the final stages of this consolidation, making another descent towards the apex of the wedge. The primary working hypothesis is a long scenario, based on a potential 'fake breakdown' or liquidity grab below the established support. It is anticipated that the price may briefly dip below the 113000 support level to trap sellers before staging a sharp reversal. A swift reclaim of this level would be the ultimate confirmation of the bullish thesis, validating the wedge as an accumulation pattern and likely triggering a powerful breakout to the upside. Therefore, the TP for this reversal scenario is logically set at 117000 points. Please share this idea with your friends and click Boost 🚀
Disclaimer: As part of ThinkMarkets’ Influencer Program, I am sponsored to share and publish their charts in my analysis.

$BTC — I’ve entered a short position as the September rate cut CRYPTOCAP:BTC — I’ve entered a short position as the September rate cut looks more like a sell-the-news scenario than a bullish catalyst. I expect price to slide toward 110K first, with potential continuation down to 100K if sellers keep control. Market makers might still spike price into the 120K–125K zone before the dump, but overall structure suggests lower levels ahead.
🎯 BTC Downside Targets:
110K → 105K → 100K → 95K → 90K
Bitcoin Short Setup & Long-Term Buy ZonesMy next BTC trade: short from 114,910 with a target of 111,375.8 and stop at 115,902.6.
Setup comes from the 4H order block above FVG in NY session. Expect a pullback here, then a possible next leg up toward 140K.
Also a great SPOT buy level after the short.
Key supports to watch:
110,000–109,000 (critical to hold)
Below that: 99,000–103,000
Final long-term support: 88,000–89,000.
⚠️ This is not financial advice — only my next BTC trade plan.

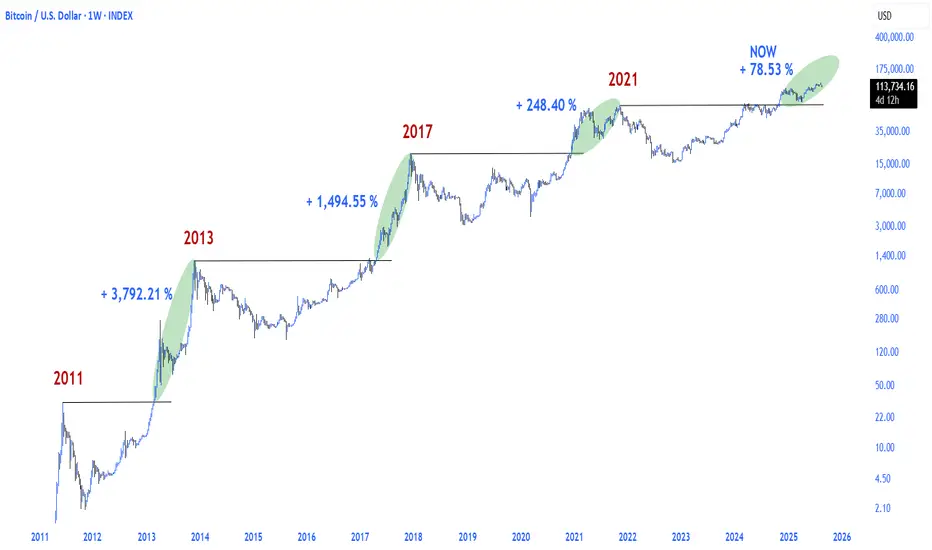
Bitcoin has not yet reached its local peakBitcoin has not yet reached its local peak and still has considerable room for growth.
CRYPTOCAP:BTC
Gamification People don't trade for money, they trade for other reasons without realising.
Many new traders, start with a point to prove. Although in the crypto space it seems to be "how to turn $100 into a Lambo" The issue is you know the majority of the comments will be from people that are way overleveraged on money they don't have.
Then you have individuals who are successful in another field, and they come to trade, thinking it's easy and they can win here as well.
The market has a way of humbling people quickly.
Gamification is more to do with people who "need to be in the market" - more trades equals more wins and more profits.
The issue is, well at least for most. Is that they dive in without really learning how to manage risk, actually no clue how to manage money properly not just the risk.
I wrote this post back in 2021 - Click it to open.
The psychology part of trading is the biggest thing most people seem to fail to understand.
It isn't just about risk management, it's about how you manage your emotions, the ability to not jump into revenge trades and beyond all of that it's about reading the markets with an appreciation of what the gamers are looking for.
Have you ever lined up a trade, you have your TP and SL mapped out, you have a clear plan - you assume your trading with an edge and you see an expected move like this?
Yet, as soon as you enter you get a run.
You see, when you are too focused on the game, you fail to read the story. Instead, you play each level as it's own map.
I covered a topic of relevance here;
This is about how you can structure the ranges, mechanically and take away the emotions and the guesswork.
When you fail to spot the signs, it's like missing a power up in a game.
The market often leaves behind footprints; these footprints help build a bias and in turn, give you more confirmation for each setup.
In this post, I explained that many new traders go seeking a silver bullet; they look for more data, indicators, screens, and instruments to trade.
I can't stress enough - less is more!!!!
Trading isn't about hoping you can turn your last $500 dollars into a retirement fund. It's about winning big and losing small. Then you refine and adjust so the win rate increases and doing it all again next week, next month, next year.
Now look at that image above and see the obvious when you zoom out.
As clear as day you can see an impulsive move, followed by a corrective move.
Instead of playing the game, try learning the map first.
This will help 100% with your win rate, that will ease your emotional anxiety and put you on the right path.
There are tools available today such as prop firms where you can reduce/limit your exposure, learn to trade as if it's a skill and not a game, and you will surprise yourself!
Stay safe! Have a great week!
Disclaimer
This idea does not constitute as financial advice. It is for educational purposes only, our principal trader has over 25 years' experience in stocks, ETF's, and Forex. Hence each trade setup might have different hold times, entry or exit conditions, and will vary from the post/idea shared here. You can use the information from this post to make your own trading plan for the instrument discussed. Trading carries a risk; a high percentage of retail traders lose money. Please keep this in mind when entering any trade. Stay safe.


BITCOIN 2020 fractal gives huge buy signal now.Bitcoin (BTCUSD) broke below its 1D MA50 (blue trend-line) emphatically for the first time in 2 months, sounding short-term fear alarms ahead of the key macroeconomic news of this week. The 1D RSI hit 40.00 however, which has been an automatic buy on both major recent lows (August 01 and June 21).
Short-term aside, it is a fractal from BTC's last Cycle in 2020 (chart on the right) that perhaps offers the most comprehensive long-term outlook, which is what has always helped us maintain an objective, stress-free perspective.
As you can see, both today and 2020 fractals display not only similar price actions but also RSI sequences. Even though naturally the 2020 rebound on the Pivot trend-line has been way more aggressive as the market was still recovering and adjusting the price from the COVID crash, today's price action display's similar phases but in a more sustainable rise.
Based on the RSI fractals, we could be in similar phase as early December 2020. This suggests that there is still upside potential that may extend to as high as 150 - 170k before this Cycle is over.
Do you think that this is a solid Profit Zone for the Cycle? Feel free to let us know in the comments section below!
-------------------------------------------------------------------------------
** Please LIKE 👍, FOLLOW ✅, SHARE 🙌 and COMMENT ✍ if you enjoy this idea! Also share your ideas and charts in the comments section below! This is best way to keep it relevant, support us, keep the content here free and allow the idea to reach as many people as possible. **
-------------------------------------------------------------------------------
💸💸💸💸💸💸
👇 👇 👇 👇 👇 👇

UK100 - potential head and shoulders on 1 hour chartWatching the UK100 for a potential short entry.
A head and shoulders pattern appears to be forming on the 1-hour chart. All my entry variables are currently met, but I’m holding off for now.
The UK100 will close in the next hour or two, and I prefer not to open a large position overnight due to potential slippage from market gaps. I’ll wait until tomorrow to see if my conditions are still valid before entering.
Trade Details:
📊 Risk/Reward: 3.5
🎯 Entry: 9 174.7
🛑 Stop Loss: 9 204.9
💰 Take Profit 1 (50%): 9 090.8
💰 Take Profit 2 (50%): 9 042.2
#GTradingMethod Tip: Always consider market timing and overnight risk when entering trades.
Thanks for checking out my post! Make sure to follow me to catch the next update. If you found this helpful, give it a like 👍 and share your thoughts 💬 — I’d love to hear what you think!
Please note: This is not financial advice. This content is to track my trading journey and for educational purposes only.

I've lost my patience with BCHMoB point... (682) I don't have much hope for pump... If the whales decide to buy... all of the above targets are possible and easy.
1. Picture before my patience runs out
2. Picture what I would like before my patience runs out.
P.S.
BCH at $5.500 || market cap $111,00B
BCH at $16.500 || market cap $333,00B

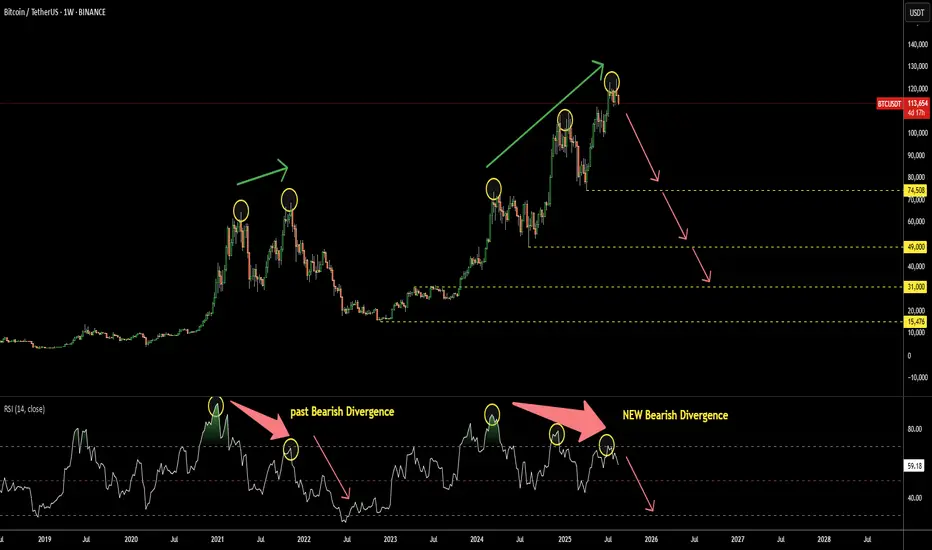
Bitcoin: This Simple Indicator Predicts Crash AheadThe Relative Strength Index (RSI) is a simple yet effective indicator, especially when it doesn't follow the market. This situation is called Divergence.
It has recently appeared on the Bitcoin chart as Bearish Divergence. This occurs when the market price makes a new peak, but the RSI, on the contrary, forms lower highs.
Looking back at the same chart, we can rewind to 2021, where a similar Bearish Divergence played out, pushing Bitcoin’s price down heavily from $69k to $15k.
This time, the Bearish Divergence on RSI is more pronounced, as it consists of 3 ascending peaks on the price chart, contrasted with 3 falling tops on the RSI sub-chart.
There are 4 key supports that could underpin the anticipated crash:
1) $74.5k - This year’s bottom
2) $49k - Consolidation low in 2024
3) $31k - Consolidation top in 2023
4) $15.5k - 2022 minimum
Where do you think the crash will stop?
BITCOIN signs of WEAKNESSTwo weekly rejections and wicks from $119,500, with continued decline, signal Bitcoin's weakness, even if a bounce occurs.

Will Bitcoin Able to Breakdown Below $111,950?On the daily timeframe, Bitcoin CRYPTOCAP:BTC is showing signs of potentially forming a Double Top reversal pattern , indicating a possible trend shift from bullish to bearish. Should the price break below $111,950, Bitcoin could decline toward the $104,320 range, which also coincides with a fair value gap area.
Although the liquidation map from Coinglass highlights liquidation clusters between $110,841 and $111,905, traders and investors are advised to remain cautious in anticipating Bitcoin’s volatile price movements.

BTCUSD H4 | Could the price bounce from hereBitcoin (BTC/USD) is falling towards the buy entry at 110,102.76, which is a pullback support that is slightly above the 127.2% Fibonacci extension and the 61.8% Fibonacci retracement and could bounce from this level to the upside.
Stop will be at 105,282.37, which is a pullback support that is slightly above the 78.6% Fibonacci retracement.
Take profit is at 116,140.42, which is a pullback resistance.
High Risk Investment Warning
Trading Forex/CFDs on margin carries a high level of risk and may not be suitable for all investors. Leverage can work against you.
Stratos Markets Limited (tradu.com ):
CFDs are complex instruments and come with a high risk of losing money rapidly due to leverage. 65% of retail investor accounts lose money when trading CFDs with this provider. You should consider whether you understand how CFDs work and whether you can afford to take the high risk of losing your money.
Stratos Europe Ltd (tradu.com ):
CFDs are complex instruments and come with a high risk of losing money rapidly due to leverage. 66% of retail investor accounts lose money when trading CFDs with this provider. You should consider whether you understand how CFDs work and whether you can afford to take the high risk of losing your money.
Stratos Global LLC (tradu.com ):
Losses can exceed deposits.
Please be advised that the information presented on TradingView is provided to Tradu (‘Company’, ‘we’) by a third-party provider (‘TFA Global Pte Ltd’). Please be reminded that you are solely responsible for the trading decisions on your account. There is a very high degree of risk involved in trading. Any information and/or content is intended entirely for research, educational and informational purposes only and does not constitute investment or consultation advice or investment strategy. The information is not tailored to the investment needs of any specific person and therefore does not involve a consideration of any of the investment objectives, financial situation or needs of any viewer that may receive it. Kindly also note that past performance is not a reliable indicator of future results. Actual results may differ materially from those anticipated in forward-looking or past performance statements. We assume no liability as to the accuracy or completeness of any of the information and/or content provided herein and the Company cannot be held responsible for any omission, mistake nor for any loss or damage including without limitation to any loss of profit which may arise from reliance on any information supplied by TFA Global Pte Ltd.
The speaker(s) is neither an employee, agent nor representative of Tradu and is therefore acting independently. The opinions given are their own, constitute general market commentary, and do not constitute the opinion or advice of Tradu or any form of personal or investment advice. Tradu neither endorses nor guarantees offerings of third-party speakers, nor is Tradu responsible for the content, veracity or opinions of third-party speakers, presenters or participants.

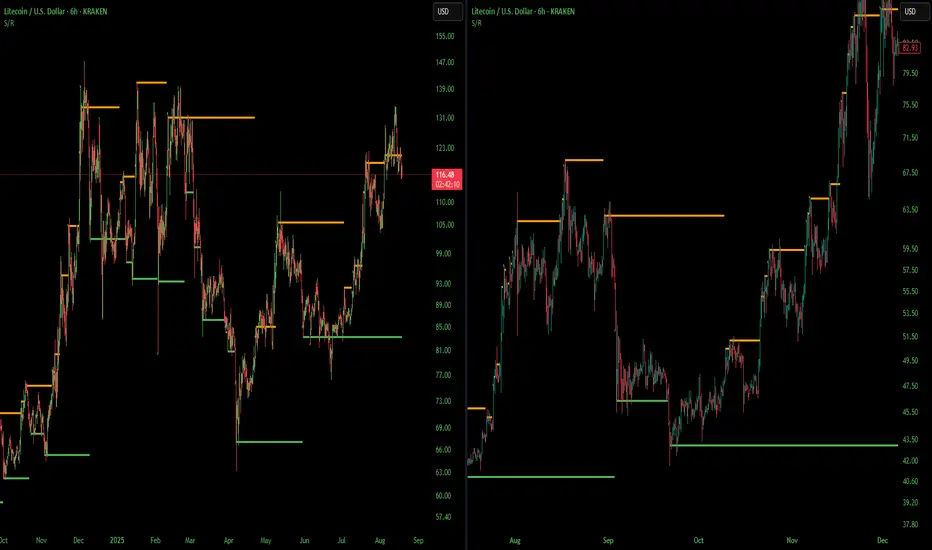
Not Exact But Man Does It Look Similar LTCUSDI had pointed this out in a previous chart but i thought I would zoom in and show how similar these look. I think its launch time, last time LTC was at this point it did a 10x in a month. Alt season starts when Litecoin says so. Not financial advice just my opinion. Thank you
BTC 4HBullish movement imminent, looking for the liquidity zone at $120,400. 🖤😎
Bullish divergence in formation

Double-Top: Bitcoin Headed Toward Support, $100K ActiveWe are using long-term numbers. The number that produced the double-top bearish signal is $122,524. Bitcoin couldn't pass beyond this level. The weekly rejection reveals that a test of support will follow next.
Before $122,524 the next major Fib. level sits at $102,077, the 1.618 extension. This is where Bitcoin is headed next.
We have $112,000 as support but this a short-term support. Notice this weekly chart more focused on the long-term. Here it is easier to see, easier to appreciate that Bitcoin is not likely to hold $112K. Nothing to worry about though.
A drop toward $100,000 (above) would mean a full flush for Bitcoin and the doors opening for a new major wave of growth. Make no mistake, the current move is running its course.
Bitcoin is likely to drop only for a few more days. Settle the low, recover long-term. The altcoins will shake but will also recover in a matter of days. This is a momentary event, Crypto will continue to grow. The bull market is not over. The best is yet to come.
Namaste.

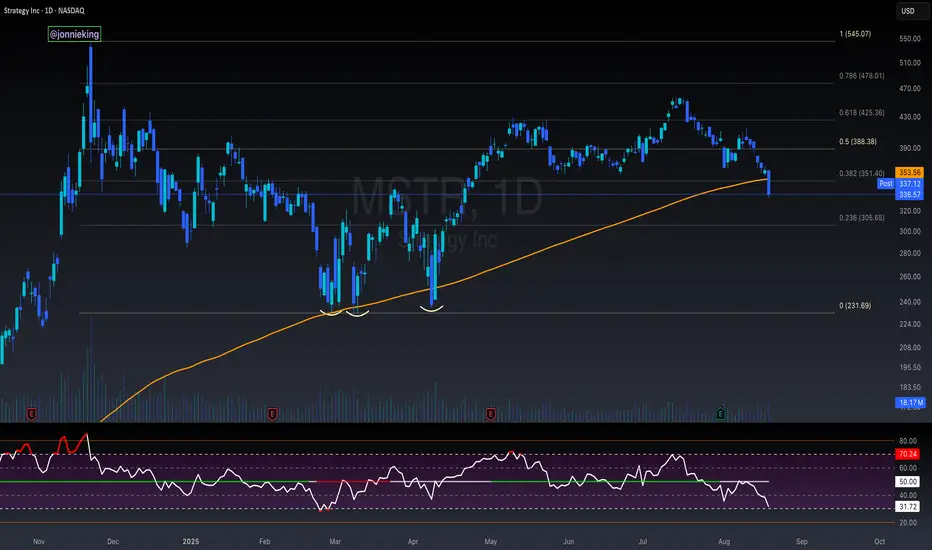
$MSTR Testing Historical Key Support at 200DMAMicroStrategy had its largest daily close below the 200DMA in the past 893 days.
Historically this support level has market key bottoms.
RSI allows for a bit more pain to the downside, but NASDAQ:MSTR should find a bottom soon.
If not, $305 is in play.