BITCOIN SIGNAL: HUGE MOVE IN DIRECTION NOBODY EXPECTED INCOMING!Yello Paradisers! Let me know your thoughts in the comment section below!
And Paradisers! Keep in mind to trade only with a proper professional trading strategy. Wait for confirmations. Play with tactics. This is the only way you can be long-term profitable.
Remember, don’t trade without confirmations. Wait for them before creating a trade. Be disciplined, patient, and emotionally controlled. Only trade the highest probability setups with the greatest risk to reward ratio. This will ensure that you become a long-term profitable professional trader.
Don't be a gambler. Don't try to get rich quick. Make sure that your trading is professionally based on proper strategies and trade tactics.
Btc-bitcoin

BTC (Y26.P3.E1). Looking for a Grantley HarmonicHi traders,
We are looking for more highs and in the short term, the daily level will likely be resistance and hence a shorting scalp opportunity is likely there. On the bigger picture, a Gantley harmonic could be the target as it will take out much of the liquidity. I was hoping for an ATH around 127k or more for the cup and handle target but we might not get that any time soon. I have tweeted many times that September will be bearish and October and November bullish. I don’t envision this time the Harmonic is a topping structure, but we can’t rule it out.
All the best,
S.SAri.

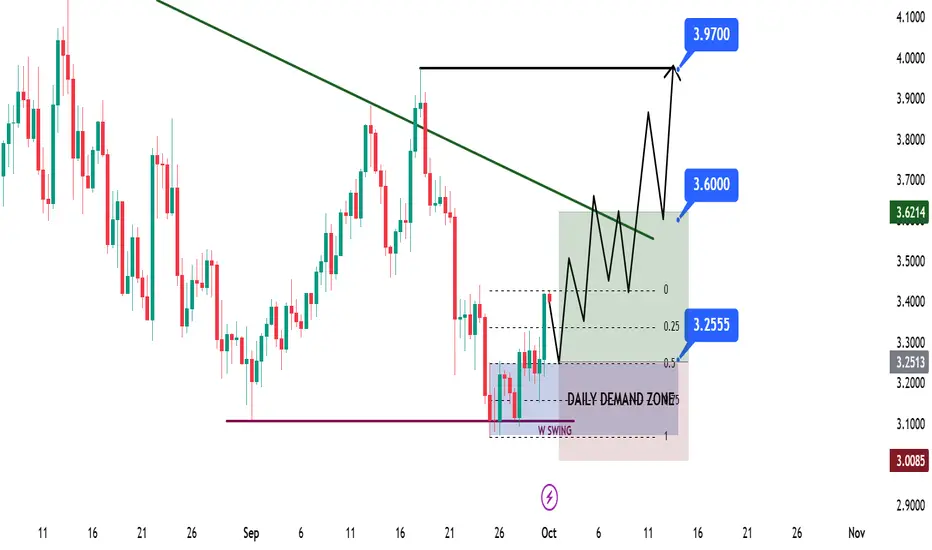
SUI Swing Long Opportunity - HDDZ Model SUI Swing Long Opportunity – HTF Demand w/ Discount Zone (HDDZ Model)
📊 Market Sentiment
FED has resumed its rate-cutting cycle, starting with a 0.25% cut in September, with two more expected. Institutional liquidity inflows have accelerated as the U.S. officially adopts crypto as part of its reserves. Despite elevated inflation, a weakening labor market is forcing the FED to ease, pushing more capital into risk-on assets.
📈 Technical Analysis
SUI is bullish on HTF, so only long setups are considered. Price recently swept the weekly swing liquidity and closed above, then broke market structure on LTF — confirming bullishness and creating a valid Daily Demand zone. Price has already tested this zone once and found rejection, validating its significance.
Currently, price is rejecting from the bearish LTF trendline above, which remains a key resistance. A retest of the confluence at 3.25$ (Daily Demand + Discount Zone) offers a strong setup for continuation higher.
📘 Model to be used – HDDZ (HTF Demand w/ Discount Zone)
In this model, I first confirm HTF bias. Then, I look for creation of HTF Demand zones. Finally, I use Fibonacci retracement to locate the discount zone. When both the demand zone and discount zone align, it creates a strong confluence for trade entries.
📌 Game Plan
1-Wait for price to revisit 3.25$ confluence zone.
2-Carry trade toward bearish LTF trendline, securing profits early if price rejects.
🎯 Setup Trigger
Entry confirmation once price hits 3.25$.
📋 Trade Management
Stoploss: 2.97$
Targets:
TP1: 3.61$
TP2: 3.97$
After TP1, move SL to breakeven to secure the position.
💬 Like, follow, and comment if this breakdown supports your trading! More setups and insights coming soon — stay connected!
⚠️ Disclaimer: This content is for informational and educational purposes only and does not constitute financial, investment, or trading advice. Always DYOR before making any financial decisions.
XRP Swing Long Opportunity - LRKZ MODELXRP Swing Long Opportunity
📊 Market Sentiment
FED has resumed its rate-cutting cycle, starting with a 0.25% cut in September, with two more 0.25% cuts expected in the coming months. Additionally, institutional liquidity inflows have accelerated as the U.S. officially adopts crypto as part of its reserves. While inflation remains elevated, the weakening labor market is forcing the FED to ease, driving more capital into risk-on assets.
📈 Technical Analysis
Price made a new all-time high and is currently retracing before pushing higher again.
Price ran the weekly swing liquidity at $2.70 and closed above with a wick, confirming manipulation before expansion.
Price also retested the broken HTF Demand zone at $2.69, which was strong resistance previously and now acts as strong support.
These confluences strongly suggest rejection and continuation higher.
📘 Model to be used – HTF Liquidity Run into HTF Key Zone (LRKZ Model)
In this model, I first define the HTF trend. Then, I look for the most significant liquidity that lies opposite to the HTF trend (swing highs or lows). These zones often contain enough liquidity to trigger reversals or strong bounces. When price sweeps this liquidity and retests an HTF Key Zone (where strong limit orders sit), it creates a high-probability setup. Confirmation on LTF then provides the entry trigger.
📌 Game Plan
Price already closed above the $2.70 level, confirming entry. Looking for continuation higher with structured targets.
🎯 Setup Trigger
Setup is active long position valid after the daily close above $2.70.
📋 Trade Management
Stoploss: Daily close below $2.70 or hard stop at $2.50.
Targets:
TP1: $3.18
TP2: $3.37
TP3: $3.66 (ATH)
After TP1 is secured, I will move stoploss to breakeven and scale profits as price moves toward higher targets.
💬 Like, follow, and comment if this breakdown supports your trading! More setups and market insights coming soon — stay connected!
⚠️ Disclaimer: This content is for informational and educational purposes only and does not constitute financial, investment, or trading advice. Always DYOR before making any financial decisions.

Bitcoin - Key support $105 - 107k Buyers Should step inBitcoin - Key support $105 - 107k Buyers Should step in or up trend is over
best confirmation for me Open interest absorption

Bitcoin top not is in.2011, 2013, 2017, 2021… and next up, 2025.
The cycle is not complete. The chart speaks for itself.
CRYPTOCAP:BTC ₿

Bitcoin in Q4 As "Uptober" begins the layout for Bitcoin is as follows:
- Downtrend on the daily officially since 18th September but really it began after the SFP of ATH on August 14th.
- The origin of the rally to ATH has served as support twice since at $108,000
- Diagonal trendline resistance being tested as Q4 begins, seasonality shows October is very strong for returns, 21.89% average since 2019.
- Compression of the range inevitably leads to a breakout in either direction.
Bullish scenario is reclaim of $117,500 to push towards ATH.
Bearish scenario is a loss of $108,000
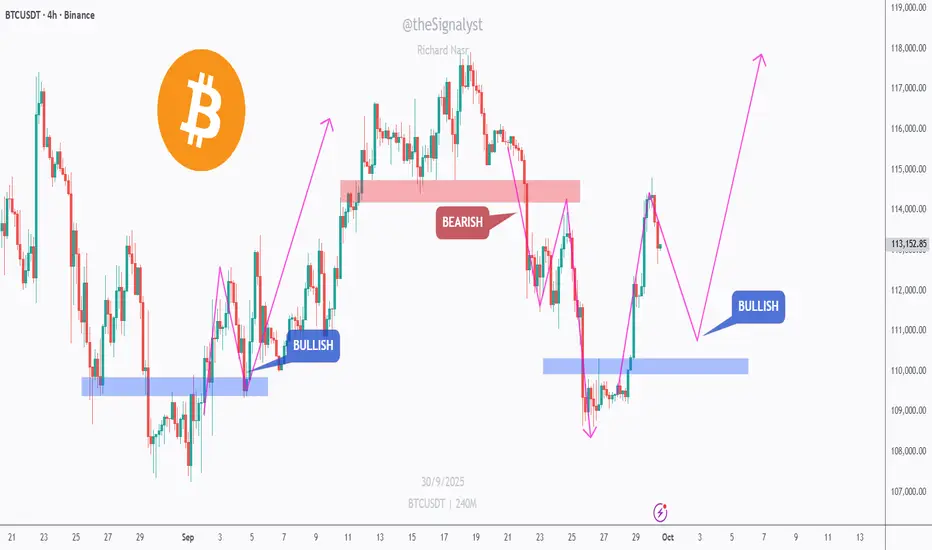
$BTC – Flip Zones Driving 4H StructureCRYPTOCAP:BTC flipped bullish after reclaiming the blue demand, then turned bearish at the red supply. We’re now pulling back from resistance, and the next clean setup likely forms on a retest of the blue zone.
🔑 Key zones
Support (blue) ~$111k area — former base of the last impulse.
Resistance (red) ~$114.5k–$115k — where sellers capped the rally.
🔎 Confluence
Prior bearish rejection at red + bullish reaction at blue.
Clear HH/HL structure only resumes if price holds blue and pushes back above red.
📊 Scenarios
Bullish 📈 Pull back into $111k (blue), print higher-low / bullish candle, then continuation toward $115k → $117k.
Bearish 📉 Lose the blue zone with a strong 4H close → open room for a deeper dip before buyers try again.
⚠️ Disclaimer: This is not financial advice. Always do your own research and manage risk properly.
📚 Stick to your trading plan regarding entries, risk, and management.
Good luck! 🍀
All Strategies Are Good; If Managed Properly!
~Richard Nasr.
Impulse Wave 5 Near Completion: Short Setup Ahead?The 5th wave of the current impulse structure is close to completion. Price action is showing exhaustion and the drop in volume is confirming that momentum is fading. At this stage, risk for longs is increasing and the probability of a corrective phase (A-B-C) is high.
Traders should keep an eye on bearish confirmation signals such as trendline breaks, bearish engulfing bars, or supply zone failures. A short setup could develop soon if price rejects with conviction.
Patience is key — Wave 5 can stretch, but once it’s done, downside pressure usually accelerates quickly. Manage risk carefully and adjust sizing according to your strategy.

BTC to go Parabolic to $333K, ~100 oz Gold by EOY 2025 Gold and Bitcoin are both valuable hard assets and from my observation, the Bitcoin chart to Gold is much better predictable than it's price to USD. The reason might be because Gold holds it's purchasing power over time through the history, and in fact it is the base line for the purchasing power, but Dollar depends on how much it gets printed and cannot be reliably predicted. That's why when you look at BTC/Gold chart, most of the times you see exact double tops or exact double bottoms.
I was predicting BTC would get to $100K USD when it hits it's previous top to Gold (37 oz) and so I was predicting about 8 month before it happens that BTC will be $100K when Gold is 2650 and it happened. I was surprised myself that it held true.
Looking into Gold price history, we can reliably say that Gold will not stop here and will march to $8000 within couple of years. However I think it has hit it's top for the year, or max $4000 will be the 2025 top. Then when Gold pulls back, BTC will get the chance to go parabolic, and has it's last rise of this bull market, and I expect it should take BTC to near 100 oz Gold. So if we want to put all together, Gold = 3350 where it pulls back and BTC= 100 oz = $335,000. I know the Bitcoin whales are playful sometimes, so we might get into $333,333 per BTC.
I remember in Nov 2013 everyone was talking about bitcoin flipping gold (1 BTC getting to 1 oz Gold) and well, it didn't happen at that time and it had to come back in 2017, but it got close enough. We might have the same kind of situation here so starting to drop anywhere from $270k to $330k might be what we get.
I don't publish many analysis's on TV, but I thought I'd put this here, it might get me famous ;)

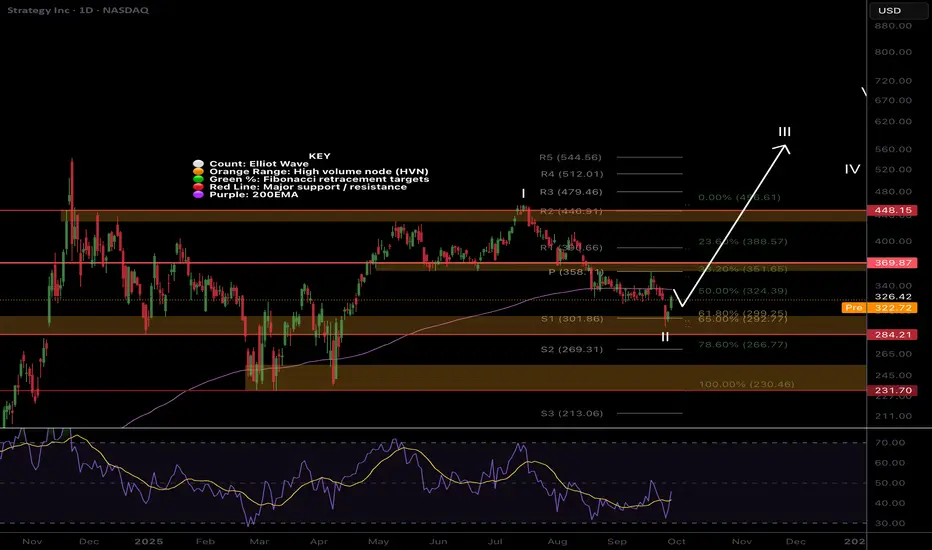
MSTR Wave II bottom?NASDAQ:MSTR is finally catching a bid from the triple support zone of the Fibonacci golden pocket, S1 pivot and High Volume Node.
It must overcome the daily 200EMA to add confidence to a reversal and wave II bottom being in.
Daily RSI has printed bullish divergence from oversold. Vanguard disclosed massive MSTR holdings ad the sentiment is awful online adding confluence to a bottom soon.
Wave III target is the R5 daily pivot $544, losing the support zone has a downside target of $232
Safe trading
COIN wave 5 Underway!NASDAQ:COIN wave 4 appears complete at the expected Fibonacci retracement 38.2 and High Volume Node support.
A local channel has formed which could be a bear pennant so bulls should watch out. A breakout of this would hit resistance at $360 High Volume Node and the first take profit area from my recent trade. Clearing this Nose will confirm wave 5 is underway to new all time highs $500+
RSI is flipping bullish from oversold and the dail 200EMA continues to rise.
Safe trading

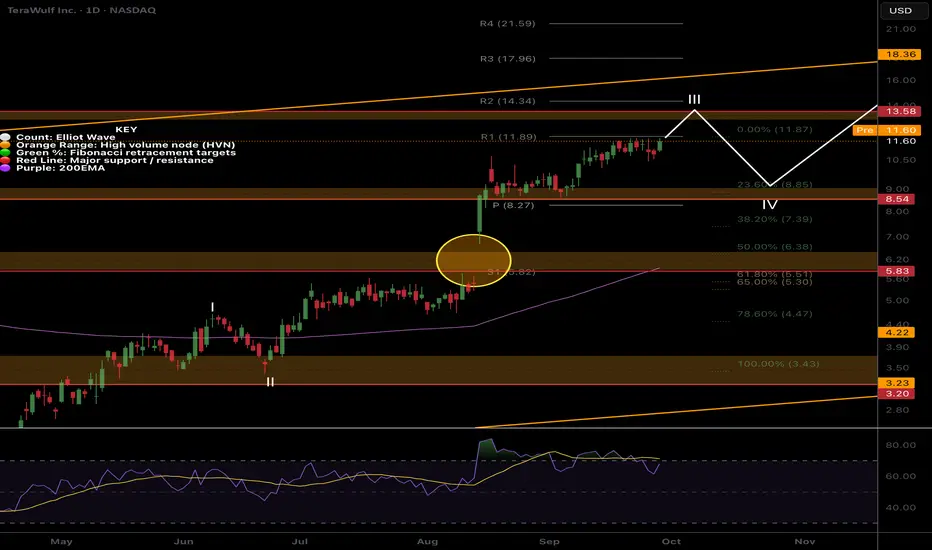
WULF Still in wave 3!NASDAQ:WULF continues to push onwards in wave 3 although gradually. The first target remains $13.48 High Volume Node followed by the macro channel upper boundary trend-line.
Support target is the daily Pivot and High Volume Node at at $8.27 and this is also the wave 4 expected Fibonacci retracement zone of 23.6-38.2.
Daily RSI does have bearish divergence from overbought so a retracement is likely.
Safe trading
IREN still in the bull-trend range!NASDAQ:IREN continues upwards in a tight bullish channel but how long can this extend? R5 pivot targets suggest $65.
Bearish divergence in overbought RSI keeps being negated for now.
Wave (4) downside target is currently the 38.2 Fibonacci retracement at $30.44 and this iwll extend higher as long as price does.
Safe trading

HUT downside still to come?NASDAQ:HUT has had a great rally finally being subdued by the macro channel upper boundary resistance sending price back to the High Volume Node support on overbought RSI.
RSI has reset to the EQ but has room to fall (or grow again). The next target is the High Volume Node resistance and R4 pivot at $44 with a terminal target of $65
If price loses the support node the next support target is the pivot and wave 1 high $24 and I would look out for a long here if we get it.
Safe trading

BTDR Bounces from previous swing high support!NASDAQ:BTDR found support at the at the wave 1 high and R1 pivot and looks poised to continue to the first take profit target and all time High Volume Node tat $25! Wave (3) of 3 appears to be underway so should continue to be powerful!
Analysis is invalidated if we drop below $13 and lose the High Volume Node support which sits at the Fibonacci golden from the wave (2) bottom.
RSI did not reach overbought so has room to grow.
Safe trading

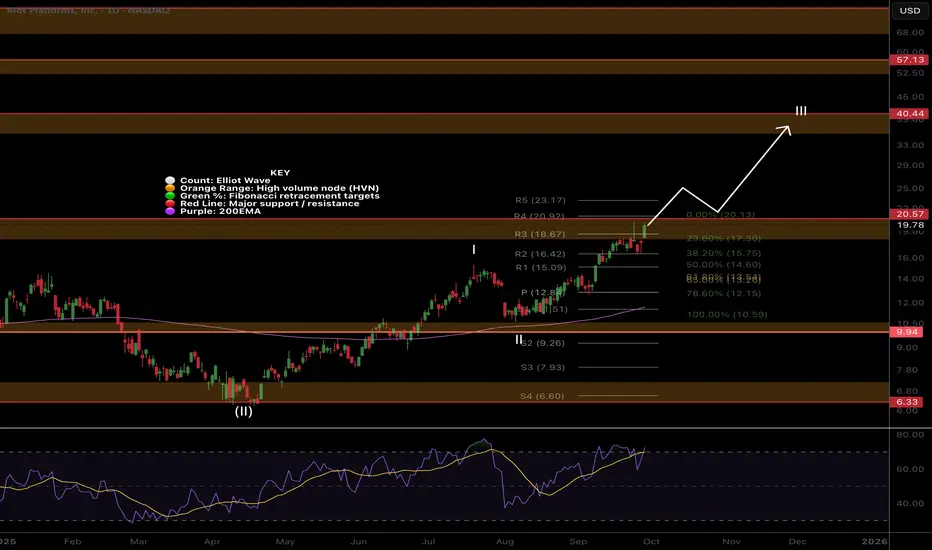
RIOT doesn't want to retrace this time!After hitting the High Volume Node and first take profit area NASDAQ:RIOT was rejected as expected but instead of a deep retracement continued to push powerfully back into the node looking poised for a breakout above!
Once the resistance is clear and tested as support RIOT should move quickly to the next High Volume Node and take profit area at $40.
Analysis is invalidated below the R2 pivot, $16, and the retracement will instead be underway!
Safe trading
MARA Huge bullish engulfing!NASDAQ:MARA had a huge bullish engulfing candle yesterdays almost eclipsing 9 days of price action in 1 session, a characteristic candle for wave 3!
Partial take profit target for me is the High Volume Node between the R4 and R5 pivot, $20, where I expect price to struggle before more upside. Next target is $28 at the descending macro resistance trend-line.
RSI didn't hit overbought and was rejected back to EQ resetting for higher.
Safe trading

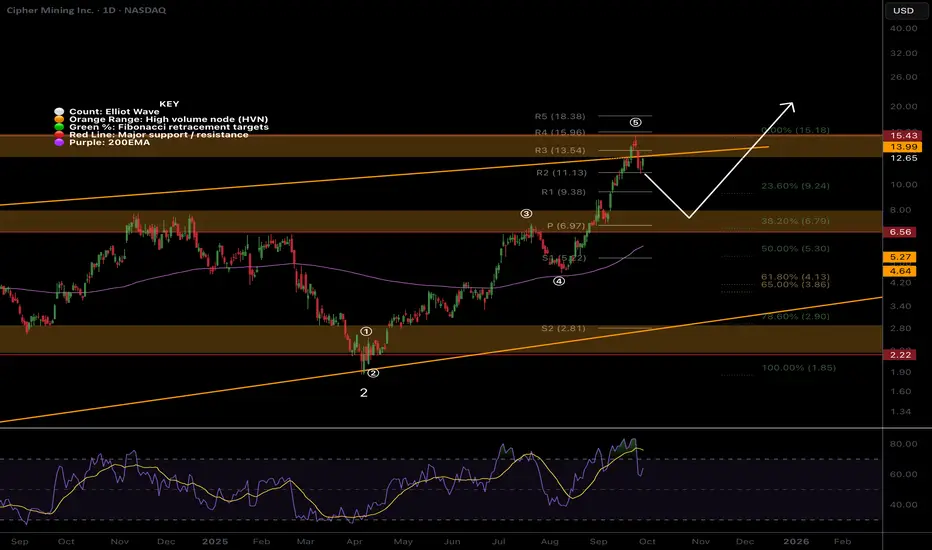
CIFR deep pullback before more upside?CIFR appears to have completed 5 waves for wave (1) of 3 completing at the previous all time High Volume Node where we expect Elliot wave 1s to complete. The orange channel boundary also had a throwover and drop back, an ending pattern!
Wave (2) has an expected shallow pullback of the 38.2 Fibonacci retracement at the daily pivot and High Volume Node support $7 where I will look out for long signals. The ascending 200EMA will also meet this point making it a quadruple support and an excellent opportunity area if price gets there!
If we continue into price discovery the analysis will be invalidated and I'll take a breakout long.
Daily RSI hit overbought but has since fell with no divergence.
Safe trading
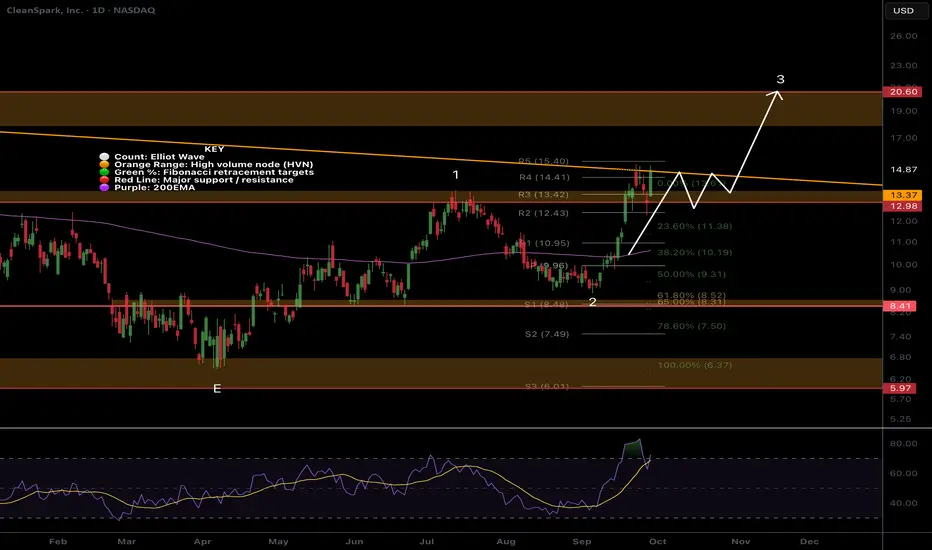
CLSK Attempting a significant resistance breakout!NASDAQ:CLSK has awoken at long last and has smashed through the wave 1 resistance High Volume Node straight into the Macro Triangle upper boundary i have been sharing in the weekly time frame posts. Breaking out above this and wave D at $20 will be a bullish signal with significant upside to come!
The High Volume Node resistance held as support in the big drop last week, quickly recovering back to highs showing strong demand.
The next local target is the wave D resistance $20 with continued upside in wave 3
Daily RSI is overbought but divergence yet and daily 200EMA has flicked positive.
Analysis is good unless we go back below wave 2 into the golden pocket.
Safe trading
$BTC Following $GOLD - Parabola Incoming !P.S. CRYPTOCAP:BTC still on track to follow the TVC:GOLD parabola with this 10-12 week fractal which we should see between Thanksgiving and Christmas 🦃🎅
Will be following GOLD a bit more closely as Total Global Liquidity gave its first real fake-out showing ATH at EOM.

BTC OutlookI strongly believe BTC reached the ultimate top. Sell the Top!
I predicted the 2022 BTC bottom, now I predict the 2025 top.

Bitcoin Bounces Strongly from Key Support – What’s Next?🔎 Technical Outlook (BTC/USDT, 4H):
1. Key Support: Bitcoin held the 110K – 112K zone, a historically strong demand area that triggered a solid rebound.
2. Channel Breakout: Price has broken out of a short-term descending channel, shifting momentum in favor of the bulls.
3. Immediate Resistances:
• First resistance: 115.5K – 116K
• Next major resistance: 118K – 120K (upper channel boundary)
4. Scenarios:
• 🟢 A confirmed breakout above 115.5K opens the path toward 118K → 120K.
• 🔻 Failure to clear resistance could trigger another pullback toward 112K or even a retest of 110K.
📌 Summary: Bitcoin has defended its major support and is showing bullish momentum in the short term. However, the upcoming tests at 115K+ will decide whether this move evolves into a stronger rally or just a corrective bounce.
